Community Detection on Urban Street Networks: A
Segmentation Model for Urban Logistics Policy and
Planning
by
Margaret Olivia Wilson
B.S., Ohio State University (2016)
MASSACHUSETS INSTITUTE
OF TECHNOLOGY
JUL
10
2019
LIBRARIES
ARCHIVES
Submitted to the Department of Civil and Environmental Engineering
in partial fulfillment of the requirements for the degree of
Master of Science in Transportation
at the
MASSACHUSETTS INSTITUTE OF TECHNOLOGY
June 2019
@
Massachusetts Institute of Technology 2019. All rights reserved.
Author ...
Certified by .
Signature redacted
...
..
. . . . .. .Dfyprt nnt of Civil and Environmental Engineering
Zirn
ti inr
rinrinti
May 17,
2019
ILLI j
Matthias Winkenbach
Director, Megacity Logistics Lab
Signature redacted
Thesis Supervisor
Certified by
....
'7
Accepted by...
Ii Q;ri r~Yossi Sheffi
Elisha Gray
II
Professor of Engineering Systems
+
A
+ A
Thesis Supervisor
"
I
3
U
eI
I
luaC
.lu
S/
/
Heidi Nepf
Donald and Martha Harleman Professor f Civil and Environmental
Engineering
Chair, Graduate Program Committee
Community Detection on Urban Street Networks: A Segmentation
Model for Urban Logistics Policy and Planning
by
Margaret Olivia Wilson
Submitted to the Department of Civil and Environmental Engineering on May 17, 2019, in partial fulfillment of the
requirements for the degree of Master of Science in Transportation
Abstract
This thesis considers the community detection methods employed by network studies in a wide variety of contexts and adapts their use to the segmentation of an urban street net-work. In order to form partitions of urban street networks that are manageable as delivery territories or similar units of spatial aggregation, e.g., discrete demand zones, to be used in a study of urban freight distribution, extant community detection methods are assessed and adapted. Numerical experiments demonstrate that the sub-networks formed by these par-titions display travel properties that make them a useful model for logistics transportation, especially in contexts where continuum approximation methods might be employed. The ratio of simulated trip distances over the actual road network to the idealized distance be-tween the trip endpoints is used as a metric to quantify some travel properties of these seg-ments. This ratio describes the magnitude of detour required by network conditions, which can offer a proxy for travel efficiency due to road network variations across a city. Us-ing this metric, network-based partitionUs-ing algorithms are shown to produce sub-networks with internal travel conditions that are on average more efficient and less variable than sub-networks produced from extant methods of urban segmentation. This result is demon-strated on a wide variety of test networks in cities worldwide. In addition, a secondary use case as a decision-support tool for policymakers is proposed. Since this algorithm creates areas with a flexible spatial resolution in which boundaries are defined by infrastructure and geography, it may constitute a useful way to delineate areas where policy interventions should be employed. Because the impact and presence of freight traffic vary with local land uses (e.g., commercial, residential, industrial), the land use characteristics of these segments are also investigated to determine if network-based segmentation models capture more variation in land use characteristics than alternative methods.
Thesis Supervisor: Matthias Winkenbach Title: Director, Megacity Logistics Lab Thesis Supervisor: Yossi Sheffi
Acknowledgments
Many thanks to my advisor, Dr. Matthias Winkenbach, and my labmates at the MLL who have given me tremendous support, guidance, and shared knowledge over the past few years. Your attitudes of patience, perseverance, and generosity in the face of intellectual challenges are commendable and will be carried with me.
Contents
I Urban Segmentation for Planning Logistics Distribution Networks 13
1.1 Introduction . . . . 13
1.2 Literature Review . . . . 18
1.2.1 Community Detection . . . . 18
1.2.2 Route Length Approximation and Road Network Circuity . . . . . 26
1.2.3 Urban Network Science . . . . 28
1.3 Urban Segmentation Model Implications for Urban Logistics . . . . 30
1.3.1 Primal and Dual Representations of Street Networks . . . . 31
1.3.2 Comparative Study of Partitioning Algorithms on Street Networks . 33 1.3.3 Recursive Algorithm for Controlling Segment Size . . . . 43
1.3.4 Comparison to Alternative Segmentation Methods . . . . 44
1.3.5 Validation On Other Case Study Cities . . . . 55
II Case Study: Urban Segmentation and Freight Policy Development 63 11.1 M otivation . . . . 64
11.1.1 Urban Freight Policy . . . . 64
11.1.2 Factors Impacting Demand for Freight Transportation . . . . 66
11.2 Case Study: Borough of Brooklyn, NY, USA . . . . 67
11.2.1 D ata Sources . . . . 68
11.2.2 A nalysis . . . 68
11.2.3 R esults . . . . 70
List of Figures
1.1.1 Detour necessitated by river and one-way streets, Sio Paulo, Brazil . 16
1.3.1 Executing a community detection algorithm on a primal street graph labels nodes, which must then be translated to edge labels, while exe-cuting on a dual street graph labels edges directly . . . . . . . . . 32 1.3.2 Area of 100 km2 test network in Sdo Paulo, Brazil. . . . . . . . . 33 1.3.3 Circuity factors for four detection methods, compared between
intra-community (internal) and inter-intra-community (external) trip classes.. . . 37
1.3.4 Evolution of a-shapes as parameter a changes . . . . . . . . . . 40
1.3.5 Schematic representation of sampling process for origins and destina-tions in trip-based convexity metric. . . . . . . . . . . . . . . 42
1.3.6 Dimensional characteristics describing roadways of subnetworks in city segments produced by various segmentation methods (I of 2) . . . . 48
1.3.7 Dimensional characteristics describing roadways of subnetworks in city segments produced by various segmentation methods (2 of 2) . . . . 49 1.3.8 Topological characteristics describing roadways of subnetworks in city
segments produced by various segmentation methods (I of 2). Shaded areas represent plus/minus one standard deviation of all values in each segment. Note that for all metrics presented here, values below zero are not possible. . . . . . . . . . . . . . . . . . . . . . . 50
1.3.9 Topological characteristics describing roadways of subnetworks in city segments produced by various segmentation methods (2 of 2). Shaded areas represent plus/minus one standard deviation of all values in each segment. Note that for all metrics presented here, values below zero are not possible. . . . . . . . . . . . . . . . . . . . . 51
1.3.10 Result of recursive USM algorithm on 400 km2 of Sdo Paulo local
streets . . . . . . . . . . . . . . . . . . . . . . . 54
1.3.11 Comparison of segment maps produced for test networks in global cities (1 of 5) . . . . . . . . . . . . . . . . . . . . 58 1.3.12 Comparison of segment maps produced for test networks in global
cities (2 of 5) . . . . . . . . . . . . . . . . . . . . 59 1.3.13 Comparison of segment maps produced for test networks in global
cities (3 of 5) . . . . . . . . . . . . . . . . . . . 60
1.3.14 Comparison of segment maps produced for test networks in global cities (4 of 5) . . . . . . . . . . . . . . . . . . 61 1.3.15 Comparison of segment maps produced for test networks in global
cities (5 of 5) . . . . . . . . . . . . . . . . . . . . 62
11.2.1 Map of segments identified by USM algorithm in Brooklyn, NY . . . 70
11.2.2 Pixels and USM-based polygons in Brooklyn study area . . . . 71 11.2.3 Distributions of dedicated square meters of floor area per square
kilo-meter of land, separated by land use category . . . . . . . . . . . 72
11.2.4 Maximum-intensity office/commercial segment colored on road map, next to its coinciding ZIP code 11201, and with Google neighborhoods labeled . . . . . . . . . . . . . . . . . . . . . . . 75 11.2.5 Maximum-intensity office/commercial segments under each
List of Tables
1.2.1 Summary of algorithm characteristics and relative strengths and weak-nesses . . . . . . . . . . . . . . . . . . . . . . . 27 1.3.1 Summary of community detection algorithm results on 100 km2
sam-ple netw ork . . . . . . . . . . . . . . . . . . . . . . 35 1.3.2 Summary of circuity results on 100 km2 sample network . . . . . . 36 1.3.3 Average convexity measures of community maps produced by each
algorithm on the test network . . . . . . . . . . . . . . . . . 40 1.3.4 Fraction of peripheral trips departing subgraph, average across all
sub-graphs produced by each algorithm. . . . . . . . . . . . . . . 43
1.3.5 Summary of circuity and trip-based convexity results on 400 km2 sam-ple network . . . . . . . . . . . . . . . . . . . . . . 46
1.3.6 Summary of circuity results on 100 km2 road network samples in vari-ous cities . . . . . . . . . . . . . . . . . . . . . . . 56
11.2.1 Field descriptions from NYC Department of Planning PLUTO Dataset used in Brooklyn case study . . . . . . . . . . . . . . . . . 69
11.2.2 Summary statistics of land use distributions for USM, ZIP code, and pixel-derived segments. . . . . . . . . . . . . . . . . . . . 74
Chapter I
Urban Segmentation for Planning
Logistics Distribution Networks
1.1
Introduction
In freight distribution networks, the final tier or tiers of product distribution towards a customer are referred to as the last mile. Particularly in urban environments, last-mile distribution is often the most expensive, complex, and uncertain part of the global supply chain [Gevaers et al., 2011]. The planning and operational challenges posed by this setting, motivated by the practical need to distribute goods in urban areas, have led to last-mile distribution receiving increasing attention in both practitioner-oriented and academic lit-erature. Two major factors drive the urgency of this problem: rapid urbanization and a changing market for last-mile delivery services. Between 2018 and 2050, the UN projects that the proportion of global population residing in urban areas will rise from 55% to 68%
[United Nations Population Division, 2017]. Concurrently, we observe an increasing frag-mentation of demand for urban logistics services, both in business to consumer (B2C) and business to business (B2B) markets, due to an ongoing boom in e-commerce and omni-and multi-channel distribution schemes. This growth drives a trend towards a higher num-ber of small, direct shipments to individual consumers and, consequently, rapid growth in the number of delivery destinations compared to traditional brick-and-mortar retail, where logistics providers deliver goods to central store locations. The effects of this trend are
am-plified by rising customer expectations in terms of delivery lead-time, time-windows, and shipment individualization. Meanwhile, increasing fragmentation of shipments in urban B2B logistics is largely driven by the importance of the traditional highly fragmented retail channel in emerging economies and the growth of hyper-local fulfillment (i.e., the trend of keeping inventory close to the customer to ensure short delivery times) in developed and heavily urbanized markets [Fransoo et al., 2018].
A major stream of work addressing these problems is the design of last-mile delivery
strategies. This problem integrates both facility location and vehicle routing decisions, and typical approaches employ a few notable, well-established approximation methods largely focused on reducing complexity by estimating travel distances along delivery routes. Loca-tion routing problems (LRP) are well studied in literature [Prodhon and Prins, 2014, Drexl and Schneider, 2015]. It is the size and complexity of these problems, when applied to last-mile logistics operations in urban contexts, which often include over tens or hundreds of thousands of customers, that renders exact routing approaches to be intractable. Therefore, route length estimation formulae are shown to approximate operational routing decisions sufficiently well while leading to substantial reductions in computation times for the LRP [Smilowitz and Daganzo, 2007, Nagy and Salhi, 2007, Winkenbach et al., 2015]. A useful quantity in such approximations is the so-called "circuity factor", describing the directness of local travel within a certain subset of an urban area. In routing approximations such as the continuum approximation (CA)-based methods applied in the previously cited works, this quantity multiplied with the Euclidean distance between the trip's origin and destina-tion can be used to approximate trip distances by incorporating some measurements of the properties of the network over which travel is conducted. This convention can be applied to estimate travel distances at the regional level [Ballou et al., 2002] and local trips within a city [Ballou et al., 2002, Giacomin and Levinson, 2015]. The variance of circuity fac-tors across a contiguous urban area and the implications of this property for intra-urban travel, especially logistics-related travel, is extensively treated by Merchin [2018]. There are multiple accepted conventions to define this factor, but all compare an idealized dis-tance between two points (e.g., rectilinear or Euclidean) with the disdis-tance of the actual path traveled over the network. The resulting ratio offers a metric of the distance of
de-tour enforced by the topology of the street network in a local area and consequently, the efficiency of local travel.
Clearly, circuity and other infrastructural characteristics are not uniform over a city. Differences in population density, road types (e.g., highway vs. boulevard, one-way vs. two-way), and road network geometry can vary considerably from one area of a city to another. Several authors, (e.g., Winkenbach et al. [2015]), address this challenge by subdi-viding the city into a large number of adjacent rectangular pixels and accounting for road network variations at this increased, but still discretized, resolution. Localizing the calcu-lation of average circuity factors into small sub-networks of streets within these discrete segments provides higher-resolution information about the infrastructure of different parts of a city and the consequences that infrastructure holds for logistics operators. This is possible and efficient thanks to modern tools such as public map databases and network analysis software, but the choice of how to sub-divide a street network affects the informa-tion contained in each segment about its travel properties. As an example, the rectangular pixel-based rasterization carries several limitations. It is placed arbitrarily over the urban area, so the boundaries between pixels are arbitrarily located and not reflective of the un-derlying practical subdivisions often defined by the physical geography of the city (e.g., waterways or motorways across which there is no vehicular or pedestrian access). Com-panies often define routing or delivery territories following natural or man-made barriers such as rivers and highways since those barriers are difficult or dangerous (e.g., to pedes-trians, motorbikes, bicycles, etc.) to cross and/or cause significant delays in crossing them. Figure 1. 1.1 illustrates one example of this -the endpoints of this trip are close together, but reaching the destination requires a detour to follow one-way streets and reach a bridge to cross the river. In this case, treating the origin and destination regions of this trip as one unit and assuming it to be served by one route is not desirable or realistic. Further, this analysis often produces results that must be manually assessed to find pixels whose charac-teristics offer little meaningful information. Often, some pixels may be entirely composed of large industrial compounds, natural parks, waterways, freeway interchanges, hillsides or mountains, and other unsettled or infrequently traveled areas. Properties measured on the road networks of pixels that comprise these areas contain very little useful information,
Womenc, Clothing Store
1.2 kmn Edu
Mer-ur am ShopH otel O ien
Ouadroa e Mokiuras
/4 Shopping'Mall
Galera Armonia ' sacento, P~awwk tg
Est
Figure 1.1.1: Detour necessitated by river and one-way streets, Sao Paulo, Brazil
out of context, about the actual transportation conditions of the area they describe and its importance to the logistics operator. Both these highly-local travel variations and the fail-ure of a uniform raster grid to captfail-ure deviations in settlement patterns are obstacles to the robustness and generalizability of the pixel-based rasterization method. To overcome these limitations, this work proposes the use of a graph-theoretic method known as community detection for urban street network segmentation. The aim of this network-based segmen-tation tool is to create territories that are directly informed by the physical geography and topology of the road transportation network.
In addition to pixelated rasterization methods, another common way of subdividing cities is by postal code. This subdivision can be of practical convenience for local delivery operators who have firsthand knowledge of the urban region, but poses some challenges analytically. Postal codes (using the U.S. terminology, ZIP codes, equivalently hereafter) are typically drawn by governmental agencies to loosely reflect the patterns of settlement
within the city. As such, it is unlikely that a postal code will bisect a neighborhood with
important integral qualities such as an intact small central business district, or will include
large swaths of uninhabited regions such as parks or lakes. Similarly, ZIP codes may
vary in size according to population density, settlement or municipality limits, or other
factors deemed relevant by those who create them. These are desirable qualities that give
realism and practical value to a segmentation method used in a network design problem. However, geospatial datasets describing which parts of a city are assigned to which ZIP codes can be difficult to obtain in all cities, particularly outside of the U.S. and western
Europe. Even when such datasets are available, the ZIP codes themselves actually comprise a range of addresses on various streets, so post-processing these street-based geometries into shapes that can be described with clear bounds and a physical measurement of area (strictly necessary for continuum approximation), is non-trivial.
This thesis first proposes a method to segment urban areas based on street networks using community identification algorithms that partition the urban street network into sub-areas when modeled as a mathematical graph. This method is employed on a number of test networks and numerically evaluated to assess its usefulness as a tool in continuum-approximation based transportation planning problems. The partitions identified by the algorithm represent urban sub-regions that exhibit high connectivity and highly efficient local travel within regions and less efficient, less connected transportation networks be-tween regions. These sub-regions are proposed as a potential alternative to pixel-based rasterizations in logistics network design models.
The remainder of this thesis is structured as follows. Chapter I develops and presents the segmentation algorithm. In Section 2, we discuss the relevant extant literature. In Section
3, we introduce a segmentation methodology, including data collection and processing,
and assess this against various segmentation methods according to their applicability to a logistics use case. These assessments are conducted first on the metropolitan area of Sdo Paulo, Brazil. We identify characteristics relevant to the method's applicability in route approximation formulae, a common tool employed by urban logistics planning, and numerically evaluate the graph-driven partitions according to these characteristics. We then present an explicit numerical comparison of graph-driven segments to rectangular pixels and ZIP codes, two other segmentation modes commonly used in urban logistics planning. In Section 4, we select a number of other case study cities spanning a range of regions, geographies, and development patterns and validate the method on these. In Chapter II, we combine the graph-driven partitions with land use and development data to explore the application of this method to identifying areas for which targeted urban freight policy interventions are anticipated to have the greatest effect.
1.2
Literature Review
1.2.1
Community Detection
A core goal of this work is to identify cohesive urban areas based on road networks.
Partic-ularly, we aim to find city segments or sub-regions that are better connected and more easily traveled within segments than between segments, as indicated by measurements of circuity factors for large samples of simulated trips. We use methods of network science and graph theory that have theoretical similarity to this problem setting -notably, community detec-tion algorithms. These methods partidetec-tion a mathematical graph into sub-regions based on various network properties. The terms "community", "partition," and "segment" are used interchangeably in this paper to describe these sub-regions, although the term "segment" will be preferred when discussing applications to street networks and their real-world im-plications, while the former two will be reserved for theoretical discussions. This section will provide a brief introduction to the extant literature on network science and commu-nity detection techniques with a particular focus on the methods tested and implemented subsequently.
Network science is an interdisciplinary mode of analysis with applications in many fields. It can be used to model such diverse phenomena as traffic patterns between fixed origins and destinations [Guimera et al., 2005], human behavior on social networks [Cen-tola, 2010], relations between firms and suppliers [Lazzarini et al., 2001], or the spread of failures among financial institutions [Battiston et al., 2012]. The core feature of these mod-els is a graph representation where some components of a system are modeled as vertices (equivalently, nodes) belonging to a set V, and the connections or interactions between these components are modeled as edges (equivalently, links) belonging to a set E. A graph
G(V,E) can be identified by its edge and node sets. Network models and their associated
measures enjoy particularly widespread use in sociology and management science, where the edges between vertices typically represent some kind of relationship. For example, two vertices linked by an edge may be two people who are "friends" on a social network or two firms that transact with one another. Note that, depending on the context, many real-world relationships are unilateral. For example, a firm may lend money to another but not owe
any debt in return, or one could follow or befriend a social media account without recipro-cation. In a network setting, this is modeled as a directed graph where the edge (i,
j)
may indicate a connection from node i to nodej
but not necessarily the reverse. This is reflected in the adjacency matrix A where each entry (Aij) reflects the connection between nodes i andj,
Aij =0, for (i, j) E E,(I
I for (i, j) c E.
Note that for an undirected graph, but not necessarily for a directed graph, A will always be symmetric. Broadly, community detection can be described as the algorithmic detection of subsets of nodes that are tightly linked together displaying a high density of edges within subsets and a relatively lower density of connections between subsets (cf. Lancichinetti and Fortunato [2009], Mucha et al. [2010]). The subsets, in a sociological setting, might repre-sent segments of a population that have frequent or close interactions with each other but far sparser interactions with people outside of their sub-group. This is precisely the exam-ple demonstrated in Blondel et al. [2008], which studies the community structure among French- and Dutch-speaking users of a Belgian mobile telephone network and finds that users dramatically segregate themselves by language, with only sparse interaction between language groups.
Louvain Multilevel Modularity Maximization
Blondel et al. [2008] also introduce, in the same paper, a community detection method
called Louvain modularity after the university in which it was developed. This technique is
also called
fast
modularity optimization in reference to the computational improvements itoffers over a similar, earlier method and the sometimes multilevel modularity maximizaiton after its recursive, multi-stage heuristic design. This method is agglomerative, in the sense that it initially assigns all nodes to solitary communities and consolidates them until a stopping criterion is met. It is further hierarchical, in the sense that similar nodes are recursively collapsed into a single node such that communities can be recovered at varying
levels of resolution. The Louvain algorithm formalizes the relative density of internal and external connections into a single partition-quality score called modularity,
E
= mAij - =] (ci, cj). (I.2)
Here, Aij represents either the value from the adjacency matrix A, or, in the case of a network where weights are assigned to edges to describe some quality or quantity of the flow traveling over them ("weighted network"), the weight of edge (i,
j).
For an unweighted network, in is the number of edges in the network,M = Aij. (1.3)
Otherwise, m is the sum of edge weights. 8(ci, cj) denotes a Kronecker delta function [Weisstein, 2019] on the community assignments ci and c1 of nodes i and
j,
respectively,8(ci, c) = 1, when ci = cj, (1.4)
0, otherwise.
Note that
Q
is a measure that can be calculated for a graph that has already been par-titioned. It can be used to describe the quality of a given partitioning, e.g. to compare assignments or methods, or it can be considered an objective function to be maximized by adjusting partition assignments. However, explicit modularity maximization is computa-tionally intractable and from a complexity standpoint has been shown to be NP-complete [Brandes et al., 2006]. For this reason, a number of approximation algorithms have been developed. The Louvain algorithm improves on existing heuristics in a number ways, lead-ing to faster computational time, better modularity scores, and more realistic community allocations.The Louvain algorithm is divided into two phases that are repeated iteratively. In the first phase, nodes are assigned as the solitary member of their own communities. Then, for each node, its neighbors are considered and the effect of moving node i into each of the communities of its neighbors
j
is calculated in terms of its marginal effect on themodu-larity score. The allocation that results in the largest gain of modumodu-larity is accepted, and the next node is considered. Blondel et al. [2008] argue that the order in which nodes are assessed in this way does not have a significant effect on the final partitioning, but can af-fect computation time. This process proceeds until a local maximum is reached -i.e., until no single-node relabeling can increase modularity. The second phase redraws the labeled network by collapsing all nodes with the same community assignment into a single node with a self-loop whose weight is equal to the sum of weights of internal connections in the lower-level, pre-collapse graph. It is then possible to apply the first phase to the consoli-dated graph (which, in the context of the collapsed graph, consolidates some neighboring communities into one another) and repeat. The authors define one "pass" of the algorithm as one complete execution of phases one (labeling and reassigning individual nodes) and two (collapsing and consolidating communities). Multiple passes are then executed until modularity
Q
cannot be improved. This approach is part of a family of heuristics for max-imizing modularity where computations are made on local regions of a network iteratively at various scales. They have been termed "smart local moving algorithms" and are the basis of many modularity-based community detection algorithms. Subsequent work has made incremental improvements to the Louvain method [Waltman and van Eck, 2013], but the basic features are the same. Applications of this popular method are widespread across and can be found in a number of various disciplines. In addition to the mobile telephone network example of Blondel et al. [2008], the Louvain algorithm has been to explore the in-terlocking nature of corporate directorates whose members often sit on boards of more than one company [Heemskerk Eelke et al., 2016]. At least two papers have used the Louvain algorithm to study the United States air transportation network, where nodes are airports linked by the flows of passengers between them. Clark et al. [2018] apply Louvain to this transportation network as one tool in modeling the network's resilience to various types of security- and weather-related failures. More generally, Gegov et al. [2013] use the Louvain algorithm to explore patterns in passenger flows across regions of the United States, spe-cific airports, and seasonal variations. In a different setting, the same algorithm is appliedby Meunier et al. [2009] to examine modular structures between parts of the brain on a
Fluid Communities
The algorithm of Pares et al. [2017] is a more recent addition to community detection methods based on a different methodology. Qualitatively, this method is interesting for the logistics use-case because it requires a specified number of partitions to execute. While this is less insightful from an unsupervised graph clustering perspective, it offers the practical benefit of being able to control the number of segments, for example, created in an urban area. The fluid communities algorithm (hereafter, "Fluid") is based on the propagation methodology. This is based on the idea of introducing a number of fluids (alternatively, a number of labels or beliefs which may similarly propagate) to a network environment where they will expand and push against each other subject to the topology of the network, which provides them channels for flow. Formally, this is represented as a number k of communities, 0 < k < IV 1, each initialized at a different and random vertex on the network. The spread of a fluid which comprises a community c is governed by the fluid's density, measured as the inverse of the number of vertices holding that label,
d(c) = (1.5)
|V G C|
In each iteration, the algorithm updates the community of each vertex in random order according to an update rule. Letting C denote the set of community labels and J denote the set of neighbors of a node i, the updated community label c for a node i will be,
c = argmax
Y
d(c) -6(c(j), c), (1.6)CEC jCj/i
where 5 is again the Kronecker delta as in Section 1.2.1. For a node i, assume that it is assigned community c. Then, summing across all neighbors
j,
only ifj
is in communityc, add the density of the community c as given by Equation (1.5); otherwise, add nothing. If multiple arguments c maximize this function, the algorithm chooses one among them at
random. This update rule is shown in Equation (1.7),
/upd x~U(c), ifci C,
Ci =p (I.7)
ciI if ci E- c '.
Once this updating step is executed for all nodes and a new community assignment has been calculated, the communities are collapsed into a single node as in Louvain. Note, also, that summing over the set of neighbors ensures that all nodes in the community will form a connected graph component. After updating community labels, the density of the community is re-initialized to I per Equation (1.5), and the process repeats until community allocations are stable.
Note that if ci, the community previously assigned to node i, is not in the set of commu-nity labels recommended at the next round, it is not assigned. This decreases the number of nodes assigned to the community, which increases the density. Each time nodes are removed from a community, it becomes more likely that that community will be chosen in the next round as a result of its higher density. This helps to ensure that the number of communities specified at the start of the routine appears in the final labeled graph, with at least some nodes allocated to that label. Examples of the Fluid algorithm are relatively rare in applied literature, which may in part be due to its recency. However, theoretical liter-ature focusing on the network and algorithmic aspects of community detection problems commonly includes this method in comparative and benchmarking studies such as those described in Section 1.2.1.
Comparative Studies
Outside of the development and design of algorithms that facilitate these analyses, a
sig-nificant part of community detection literature focuses on benchmarking and assessing al-gorithms' performance on various types of graphs. While the suitability of a particular algorithm depends on the graph and the desired outcome, and quality likewise must be de-fined in context, a few notable comparative studies of algorithm performance are presented here. A few common dimensions for assessing algorithms are computation time,
quali-tative aspects of community size and distribution of community size, and benchmarking tests where algorithms are executed on a stylized graph seeded with known community structures and scored based on their normalized mutual information (NMI) measure com-pared to the a priori partition labels. NMI is a normalization of the Mutual Information (MI) score, which is borrowed from information theory and was first validated for use in community detection by Danon et al. [2005]. This score is based on a confusion matrix between the assigned community labels of nodes and the ground-truth community labels assigned manually or from context. It can be calculated from the confusion matrix Nij,
-2 i E Nijlog( )
NMI = (I.8)i~
E Nilog(Li) + EBINjlog(j)'
where the number of real communities is cA, the total number of nodes is N, the number of assigned communities is cB, the sum over row i of N1 is Ni and the sum over column j of
Nij is Nj. By this formulation from Danon et al. [2005], the NMI can then take a maximum
value of I if the assigned communities match the real communities perfectly, and zero if there is no overlap between the assigned and actual labels.
Another useful technical term in these studies is the mixing parameter, or the average fraction of edges a vertex will have connecting it to other communities [Lancichinetti and Fortunato, 2009]. In other words, a node will have a fraction I - P of its links connecting
it to other nodes in its own community and the remaining fraction P connecting it to nodes outside its own community, where the fraction p is called the mixing parameter. From practical reflection, real networks and especially spatial street networks are likely to have a considerable amount of "mixing" as boundaries between communities are not defined
by strictly segregated groups of nodes and many connections are likely to cross partition
boundaries since nearby nodes are generally well-connected to each other. A network where groups are more clearly segregated, such as where speakers sort themselves into language groups, might not have a high mixing parameter. Additionally, as evident in the comparative studies presented below, a number of alternative partitioning methods exist in addition to the two described in Sections 1.2.1 and 1.2.1.
Some comparative analyses, which seek to rigorously assess the performance of parti-tioning methods in a number of distinct graph settings by well-defined performance criteria, are presented here. These comparative studies measure the Louvain and Fluid detection al-gorithms against several others, including some developed more recently. These studies find that, in a variety of settings assessed by a variety of measurement criteria, the two algorithms presented in Sections 1.2.1 and 1.2.1 perform well even against more recent advancements in the field.
Four comparative studies of community detection algorithms are presented in chrono-logical order. All use similar methodologies in similar network settings. Lancichinetti and Fortunato [2009], building on their earlier work [Lancichinetti et al., 2008] which intro-duces one of most popular community detection benchmarking analyses, present a parative analysis of algorithms on a large synthetic graph with heterogeneously-sized com-munities designed to mimic real-world systems. Especially suited to weighted and directed graphs, Louvain is outperformed only by a more recent algorithm called InfoMap [Rosvall et al., 2009] and is especially effective on "large" networks, defined here as networks with a few thousand nodes.
Orman et al. [2011] present a similar analysis on one of the benchmark graphs previ-ously introduced by Lancichinetti and Fortunato [2009], but also challenge the supremacy of this quantitative methodology by including some qualitative aspects of network parti-tions as assessment criteria. In particular, they consider the number of communities and the distribution of their sizes as factors that would influence the usefulness and interpretabil-ity of communinterpretabil-ity labels in real-world network settings. They find that while InfoMap again has outstanding performance on the quantitative benchmark, it tends to detect more, smaller communities than Louvain. (When tested on a sample urban street network, this holds particularly true.) While modifications of this hierarchical algorithm may be made to create or recover communities at different sizes on an urban street network, this proves to be challenging. Further, the theoretical basis of the InfoMap algorithm (based on encodings of node labels from an information-theoretic basis, employing the metric of informational entropy) has little sense in the context of an urban street network.
and repeat the analysis on large numbers of realizations of large synthetic networks. In this study, Louvain was found to perform comparably to the labelings predicted by InfoMap and other more recent algorithms (in terms of NMI), especially for larger graphs. The Fluid algorithm, relatively more recent in its introduction (2017), does not appear in any of these analyses. However, in addition to introducing the Fluid algorithm, Pares et al. [2017] present benchmark tests comparing their own contribution to several existing algorithms, including Louvain and InfoMap. They find Fluid to be competitive with preexisting algo-rithms on large graphs with large mixing parameters. In all studies, Louvain is noted for its computational speed and scalability to large networks, which is comparable (if slightly less) than Fluid in this study. Fluid is also, notably, a strong choice in networks with large mixing parameters.
Table 1.2.1 summarizes the relevant features of some algorithms and their relative strengths and deficiencies. As the top performer in many quantitative assessments, InfoMap is in-cluded. It records whether each algorithm allows a specified number of partitions, identifies communities at multiple levels of resolution ("Hierarchical"), can consider edge weights, can consider directed edges, has a bias toward small communities or large communities, performs as well on large networks as small, performs well on networks with large mix-ing parameters ("Mixmix-ing Tolerated"), and relatively faster than the others. Computational speed is another factor commonly used to asses these algorithms. Empirically, for this anal-ysis, all three algorithms were found to be of reasonable and comparable computational speed on test road networks of 50,000 - 100,000 nodes and so this criterion is omitted from
the table.
1.2.2
Route Length Approximation and Road Network Circuity
Section 1.3 of this thesis explores the application of community detection-based segmenta-tion methods to urban logistics applicasegmenta-tions. Specifically, applicasegmenta-tion to the design of last mile distribution networks is investigated. These network design problems are often formu-lated as large-scale optimization models in which cities are segmented into service areas. Each service area can then be described according to its characteristic demand for logistics
U S E
00
Flu Ye o N Z N EN e e
Lnovan No Yes Yes Yes Yes Yes Yes Yes
Table I.2.1: Summary of algorithm characteristics and relative strengths and weaknesses
services, area, and road network properties. This enables the integration of Continuum Ap-proximation (CA) methods which are used to estimate the expected, near-optimal distance of deliveiy tours based on aggregate service-level characteristics at the service area or "city segment" level of aggregation. In these large-scale problems which aim to support long-term strategic decisions including facility location and fleet composition, day-to-day rout-ing decisions are less consequential. For this reason, CA methods are often used to make approximations at this level of planning. Aggregate service area models and related rout-ing cost estimation formulae allow sufficiently precise estimation of routrout-ing decisions while
leading to substantial reductions in computational time
[Nagy
and Salhi, 2007], which isparticularly relevant given the scale of most last-mile logistics problems. Smilowitz and Daganzo [2007] first demonstrate the application of CA methods to network design prob-lems. To account for heterogeneity in demand density across an urban area, Winkenbach et al. [2015] impose a grid of rectangular pixels dividing a city into discrete service areas.
One key measurement of urban road networks that is commonly used to characterize these service areas is a circuity factor. Circuity measures the relative detour incurred by traveling over a road network compared to the Euclidean distance between the origin and
dN and the Euclidean distance dL
2,
dN(p, q)
d(p,
q)'for any pair of path origin and destination locations (p, q). From this definition, it becomes clear that higher circuity factors indicate higher levels of network inefficiency [Barthelemy, 2011]. In route approximation settings, circuity factors are used as a multi-plier to approximate actual road network travel distances. Early work on circuity factors in urban areas assumes travel over a rectilinear grid and finds a theoretical circuity factor of c = 1.273 [Larson and Odoni, 1981]. During the same period, empirical studies find values
for the circuity factor between 1.16 and 1.28 for selected urban areas and approximately
1.35 for rural areas in the USA [Love and Morris, 1979]. A more recent empirical study by
Giacomin and Levinson [2015] estimates a circuity factor of 1.34 for the fifty most popu-lous US cities. However, these studies focus on trips of up to 60 km within the urban area. This might be misleading for last-mile delivery because last-mile trips typically constitute inter-stop distances of less than a kilometer and Levinson [2012] concludes that circuity increases with a decrease in trip distance. Most recently, Merchin and Winkenbach [2018] find that the empirically derived mean circuity factor for Sdo Paolo is about twice as high
as earlier estimates for trips of less than one kilometer in distance, c = 2.51. This analysis
is based on the one km2 pixelation logic introduced before.
1.2.3
Urban Network Science
Transportation networks, and particularly urban streets, are a popular topic of study in applied network science. Dating back nearly three centuries, one of the earliest seminal
problems of network science - Euler's classic seven-bridge problem at K6nigsberg
-considered travel over urban roads [Barabasi and P6sfai, 2016]. More recently, the avail-ability of online map data describing road network geometries worldwide has fostered a number of empirical studies (e.g., Boeing [2018], Chan et al. [2011], Porta et al. [2004]) that apply network analyses as a means of describing and categorizing urban forms strictly in terms of topology and geometry. Other authors borrow methods of network science to
examine urban phenomena including city development patterns and transport flows. Road network comparison studies are mainly focused on inter-city topology differences. How-ever, some literature exists that focuses on intra-city road network characteristics.
Applications of community detection methods to road networks are more limited and, in extant literature, not considered in relation to logistics planning. Jiang and Claramunt [2004a] use graph measures to identify areas and links that are of key importance for pas-senger transportation flow. Zhong et al. [2014] similarly investigate travel behavior and even study the community structure discussed elsewhere in this work, but use a network abstracted from transit card origin-destination patterns and not a spatial road network. Both Levinson [2012] and Chan et al. [2011] correlate network properties with land city size, city development patterns, and intra-urban travel behavior in several cities but do not address community structure in street networks. At the level of an intra-city investigation, Duan and Lu [2013] study the robustness of city road networks based on community structure derived from the road network. Although they detect communities in six major cities to support their analysis of robustness, the communities by themselves are of limited practical value to urban logistics decision-makers. Gudmundsson and Mohajeri [2013] analyze the geometric differences between older and more recent parts of the street networks for 41 cities in the United Kingdom. However, they manually subdivide the city into different segments, while we rely on community detection for segmentation.
Barthelemy [2011] argues that urban road networks are well approximated as two-dimensional planar spatial networks, making a wide range of network-scientific tools rel-evant for the application. One notable constraint of graph representations of urban street networks is the presence of directed or undirected edges (i.e., one-way streets). This is a complication in terms of implied consequences for real-world vehicular flows on the network as well as the graph-based analytical methods that may be employed. A natu-ral representation of urban roads as networks is the "primal" representation, where streets represent links and intersections, nodes. The alternative to this representation, the "dual" graph, is the reverse of this node-edge correspondence: streets are nodes, and two nodes are connected if the corresponding streets intersect. Various network measures can then be re-interpreted in the context of the dual graph. Node degree, for example, in a primal graph
represents the number of streets joined at one intersection, but in a dual graph represents the number of streets that intersect a given road. Both primal and dual graph representa-tions are frequently employed in the study of urban street networks. In this work, we too examine both.
A relevant literature stream surrounding the study of dual street graphs is known as space syntax theory. Space syntax constitutes not only a notable use of dual street graphs
in network-scientific methods but also a major intersection of network science and urban design. Drawn from Hillier and Hanson [1984], space syntax analyzes urban areas and their street networks in terms of axial lines, continuous streets, and lines-of-sight as perceived
by human inhabitants. It uses measurements of connectivity to interpret human
interac-tions with urban spaces and correlates measures of connectivity and accessibility (easily conceived and measured in network representations) with urban phenomena such as traffic flows, human navigation, safety, and livability. It has been criticized for its subjectivity with respect to the methods used to account for continuity of space and spatial experi-ence, the basis of graph construction in space syntax, and for the use of dual graphs which discard meaningful metric information and street geometries [Ratti, 2004]. Methods for constructing these generalized dual graphs while selectively retaining relevant information are a popular topic in the field [Porta et al., 2006, Jiang and Claramunt, 2004b]. However, as this study focuses solely on network topology and wishes to later draw correlations be-tween network properties and network phenomena, all dual graphs used here are derived only from the adjacency matrices of the readily available primal graphs.
1.3
Urban Segmentation Model Implications for Urban
Lo-gistics
The two community detection algorithms surveyed in Section 1.2.1, Louvain and Fluid, are implemented on a test network centered on the metropolitan area of Sao Paulo, Brazil. Louvain is chosen for its favorable performance in a number of benchmarking assessments detailed in Section 1.2.1 and the close analogy of modularity to in-group travel efficiency
relevant for logistics use cases. Fluid is chosen for the convenience of a pre-specified num-ber of partitions, quick computation time, and the sensible interpretability of flow propaga-tion in the context of a road network.
A set of experiments is designed to assess each algorithm's relevance to forming
dis-tricts for a logistics planning problem in which route approximation formulae will be ap-plied. Recall that three important criteria for this application are (1) low value of road network circuity within partitions relative to between partitions, (2) low variance of road network circuity within partitions, and (3) relatively convex territory shapes. Numerical ex-periments are designed and presented to consider all three of these criteria, and the results of both algorithms are compared. In addition, two possible transformations of the urban road network graph, the primal and dual network representations, are explored.
The Python package OSMnx [Boeing, 2017] is used to query road network data from Open Street Maps (OSM). This package integrates network information with contextual street data from OSM such as road classification, number of lanes, link length, and one-way/restricted access streets. Similarly, the Python package Networkx [Hagberg et al.,
2008] version 2.0 is used for subsequent analyses on these street networks in Python. Other
non-original code, notably the Python implementation of the Louvain algorithm, is taken from an online repository maintained by one of the original academic authors
1.3.1
Primal and Dual Representations of Street Networks
Section 1.2.3 introduces the terminology of primal and dual graphs and their relevance to urban street network analysis. Recall that in the primal graph representation, streets are edges and intersections are nodes with the graph preserving regular network geometry. In the dual graph representation, streets are nodes and two nodes (streets) are only connected
by an edge if they intersect. The dual graph preserves the connectivity properties of the
primal, geographic street graph but is less intuitive to visualize and conceptualize. The ap-plication to logistics distribution motivates the need to label streets, not intersections, with community membership. In a network design or route-districting model, these partitions are used as a unit of aggregation for customer demand, which occurs at customer locations
along city streets. Thus, each point of customer demand should be labeled with a commu-nity identifier so that all demand occurring within a partition can be described by aggregate community-level properties. However, the major disadvantage of using the dual graph as input is the confusion of relevant properties with which to assign edge weights. Many community detection algorithms, especially those using modularity maximization, can be parameterized with unequally weighted edges, typically describing some network quantity such as traffic or flow. In the case of a street network, travel time, vehicular capacity, or traffic might all be useful quantities to consider. However, these are clearly all linked to street (primal edge, dual node) properties and the selection of a method to assign a relevant weight to street intersections (dual edges, primal nodes) is far less intuitive.
k I1
.A.
'
(a) Output with primal graph as input
(b) Output with dual graph as inputFigure 1.3.1: Executing a community detection algorithm on a primal street graph labels nodes, which must then be translated to edge labels, while executing on a dual street graph
labels edges directly.
Because community detection algorithms are formulated to label nodes with commu-nity membership according to the presence or absence of connecting edges, when executed on a primal network representation they produce a graph with labeled nodes such as that shown in Figure 1.3. la. Inverting the graph to its dual representation and executing the community detection algorithm on the dual input produces a graph with labeled edges such as the one shown in 1.3. 1b. While creating the dual representation of an urban street net-work necessitates discarding edge direction information and is harder to visualize, it does
not require a method for translating labels from nodes to edges. However, for some pur-poses (such as detecting communities on a graph with weighted edges) the use of a primal graph may be preferred. A simple method is adopted to translate node labels to edge la-bels. Given that each edge has exactly two endpoints in the graph, if both endpoints are labeled with the same segment index, the edge adopts that segment index. If the endpoints are differently labeled, a random choice between the two endpoint indices is made. Exten-sions to this simple heuristic are certainly possible -for example, the neighboring nodes of each endpoint could be considered and the majority label among these votes for the label applied to the edge. However, this more informed method provides little marginal gain in the numerical assessments presented below, and in the interest of saving computation time on large networks, the simpler approach is employed here.
1.3.2
Comparative Study of Partitioning Algorithms on Street
Net-works
Descriptive Segment Properties
For each of the candidate algorithms, the method is applied to a test network consisting of a rectangular 100 km2 sample of the urban core of Sao Paulo, Brazil centered at 23.563346 S,
46.654165 W, which is the area highlighted in Figure 1.3.2. From this network, local roads
and streets are extracted by filtering the graph according to OSM's road classifications.
OSMnx assigns to all road segments various metadata such as infrastructure types (e.g., cycle path, power line, or vehicular highway), length, number of lanes and roadway clas-sification. However, these metadata are not entirely consistent between cities. Entries are frequently absent, particularly in network queries outside of the U.S. and western Europe, and some descriptive classifications (e.g., "motorway" vs. "trunk" roadway) are only quali-tatively defined and may be altered by users (Open Street Maps is an open-source platform), so their assignments may not be consistent across different networks.
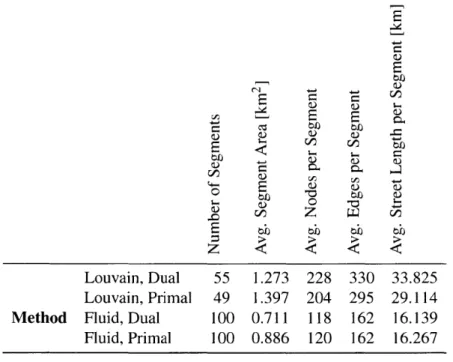
Roadway classifications provided by OSM range from motorways to local streets. The largest-volume roadways are categorized as a motorway, motorway link (e.g., access ramp), trunk, and trunk link. Links with classification below trunk link are used and higher (larger-volume) road classifications are discarded. The rationale for this is that last-mile deliveries will mostly be conducted using local streets, whereas large-volume road types will be used for line-haul transportation (a separate problem from last-mile distribution). However, due to the potentially imprecise nature of this metadata, it should be used with caution in non-urban or remote regions where data collection efforts may be sparse. Any small discon-nected subgraphs, which occasionally occur with or without this filtering step due to local inconsistencies in street network data and geometry, are discarded and only the largest con-nected component is considered for testing. In the more complex multi-stage algorithm presented in 1.3.4 and subsequently, exceptions are designed to ensure that all viable sub-networks of a query area, not just the largest connected component, are processed. The re-sulting test network, in this case, has 10,962 nodes and 23,035 edges. For each community detection algorithm, a brief general summary of relevant output characteristics is described in Table 1.3.1. For the Fluid community detection algorithm, the number of partitions is specified a priori and is selected to target an average segment area of 1 km2. Because the partitions are irregularly shaped, the area of each is approximated by the a-shape method [Edelsbrunner et al., 1983], which is further explained in Section 1.3.2.
Note in Table 1.3.1 that the main advantage of the supervised Fluid method is the ability to fix the number of communities assigned. For this method, the average area of segments produced was slightly lower than the intended 1 km2. It is also observed that implementing the same algorithm with the same parameters on the primal vs. dual representations of
the same graph can produce significantly different results in terms of the number, size, and roadway length of communities identified. While from a practical perspective all the values in this example are within reasonable ranges, this indicates that choosing a primal vs. dual graph representation as input to the algorithm could have meaningful consequences and should be further considered (as in Section 1.3.2, for example).
S 4-1 U 1Z E b bbJ tb t Louvain, Dual 55 1.273 228 330 33.825 Louvain, Primal 49 1.397 204 295 29.114
Method Fluid, Dual 100 0.711 118 162 16.139
Fluid, Primal 100 0.886 120 162 16.267
Table 1.3.1: Summary of community detection algorithm results on 100 km2 sample net-work.
Road Network Circuity
Road network circuity, as defined in Section 1.2.2, is used to assess both the efficacy of community detection methods in identifying areas of highly efficient local travel and to compare the performance of candidate algorithms. Once a method (algorithm) and imple-mentation (primal vs. dual) is chosen, we compare the mean and variance of simulated circuity factors on a community-partitioned network to networks partitioned with pixels and ZIP codes in Section 1.3.4. To assess the efficacy of the candidate algorithms and graph transformations in identifying local regions of low circuity, we compare the aver-age circuity factor for trips within partitions (internal trips) to the averaver-age circuity factor
Hn Hn r_ vJ H U 0 0 0 0 Louvain, Dual 1.724 2.283 24.5 0.443 0.627 41.5 p < 0.01
Method Louvain, Primal 1.763 2.314 31.3 0.502 0.618 23.1 p < 0.01
Fluid, Dual 1.829 2.044 11.7 0.535 0.584 9.2 p < 0.01
Fluid, Primal 1.818 2.069 13.8 0.481 0.608 26.4 p < 0.01
Table 1.3.2: Summary of circuity results on 100 km2 sample network
for trips that cross partition boundaries (external trips). Node-to-node trips are simulated with Euclidean origin-destination distances in a specified range, 500 to 600 meters, chosen to approximate a realistic inter-stop distance that might be encountered during last-mile delivery operations. The Networkx shortest-path function is used to calculate the length of each node-to-node trip in meters on the directed graph that models the street network. This function can only calculate trip distances between nodes, hence the choice of only node locations as trip endpoints. Table 1.3.2 presents mean values for node-to-node trips between 500 and 600 meters in Euclidean distance. 50 internal trips are simulated within each segment and an equal number of external trips, with no constraints on the origin or destination segments other than that they must be different, is also created. Coefficients of variation (CV) are shown for each subset to indicate the mean-normalized standard devi-ation within each class. A Welch's t-test (not enforcing the assumption of equal variance between populations, but assuming a normally distributed population) is used to assess the similarity of circuity factors between the internal and external groups, and p-values are re-ported in the table. For each test, p-values indicate the rejection of the null hypothesis that the internal and external trip circuity factors have equal means to high levels of confidence. Recall that internal trips are conducted entirely within a partition while external trips cross partition boundaries, and all trips are within the same distance range. As Table 1.3.2 and Figure 1.3.3 show, for all community detection methods, there are meaningful differences in the properties of local travel within segments compared to between segments. These