Publisher’s version / Version de l'éditeur:
Technical Note (National Research Council of Canada. Division of Building Research), 1970-10-01
READ THESE TERMS AND CONDITIONS CAREFULLY BEFORE USING THIS WEBSITE.
https://nrc-publications.canada.ca/eng/copyright
Vous avez des questions? Nous pouvons vous aider. Pour communiquer directement avec un auteur, consultez la
première page de la revue dans laquelle son article a été publié afin de trouver ses coordonnées. Si vous n’arrivez pas à les repérer, communiquez avec nous à [email protected].
Questions? Contact the NRC Publications Archive team at
[email protected]. If you wish to email the authors directly, please see the first page of the publication for their contact information.
NRC Publications Archive
Archives des publications du CNRC
For the publisher’s version, please access the DOI link below./ Pour consulter la version de l’éditeur, utilisez le lien DOI ci-dessous.
https://doi.org/10.4224/20338408
Access and use of this website and the material on it are subject to the Terms and Conditions set forth at
Vibration levels caused by an underpinning operation
Ward, H. S.
https://publications-cnrc.canada.ca/fra/droits
L’accès à ce site Web et l’utilisation de son contenu sont assujettis aux conditions présentées dans le site LISEZ CES CONDITIONS ATTENTIVEMENT AVANT D’UTILISER CE SITE WEB.
NRC Publications Record / Notice d'Archives des publications de CNRC:
https://nrc-publications.canada.ca/eng/view/object/?id=38fe266e-d835-4309-a8fd-c7dbb55c26f3 https://publications-cnrc.canada.ca/fra/voir/objet/?id=38fe266e-d835-4309-a8fd-c7dbb55c26f3
DIVISION OF BUILDING RESEARCH
NATIONAL RESEARCH COUNCIL OF CANADA
'JrIE
C
1HlN ][ CAlL
NOTlE
セ
セャ
PREPARED BY H. S. Ward CHECKED BY T. D. N. APPROVED IX A.G.W.
October 1970
PREPARED FOR Record
Purposes-SUBJECT VIBRATION LEVELS CAUSED )3Y AN UNDERPINNING
OPERATION.
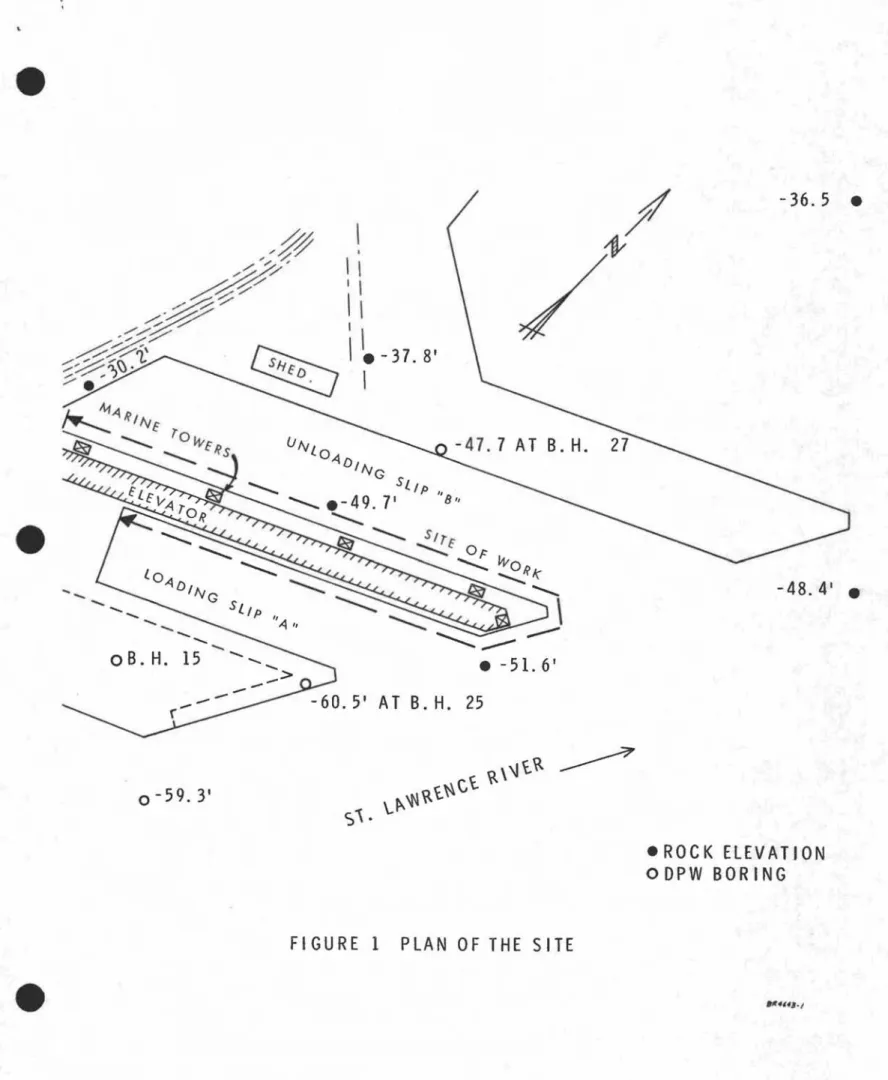
The National Harbours Board was faced with a rather unusual problem concerned with their grain elevator at Prescott, Ontario. The timber piles supporting the loading and unloading slips of the elevator had deteriorated so much that a decision had been made to replace them with steel piles. The procedure selected to do this job was to drill holes through the reinforced concrete slips, then drive steel tubes through these holes until they reached rock about SO ft down. The tubes were then to be grouted into the slips, and the tubes would also be filled with con-crete. The problem was to determine if the pile-driving operation within
12 ft of the elevator might cause structural damage to the building.
It was agreed with the contractors, W. D. Laflamme, and the National Harbours Board, that the Building Physics Section of N. R. C. should monitor the vibration levels in the elevator due to the driving of the first series of piles. This information was to be the basis of de-ciding if the operation could continue, and would also provide a calibra-tion of a Sprengnether Seismograph belonging to the Nacalibra-tional Harbours Board which could thereafter be used to monitor the vibration levels. The vibration recordings were taken on Wednesday, 20 May 1970, be-tween 11: 00 am and 4: 30 pm. The measurements were recorded on a two-channel galvanometer recorder from M. B. velocity transducers.
2
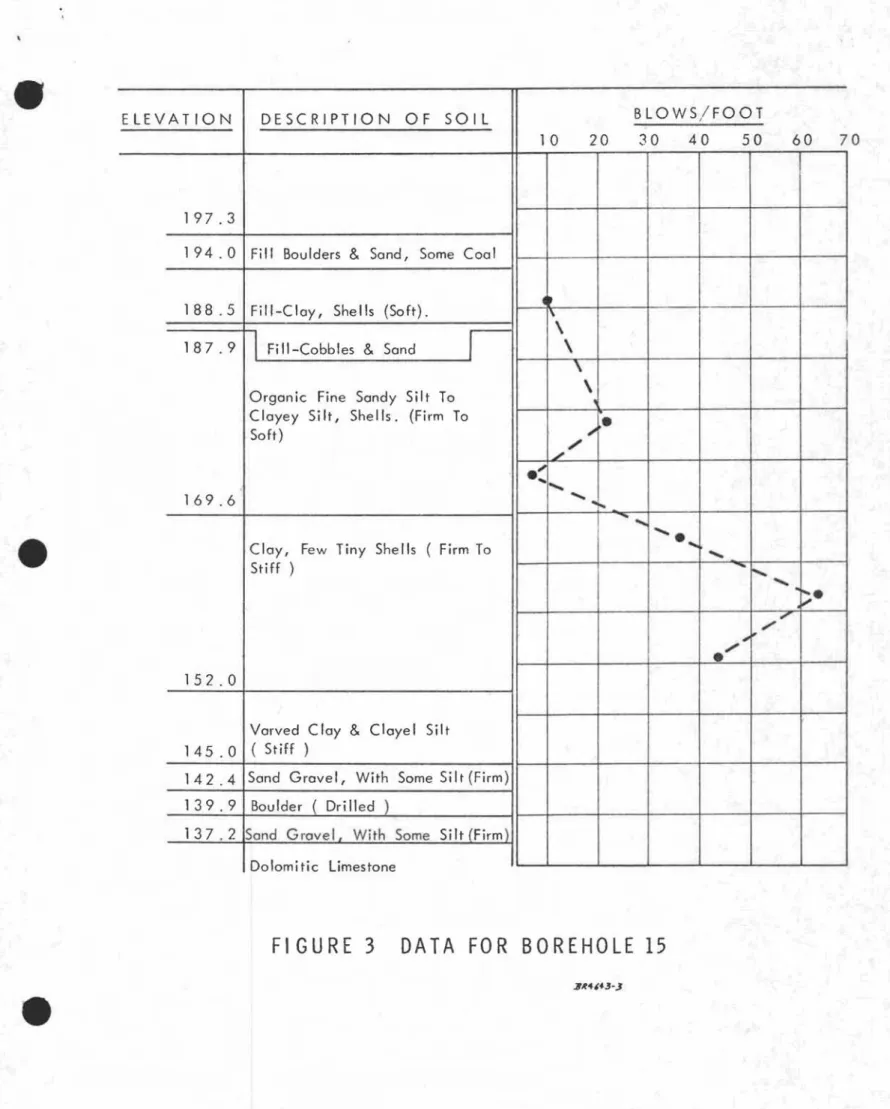
-A plan and cross-section of the site are shown in Figures 1 and 2. The cross-section shows that the elevator is supported on a large number of piles, and these go through to rock. Three boreholes had been put down by D.P. W. in 1965 at the places shown in Figure 1, and two of the profiles are shown in Figures 3 and 4 together with standard penetration data.
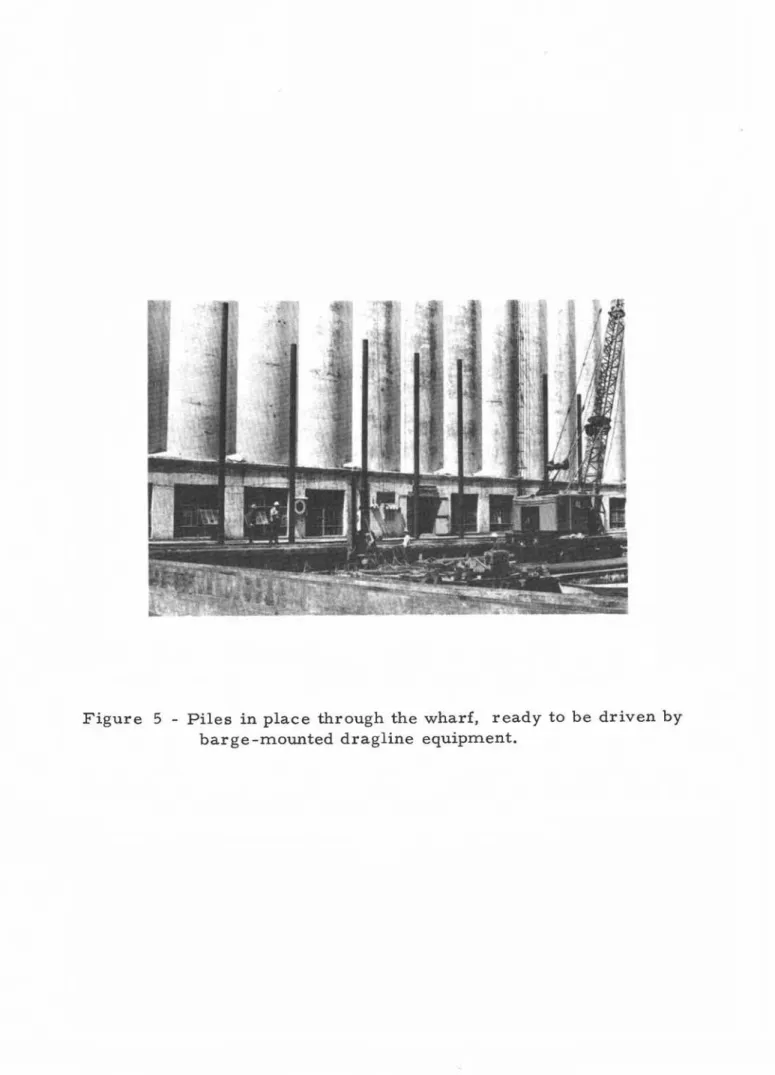
The piling operation began on loading slip A; the piles were 6 in. in di-ameter, weighed 2400 lb and had a closed end with a cutting edge. The piles were driven by a double-acting diesel hammer rated at 22, 500 ft lb which was supported by a dragline excavator on a barge (Figure 5). The locations where vibration measurements were taken are shown in Figure 2.
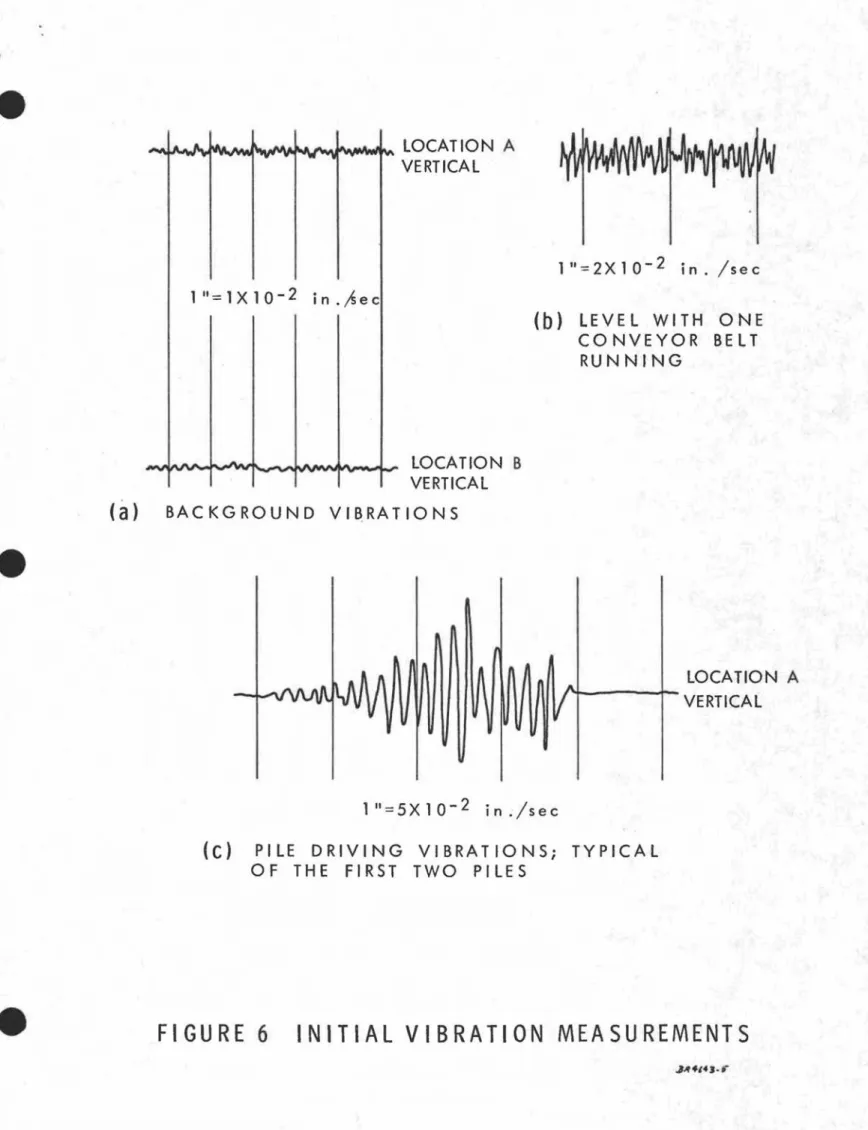
Before the pile-driving operation began, records were taken of the background level of vibrations with and without elevator equipment running. A brief sample of the vibration record when no equipment was running is shown in Figure 6a. The ambient level on the floor slab of the elevator in both the vertical and horizontal direction was 1 x 10⁻³ in. /sec peak-to-peak
at a frequency of 90 Hz. The conveyor belt nearest location B was started; a sample of the record is given in Figure 6b; the velocity level on the slab increased to 1.2 X 10⁻² in. / sec peak-to-peak in both the horizontal and
vertical direction. There were two frequency components, one around 80 Hz and the other at 700 Hz. The first two piles were then driven and the vertical and horizontal vibrations at location A were monitored; Figure 6c is a sample record of the vertical vibrations. The peak-to-peak
vibration amplitude remained constant for the total driving length and was approximately 6 x 10⁻² in. /sec. (Note: In all the vibration records the
horizontal distance between the vertical timing lines represents O. 1 second; and increase in time runs from right to left of the page. )
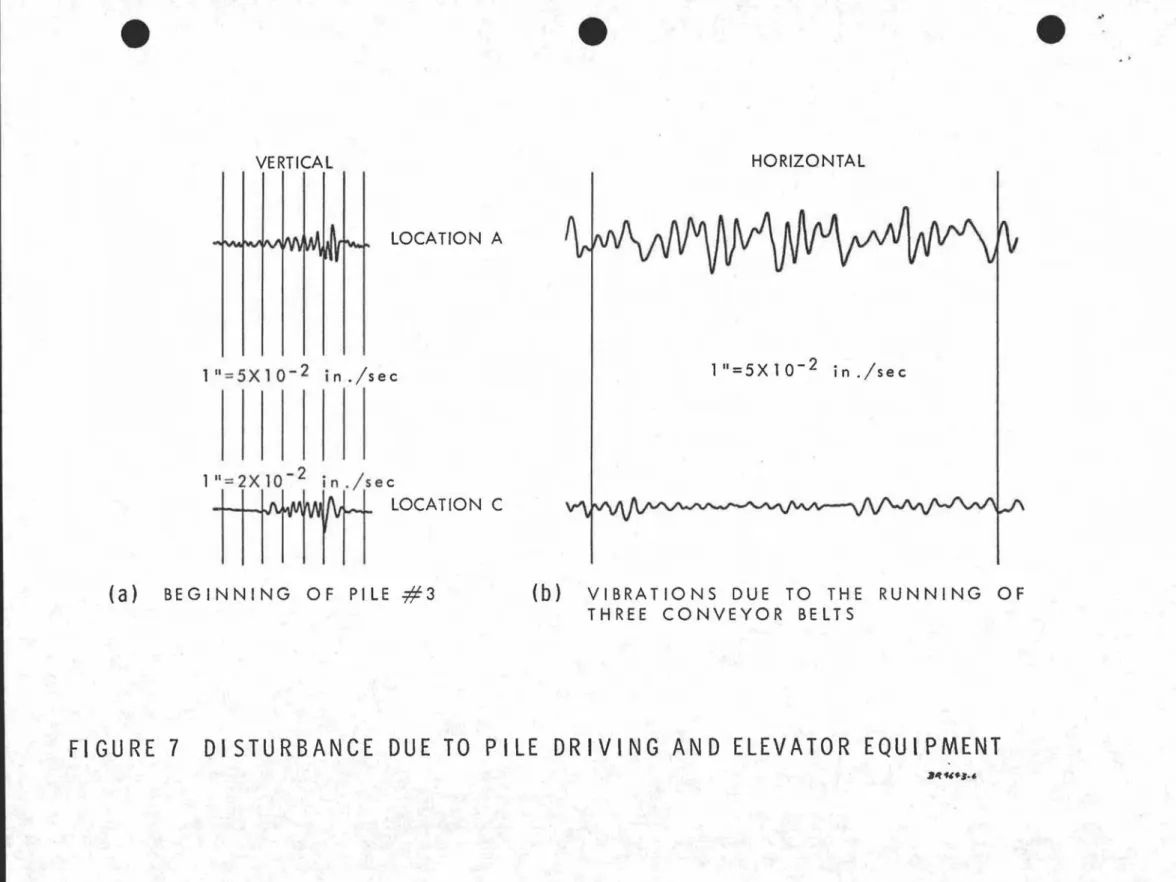
It was affirmed that these vibration levels were safe, and so the operation continued. Vibration levels were measured at the beginning and end of driving the third pile. Figure 7a is a typical record obtained at the start of the driving. There was no significant change in either the levels or frequencies from beginning to end. At this time three of the conveyor belts were running and the floor slab vibrations in the horizontal direction are given in Figure 7b. The highest level was 3 x 10⁻² in. /sec
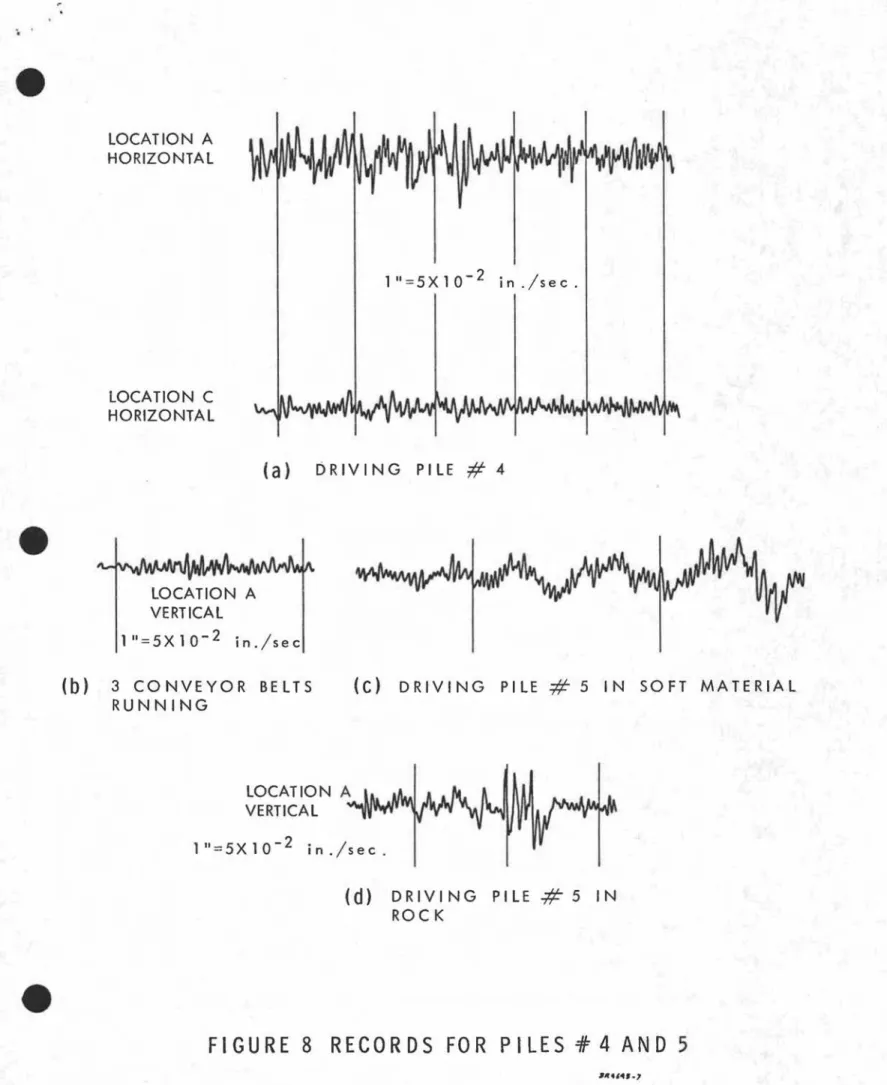
at location A and the frequency of vibrations was at 250 Hz. Horizontal vibrations were then measured during the driving of the fourth pile and when the conveyor belts were running. As can be seen from Figure 8a the pile-driving vibrations can hardly be seen above the vibrations caused by the conveyors.
Vertical vibrations due to the conveyor belts were smaller than those in the horizontal direction as can be seen from Figure 8b. The vertical vibrations at the beginning and end of the driving of the fifth pile are shown in Figures 8c and 8d. In this instance although the
3
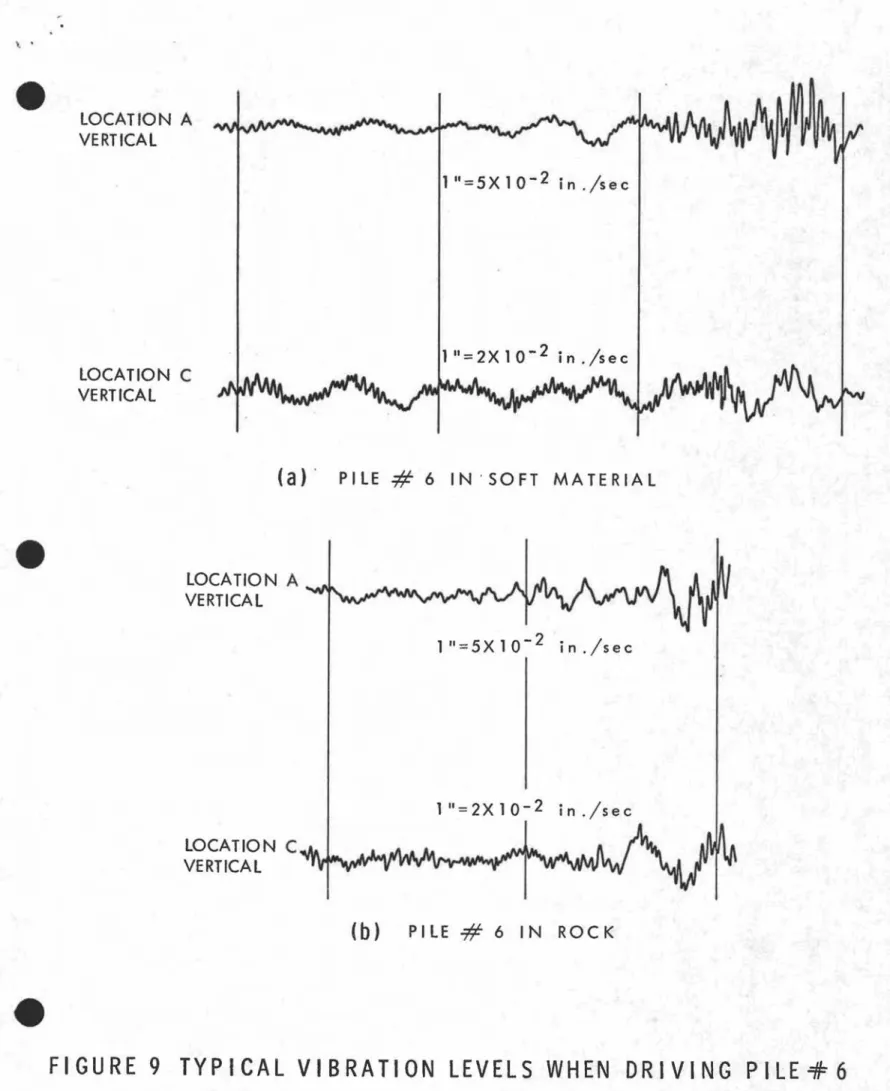
-peak-to-peak level remained the same, the frequency content of the vi-brations seemed to move to higher values when the pile was being driven in the rock. An expanded picture of the floor slab excitation at the start and end of the driving of the sixth pile, however, shows the pattern of vibrations to be rather similar (Figures 9aand 9b).
A precis of the information presented above is given in Table I. It can be seen that the pile-driving operation did not produce horizontal
vibration levels much above that generated by equipment in the elevator; in the vertical direction the pile driving produced levels about three times greater than equipment generated vibrations. Even so the levels of 3 x 10⁻² in. /sec must be considered quite tolerable. The effect of distance in attenuating the pile driving vibrations can also be ascertained from Table 1.
A sample of the record obtained from the Sprengnether equipment is displayed in Figure lO. This shows that the safe level of vibrations re-corded by the MB transducers corresponds to a peak-to-peak displacement on the trace of 3/16 in. This correlation can therefore be used to enable a monitoring operation of the pile -driving contract with the Sprengnether equipment.
e
e
TABLE I
PEAK-TO-PEAK VELOCITY LEVELS RECORDED DURING
THE PILE-DRIVING OPERATION AT THE GRAIN ELEVATOR PRESCOTT
e
Location on Elevator Vertical Velocity in. / sec Horizontal Velocity
Source of Vibration Floor (distance, it peak-to-peak in. /sec
from piles) peak-to-peak
Ambient Level: no machinery 15 1 x 10- 3
1 x 10⁻³
or pile driving 15 ./
Conveyor belt running 15 1.2 x 10- 2
15 1.2 x 10- 2
Driving piles Nos. 1 and 2 15 6 x 10- 2
15 4.5 x 10- 2
Driving pile No.3 15 3 x 10- 2
at the beginning 20 8 x 10- 3
Driving pile No. 3 15 3 x 10- 2
in rock at the end 20 1 x 10- 2
3 Conveyor belts 15 3 x 10- 2
running 35 1.5xl0- 2
Driving pile No.4 with 15 4.5xl0- 2
3 conveyor belts running 35 1.5 x 10⁻²
3 Conveyor belts 15 1.2 x 10- 2
running 35 8 x 10⁻⁵
Dr iving pile No. 5 15 3 xloMセ
at the beginning 35 1 x 10⁻²
Driving pile No. 5 15 3.5xl0- 2
in rock at the end 35 1.2 x 10- 2
Driving pile No. 6 15 3.5xl0- 2
at the beginning 35 1 x 10⁻²
Driving pile No. 6 15 3.5 x 10- 2
in rock at the end 35 1.6xl0-2
-36.5
•
-48 4
1 ••
-47.7 AT B. H.
27
I I 8',I
,I I
I \\ I
II
\ .-37.8'
I
0-59 .3'
lO -4 D I ... Ate ... sl ... Ip " ... _ -4',oB.H. IS ...
...
...
->e
HAMMER RATED AT 22,500 FT LBe
e
HERE PILE DRIVINGJ
---rr----
MMMfM]MMGZ]ZGMセM
...
LOADING C SLIP _ ::. _ _ __ .L-A UNLOADING SLIP B*
LOCATIONS WHERE MEASUREMENTS WERE TAKENTYPICAL CROSS-SECTION
SCALE: 1;]6"=
1'-0"FIGURE 2
CROSS-SECTION OF ELEVATOR AND WHARFS
ELEVATION DESCRIPTION OF SO I L BLOWS/FOOT
1 0 20 30 40 50 60 7
197.3
194.0 Fill Boulders & Sand, Some Coal
188 .5 Fill-Clay, Shells (Soft).
•
\I
Fill-Cobbles &I
\
187.9 Sand
\
\
Organic Fine Sandy Silt To \セ
Clayey Si It, Shells. (Firm To
•
Soft) セ . / /
....
...
,
169.6 '''1-0-
...'
.
Clay, Few Tiny She lis ( Firm To
...
,
Sti ff ) -.
"
セ.
."," .",'•
15 2 . 0Varved Clay & Clayel Silt
145 .0 ( Stiff )
142 .4 Sand Gravel, With Some Silt (Firm)
139.9 Boulder ( Drilled)
137.2 Sand Gravel With Some Silt (Firm) Dolomitic Limestone
FIGURE 3
DATA FOR BOREHOLE 15
o
ELEVATION DESCRIPTION OF SO I L BLOWS/FOOT
10
20
30
40
50
60
7
199.8
192.4
Wharf ( Concrete)190.4
Air Void188 .6
WaterOrganic Silt To Clayey Silt,
•
I Shells (Very Soft to Soft) \
"
'4,
\
172.7
\.-.
- - t...
Clay, Few Black Mottles (Firm
,
To Stiff)
•
セ|
'.
156.0
Lセ-Silty Clay, Silt Seams (Firm) . /
151 .0
Sandy Silt, Few Pieces Grave I
142.3
(Firm)Dolomitic Limestone (Sound)
Figure 5 - Piles in place through the wharf, ready to be driven by barge-mounted dragline equipment.
1"=2X10⁻² in./sec
(b)
LEVEL WITH ONECONVEYOR BELT RUNNING LOCATION A VERTICAL .. A.. セN A.
--
-
..
·W 'lI 1"=lX1O-2 in Nセ・」 .AA LOCATION B VERTICAL(a)
BACKGROUND VIBRATIONSLOCATION A
''+----+-
VERTICAL1"=5X10⁻² in./sec
(c)
PILE DRIVING VIBRATIONS; TYPICALOF THE FIRST TWO PILES
e
e
VERTICAL HORIZONTALe
.'
セl
LOCATION A 11l=5X10⁻² in./sec 11l=2X10- 2 in./sec I LOCATION C(a)
BEGINNING OF PILE #31"=5X10- 2 in./sec
(b)
VIBRATIONS DUE TO THE RUNNING OFTHREE CONVEYOR BELTS
FIGURE 7 DISTURBANCE DUE TO PILE DRIVING AND ELEVATOR EQUIPMENT
LOCATION A HORIZONTAL
11l=5X 1 0- 2 in ./sec.
LOCATION C HORIZONTAL
(a) DRIVING PILE
#
4LOCATION A VERTICAL
11l=5X 1 0- 2 in./sec
(b) 3 CONVEYOR BELTS
RUNNING
(e) DRIVING PILE
#
5 IN SOFT MATERIALLOCATION A
VERTICAL Y\oIftIVUlW"lI
1"=5X10- 2 .In./ sec.
(d) DRIVING PILE
#
5 INROC K
\
.
LOCATION A VERTICAL 1"=
5 X 10 - 2 in./5
e
c 1II=
2 X 10 - 2 in./5
e c LOCATION C VERTICAL(a)'
PILE#
6 IN' SOFT MATERIALLOCATION A VERTICAL 1"=5X 1 0- 2 in ./sec
1"=2X 1 0- 2
in ./sec LOCATION C VE RT ICA L セセaiャセBwカGv|イBQイッッ|QnBwBBᄋiセiiGエ|Nmj \II(b)
PILE#
6 IN ROCK..
.
•
Transverse
Vertical Longitudinal
Figure 10 - Typical record, from the Sprengnether recorder, due