HAL Id: hal-02369616
https://hal.archives-ouvertes.fr/hal-02369616
Submitted on 15 Dec 2020
HAL is a multi-disciplinary open access
archive for the deposit and dissemination of
sci-entific research documents, whether they are
pub-lished or not. The documents may come from
teaching and research institutions in France or
abroad, or from public or private research centers.
L’archive ouverte pluridisciplinaire HAL, est
destinée au dépôt et à la diffusion de documents
scientifiques de niveau recherche, publiés ou non,
émanant des établissements d’enseignement et de
recherche français ou étrangers, des laboratoires
publics ou privés.
Critical role for TRIM28 and HP1β/γ in the epigenetic
control of T cell metabolic reprograming and effector
differentiation
Ulf Gehrmann, Marianne Burbage, Elina Zueva, Christel Goudot, Cyril
Esnault, Mengliang Ye, Jean-Marie Carpier, Nina Burgdorf, Thomas Hoyler,
Guadalupe Suarez, et al.
To cite this version:
Ulf Gehrmann, Marianne Burbage, Elina Zueva, Christel Goudot, Cyril Esnault, et al.. Critical role
for TRIM28 and HP1β/γ in the epigenetic control of T cell metabolic reprograming and effector
differentiation. Proceedings of the National Academy of Sciences of the United States of America
, National Academy of Sciences, 2019, 116 (51), pp.25839-25849. �10.1073/pnas.1901639116�.
�hal-02369616�
Critical role for TRIM28 and HP1
β/γ in the epigenetic
control of T cell metabolic reprograming and
effector differentiation
Ulf Gehrmanna,b,1,2,3, Marianne Burbagea,1, Elina Zuevaa,4, Christel Goudota,4, Cyril Esnaultc, Mengliang Yea, Jean-Marie Carpiera, Nina Burgdorfa, Thomas Hoylera, Guadalupe Suareza, Leonel Joannasa,
Sandrine Heurtebise-Chrétiena, Sylvère Durandd,e, Rébecca Panesf,g, Angélique Bellemare-Pelletierg, Pablo J. Sáeza, Fanny Aprahamiand,e, Deborah Lefevred,e, Veronique Adoueh, Amal Zine El Aabidinec, Maqbool Muhammad Ahmadc, Claire Hivroza, Olivier Joffrei, Florence Cammasj,k, Guido Kroemerd,e,l,m,n, Etienne Gagnonf,g, Jean-Christophe Andrauc, and Sebastian Amigorenaa,2
a
Institut Curie, Université Paris Sciences et Lettres, INSERM U932, 75005 Paris, France;bTranslational Science and Experimental Medicine, Research and Early
Development, Respiratory, Inflammation and Autoimmunity, BioPharmaceuticals Research and Development, AstraZeneca, Gothenburg, 431 83 Mölndal,
Sweden;cInstitute de Génétique Moléculaire de Montpellier, University of Montpellier, CNRS, 34094 Montpellier, France;dInstitut Gustave Roussy,
Plateforme Métabolomique/UMR1138, 94800 Villejuif, France;eEquipe Labellisée par la Ligue contre le Cancer, Université de Paris, Sorbonne Université,
INSERM U1138, Centre de Recherche des Cordeliers, 75006 Paris, France;fFaculté de Médecine, Département de Microbiologie, Infectiologie et
Immunologie, Université de Montréal, Montréal, QC H3T 1J4, Canada;gAxe de Recherche en Immunobiologie du Cancer, Institut de Recherche en
Immunologie et Cancérologie, Montréal, QC H3T 1J4, Canada;hCNRS, Centre de Physiopathologie de Toulouse Purpan, Université de Toulouse, Université
Paul Sabatier, 31330 Toulouse, France;iINSERM U1043, Centre de Physiopathologie de Toulouse Purpan, Université de Toulouse, Université Paul Sabatier,
31330 Toulouse, France;jInstitut de Recherche en Cancérologie de Montpellier, INSERM U1194, Université Montpellier, 34298 Montpellier, France;kInstitut
Régional du Cancer Montpellier, Université Montpellier, 34298 Montpellier, France;lPôle de Biologie, Hôpital Européen Georges Pompidou, Assistance
Publique–Hôpitaux de Paris, 75015 Paris, France;mSuzhou Institute for Systems Medicine, Chinese Academy of Medical Sciences, Suzhou 215123, China;
andnDepartment of Women’s and Children’s Health, Karolinska University Hospital, Karolinska Institute, 17177 Stockholm, Sweden
Edited by Anjana Rao, La Jolla Institute for Allergy and Immunology, La Jolla, CA, and approved October 28, 2019 (received for review January 30, 2019)
Naive CD4+ T lymphocytes differentiate into different effector types, including helper and regulatory cells (Th and Treg, respec-tively). Heritable gene expression programs that define these effec-tor types are established during differentiation, but little is known about the epigenetic mechanisms that install and maintain these programs. Here, we use mice defective for different components of heterochromatin-dependent gene silencing to investigate the epi-genetic control of CD4+T cell plasticity. We show that, upon T cell receptor (TCR) engagement, naive and regulatory T cells defective for TRIM28 (an epigenetic adaptor for histone binding modules) or for heterochromatin protein 1β and γ isoforms (HP1β/γ, 2 histone-binding factors involved in gene silencing) fail to effectively signal through the PI3K–AKT–mTOR axis and switch to glycolysis. While differentiation of naive TRIM28−/−T cells into cytokine-producing effector T cells is impaired, resulting in reduced induction of auto-immune colitis, TRIM28−/−regulatory T cells also fail to expand in vivo and to suppress autoimmunity effectively. Using a combination of transcriptome and chromatin immunoprecipitation-sequencing (ChIP-seq) analyses for H3K9me3, H3K9Ac, and RNA polymerase II, we show that reduced effector differentiation correlates with im-paired transcriptional silencing at distal regulatory regions of a de-fined set of Treg-associated genes, including, for example, NRP1 or Snai3. We conclude that TRIM28 and HP1β/γ control metabolic reprograming through epigenetic silencing of a defined set of Treg-characteristic genes, thus allowing effective T cell expan-sion and differentiation into helper and regulatory phenotypes.
T cells
|
immunology|
epigenetics|
autoimmunity|
TRIM28T
cells participate and control the vast majority of adaptive immune responses. While CD8+T cells mediate killing of virus-infected and tumor cells, CD4+T cells positively (helper T cells, Th) and negatively (regulatory T cells, Tregs) regulate both cytotoxic and antibody responses. Similar to pluripotent stem cells, which retain the ability to differentiate into tissue-specific cell types, naive cells leaving the thymus have the capacity to differ-entiate into distinct subsets of effector or regulatory cells upon activation that differ in their transcriptional programs and meta-bolic needs. For example, while all T cells rely on glucose me-tabolism for clonal expansion, only Th effector functions are linkedto glycolysis, while the suppressive capacity of Tregs has been linked toβ-oxidation of fatty acids (1, 2).
Significance
CD4 T cells are major regulators of immune responses against both self and pathogens. Understanding pathways that govern CD4 T cell differentiation and regulation are thus key for the discovery of new immunoregulatory drug targets. Here, we have identified an epigenetic pathway that regulates the expression of a set of proteins that determine T cell responsiveness. By si-lencing enhancers distal to a set of genes known to be involved in regulatory T cell function, the epigenetic modifiers TRIM28 and HP1β/γ regulate T cell receptor signaling. This leads to defective metabolic reprograming and inefficient effector differentiation of naive T cells. This mechanism provides an exciting opportunity to regulate T cell responsivity in both autoimmunity and T cell-based immunodeficiencies.
Author contributions: U.G., M.B., and S.A. designed research; U.G., M.B., E.Z., C.E., J.-M.C., N.B., T.H., G.S., L.J., S.H.-C., S.D., R.P., A.B.-P., P.J.S., F.A., D.L., A.Z.E.A., and M.M.A. per-formed research; O.J., F.C., G.K., E.G., and J.-C.A. contributed new reagents/analytic tools; U.G., M.B., E.Z., C.G., C.E., M.Y., J.-M.C., T.H., G.S., S.D., R.P., A.B.-P., P.J.S., V.A., A.Z.E.A., M.M.A., C.H., and O.J. analyzed data; and U.G., M.B., and S.A. wrote the paper. Competing interest statement: U.G. is currently employed by AstraZeneca AB (Mölndal, Sweden).
This article is a PNAS Direct Submission.
This open access article is distributed underCreative Commons Attribution-NonCommercial-NoDerivatives License 4.0 (CC BY-NC-ND).
Data deposition: The microarray and sequencing data reported in this paper have been deposited in the Gene Expression Omnibus (GEO) database,https://www.ncbi.nlm.nih. gov/geo(accession no.GSE140448).
1U.G. and M.B. contributed equally to this work.
2To whom correspondence may be addressed. Email: ulf.gehrmann@astrazeneca.com or sebastian.amigorena@curie.fr.
3Present address: Translational Science and Experimental Medicine, Research and Early Development, Respiratory, Inflammation and Autoimmune (RIA), BioPharmaceuticals R&D, AstraZeneca, 43183 Mölndal, Sweden.
4E.Z. and C.G. contributed equally to this work.
This article contains supporting information online athttps://www.pnas.org/lookup/suppl/ doi:10.1073/pnas.1901639116/-/DCSupplemental.
First published November 27, 2019.
IMM
UNOLOGY
AND
INFLAM
Typically, these differentiation programs are supported by a series of heritable gene expression programs under the control of specific transcription factors. Epigenetic modifications, including histone acetylation and methylation, or DNA methylation, determine the accessibility of genomic regions to transcription factors. For T cell differentiation into effector T cells, for ex-ample, trimethylation of lysine 4 on histone 3 (H3K4me3) is a permissive mark for transcription of lineage specific cytokines IFNγ (Th1), IL4 and IL13 (Th2), and IL17 (Th17), while H3K27me3 is associated with their transcriptional repression (3–7). DNA methylation, in turn, is critical for regulating the ex-pression of Foxp3, the hallmark transcription factor of Tregs (8). Recently, we showed that H3K9 trimethylation, characteristic for transcriptionally inactive heterochromatin domains, at the IFNγ locus is decisive for Th2 lineage commitment (9). Differ-entiated Th2 cells from mice lacking the histone methyltransferase Suv39h1 or the heterochromatin protein 1α (HP1α), readily con-verted to IFNγ-expressing Th1-like cells, while wild-type (WT) cells did not. HP1α and its 2 other isoforms, HP1β or HP1γ, are recruited to chromatin by a tripartite motif containing, scaffolding protein, TRIM28 (also known as KAP1 or Tif1β) (10). TRIM28 interacts with KRAB-zinc finger proteins to target specific geno-mic regions and modulates transcription through interactions with HP1 isoforms (11, 12). Moreover, recent studies suggest that TRIM28, HP1β, and HP1γ regulate initiation and/or elongation of RNA polymerase II (Pol II)-dependent transcription (13–15).
Several studies revealed an important role for TRIM28 in T cell development and activation. Mice with T cell-specific deletion of TRIM28 (TRIM28−/−) lack invariant natural killer T cells due to altered use of T cell receptor α (TCRα) chains and develop autoimmunity due to TGFβ3 overexpression and deregulation of the Th17 pathway (16–18). TRIM28−/−mice also have increased Tregs numbers and a defect in IFNγ production in Th1 cells, but the mechanism for this imbalance remains unclear (17). Although it was shown that TRIM28 could interact with both polycomb and heterochromatin effectors in other cell types, it is still unclear which of these 2 epigenetic effector pathways mediates the effects of TRIM28 in T cells (19).
We now show that TRIM28−/− and HP1β/γ−/− T cells fail to differentiate into helper and Tregs due to an early defect in metabolic reprograming to glycolysis. Defective metabolic reprograming results from impaired TCR/CD28 signaling through the PI3K–Akt–mammalian target of rapamycin (mTOR) axis. These defects correlate with impaired epigenetic silencing by TRIM28 and HP1β/γ at distal regulatory regions to a defined set of Treg-characteristic genes, whose silencing is critical to proper T cell expansion and differentiation into helper and regulatory phenotypes.
Results
TRIM28 Is Necessary for Efficient Teff Differentiation and Function In Vivo. As shown previously by others, TRIM28flox/flox × CD4Cre mice (TRIM28−/−) develop phenotypically normal primary and secondary lymphoid organs and display minor alterations in thymocyte development (17, 18) (SI Appendix, Fig. S1 G–J). TRIM28 expression is normal in double-negative thymocytes and decreases by about 50% in double-positive thymocytes and by almost 100% in CD4+and CD8+peripheral T cells. Lack of TRIM28 expression in peripheral T cells is also visible by Western blot (SI Appendix, Fig. S1A).
Bone marrow (BM) from TRIM28−/− mice contains signifi-cantly fewer central and effector memory T cells (SI Appendix, Fig. S1B) and fewer CD44+memory CD4 T cells expressing the proliferation marker Ki67 in peripheral lymph nodes (SI Appendix, Fig. S1C). Upon sorting of effector memory T cells from spleen and mesenteric lymph nodes of aged mice, we also detected less effector cytokines (IFNγ, IL13, and IL17) after ex vivo restim-ulation with PMA/ionomycin (SI Appendix, Fig. S1D). Adoptively transferred TRIM28-deficient OT-II naive T cells proliferated less and produced less effector cytokines after immunization with ovalbumin (OVA) in complete Freund’s adjuvant (CFA) (SI
Appendix, Fig. S1E). CFA-OVA immunization of TRIM28−/− resulted in significantly fewer IL4-producing OVA-specific CD4+ T cells compared to WT controls (SI Appendix, Fig. S1F).
To test whether this defect in effector T cell function trans-lates to decreased T cell-mediated immunopathology, we studied a T cell transfer colitis model (20). Rag2−/−mice transferred with TRIM28−/−× RorcGFP+naive CD4+T cells survived longer and developed significantly less colitis, as evidenced by the delay in weight loss, decreased T cell infiltration in colonic mucosa, in-creased colon length, and lower immunohistopathology scores of colonic tissue (Fig. 1 A–E). Time course analysis of CD4+T cells in the blood revealed a strong defect in T cell expansion and development into Rorγt-expressing cells that translated into fewer IFNγ- and IL17-producing splenic CD4+T cells (Fig. 1 F–I). We conclude that TRIM28 is necessary for efficient effector
Fig. 1. T cell-mediated immunopathology depends on TRIM28. (A and B)
Survival and weight loss (percentage of starting weight) of Rag2−/−mice
after transfer of either TRIM28−/−× RorcGFP or littermate control naive CD4+
T cells. (C) Immunohistochemistry of colonic mucosa of Rag2−/−mice injected
with either TRIM28−/−or littermate control naive CD4+T cells usingαCD3
(brown) to stain for infiltrated T cells. (D and E) Colon length and histo-pathologic analysis of colonic sections from mice killed in A. (F)
Represen-tative dot plots (6w) and quantification of total (upper row) or RorcGFP+
(lower row) CD4 T cells in blood of Rag2−/−mice, at different time points
after adoptive transfer. (G) Percentage of RorcGFP+CD4 T cells in spleen of
Rag2−/−mice at termination. (H and I) Numbers (H) and percentages (I) of
IL17- or IFNγ-producing splenic CD4+T cells after ex vivo restimulation with
PMA/ionomycin/brefeldin A. (B and F) Symbols (A and F) or bars (D, E, G, H,
and I) show mean± SEM. The dots represent individual mice (E, G, H, and I).
Student’s t test (E, G, H, and I) or 2-way ANOVA (B and F) was used to
cal-culate statistical significance. Data are from 2 independent experiments;
T cell development and expansion in vivo and that its absence prevents the development of T cell-mediated pathology.
TRIM28−/−Chimeras Develop Severe Autoimmunity due to Deficient Treg Expansion.The aforementioned results seem inconsistent with previous studies showing that TRIM28−/−mice develop autoim-munity (18). While TRIM28−/−mice from our animal facility only develop mild symptoms of autoimmunity upon aging (SI Appendix, Fig. S1 G–P), TRIM28−/− BM chimeras suffered from wasting disease and displayed significant weight loss starting 5 wk after reconstitution (Fig. 2A), confirming the development of autoim-munity. TRIM28−/−chimeras generated from T cell-depleted BM or isolated BM T cells developed similar symptoms, indicating that autoimmunity is not solely due to expansion of preexisting, autoreactive BM T cells (SI Appendix, Fig. S2A). Weight loss was not observed in mixed BM chimeras that were reconstituted with as little as 25% of WT BM (Fig. 2B), suggesting that the pheno-type in the TRIM28−/− chimeras could be due to defective ex-pansion or differentiation of TRIM28−/−Tregs. Indeed, in these mixed chimeras, regulatory T cells derived mainly from WT BM precursors, while effector T cells developed in similar proportions from WT and TRIM28−/−precursors (Fig. 2 C and D). In addi-tion, TRIM28−/−chimeras reconstituted with T cell-depleted BM or T cells isolated from BM, harbored significantly fewer splenic Tregs, while the effector compartments developed similarly or were slightly increased, compared to WT chimeras (SI Appendix, Fig. S2B). Also, fewer Tregs from TRIM28−/− mice expressed the proliferation marker Ki67 compared to WT controls (SI Ap-pendix, Fig. S2C).
To test whether the observed autoimmunity is a consequence of defective Treg expansion or loss of Treg stability, we transferred CD45.2+ WT or TRIM28−/− Tregs alongside CD45.1+ naive T cells into Rag2−/−mice. TRIM28−/− Treg numbers were signif-icantly reduced following adoptive transfer (SI Appendix, Fig. S2 D and E). This was not due to loss of Treg phenotypic stability as ex vivo isolated Tregs maintained higher Foxp3 expression upon redifferentiation in Th17 effector cytokine conditions (SI Appendix, Fig. S2F). Thus, failure of TRIM28−/− Treg to reconstitute the Treg compartment was likely due to an ex-pansion defect. Finally, while WT and TRIM28−/−Tregs per-formed similarly in an in vitro suppression assay (SI Appendix, Fig. S2G), only WT, but not TRIM28−/−, Tregs suppressed autoimmunity when transferred to TRIM28−/−BM chimeras at the time of reconstitution (Fig. 2E andSI Appendix, Fig. S2H). We conclude that TRIM28 is required for both effector and regulatory T cell expansion and that defective Treg expansion, and not their functional differentiation, is likely responsible for the development of autoimmunity in TRIM28−/−mice.
TRIM28 Is Required for Metabolic Reprogramming Early during Teff Differentiation.In order to delineate the underlying mechanisms for the observed phenotypes, we differentiated naive CD4+T cells into Teff in vitro. TRIM28 deficiency impairs effector cytokine production in differentiated Th1, Th2, Th17 cells after PMA/ ionomycin restimulation (Fig. 3 A and B andSI Appendix, Fig. S3 A–C). Deficient IFNγ, IL13, and IL17 production was not due to impaired proliferation, as TRIM28−/−cells having undergone the same number of cell cycles still produced less effector cytokines (SI Appendix, Fig. S3D). We also observed a significant increase in Foxp3-expressing Th1 cells in vitro (Fig. 3 A and B) and increased percentages of Foxp3-expressing cells in vivo upon injection of a 1:1 ratio of CD45.1 WT and CD45.2 TRIM28−/− T cells into Rag2−/− mice (SI Appendix, Fig. S3E). Defective cytokine pro-duction and Foxp3 overexpression were both cell intrinsic since TRIM28−/−naive T cells from mixed BM chimeras showed the same proliferation and priming defects (SI Appendix, Fig. S3F). Addition of TGFβ3 to WT T cells, which was previously shown to be overexpressed in TRIM28−/−T cells, did not reproduce the TRIM28 phenotype (SI Appendix, Fig. S3Gand ref. 18). Consis-tently, blockingαTGFβ antibodies did not rescue cytokine pro-duction in knockout TRIM28−/− cells (SI Appendix, Fig. 3H).
Therefore, TRIM28−/−T cells bear an intrinsic defect that impairs effector differentiation.
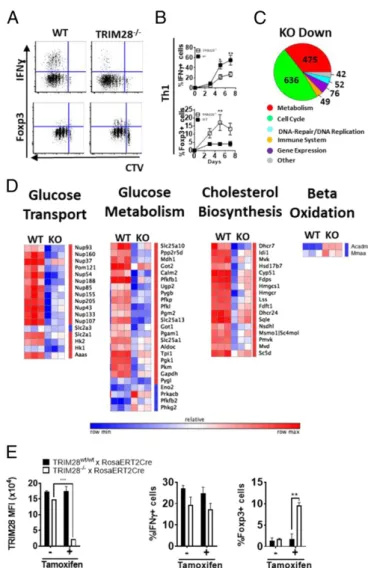
To identify the transcriptional pathways deregulated in TRIM28−/− Th1 cells, we analyzed the transcriptomes of in vitro differentiated Th1 cells using Affymetrix microarrays. Genes involved in cell cycle progression and in metabolism were significantly down-regulated in TRIM28−/− T cells, compared to WT littermates (Fig. 3C). Anabolic pathways, such as“Cholesterol Biosynthesis” or“Glucose Transport and Metabolism,” were down-regulated in TRIM28−/− Th1 cells, compared to control littermates (SI Ap-pendix, Fig. S3I). The only metabolic RNA category up-regulated in TRIM28−/−over WT Th1 cells was mitochondrialβ-oxidation (SI Appendix, Fig. S3I). The switch to glucose metabolism is a hallmark of effector T cell differentiation, while naive T cells and Tregs generate their energy mainly through β-oxidation of fatty acids (1). These results suggest that the defect in effector function observed in TRIM28−/−T cells results from an impaired switch from oxidation to glycolysis.
To investigate whether TRIM28 interferes with effector function in already differentiated effector T cells or early during T cell differentiation, we used naive T cells from TRIM28flox/flox or TRIM28wt/wtmice crossed with tamoxifen-inducible RosaCreERT2 mice. Addition of tamoxifen in vitro, at the time of naive T cell activation, resulted in strong TRIM28 depletion in effector T cells (after 5 d of differentiation). TRIM28-depleted effector T cells, however, showed no defect in cytokine production, while Foxp3 expression was still increased in Th1 cells (Fig. 3E). Therefore, impaired effector cytokine production in T cells re-quires early TRIM28 depletion, and cannot be obtained by delayed depletion, while the effect on Foxp3 follows TRIM28 depletion, even if it occurs at later stages (suggesting a more direct effect of TRIM28 on silencing of FoxP3 during effector differentiation).
Loss of TRIM28 Leads to Defective mTOR Signaling and Glycolysis in Naive and Regulatory T Cells.To investigate whether the defect in glycolytic switch is due to defective T cell activation after TCR engagement, we first measured proliferation and blasting after stimulation of naive CD4+T cells withαCD3/αCD28. TRIM28−/− cells displayed a significant delay in proliferation and blasting starting 24 h after stimulation (as defined by forward-scatter ac-quisition) (Fig. 4 A and B). Transcriptomic analysis and13C-glucose tracing experiments revealed deregulation of glucose (and lipid) metabolisms only in activated, not naive TRIM28−/− CD4 T cells (Fig. 4C and SI Appendix, Fig. S4 A–C). In activated TRIM28−/−T cells,13C-labeled carbons accounted for a signif-icantly smaller fraction of glycolysis-dependent metabolites such as lactate, serine, methionine, citrate, and succinate, compared to WT T cells (Fig. 4C). Bioenergetics measurements revealed a significant defect in glycolysis in TRIM28−/− T cells after 24 h (but not 4 or 0 h) of activation, compared to cells from control littermates, while mitochondrial respiration remained unchanged (Fig. 4D andSI Appendix, Fig. S4 D and E). Defective glycolysis at 24 h was not due to increased presence of Foxp3+cells (SI Appendix, Fig. S4F). Since glucose metabolism is mainly regu-lated via the mTOR pathway, we measured S6 and 4-EBP1 phosphorylation as surrogate markers of mTOR activ-ity. As expected, activated TRIM28−/− T cells exhibited lower levels of 4-EBP1 and S6 phosphorylation, both in Foxp3+ and Foxp3− T cells (Fig. 4 E and F and SI Appendix, Fig. S4 G and H).
In recent years, mTOR has emerged as a central signaling hub that distinguishes effector from regulatory T cell differentiation by regulating key metabolic pathways, such as glycolysis (21). Impor-tantly, while the absence of mTOR activity is important for Foxp3 expression and iTreg differentiation, its activity is necessary for the expansion of Tregs and maintenance of immune homeo-stasis in vivo. Tregs from TRIM28−/−mice exhibited reduced gly-colysis and lactate production 24 h afterαCD3/αCD28 activation, coinciding with a decrease in αCD3/αCD28 and IL2-dependent S6 phosphorylation and proliferation (Fig. 4 G and H). To-gether, these results suggest that the absence of TRIM28 impairs
IMM
UNOLOGY
AND
INFLAM
mTOR signaling in naive and regulatory CD4 T cells and thereby interferes with effector T cell differentiation and Treg expansion.
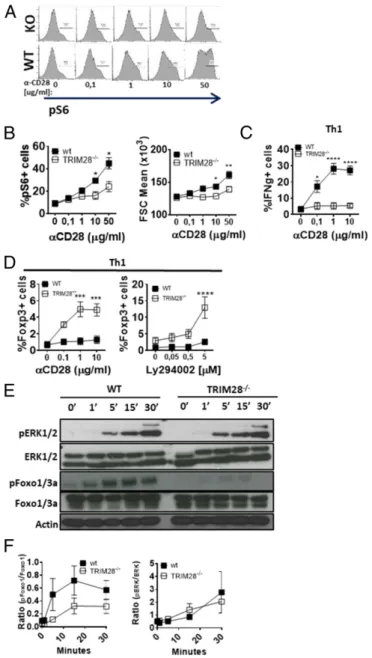
Defective Signaling through CD28 in TRIM28−/−T Cells.To explain the decreased mTOR activity in TRIM28−/−T cells, we investigated signaling events proximal to TCR/CD28 stimulation. Metabolic switch to glycolysis in effector T cells is mainly driven by CD28– PI3K–AKT–mTOR signaling axis (22). Expression of CD28, but not CD3, was slightly, but significantly, reduced in TRIM28−/−, compared to control T cells (SI Appendix, Fig. S5A). To test whether defective signaling through CD28 may explain the mTOR defect, we measured the response of WT and TRIM28−/−CD4+ T cells to increasing concentrations ofαCD28 (leaving the con-centration ofαCD3 unchanged). While S6 phosphorylation, T cell blasting (FSC), and IFNγ production were similar in WT and TRIM28−/−cells stimulated withαCD3 alone, increasing concen-trations ofαCD28 led to a significant increase in pS6, FSC, and IFNγ production in activated CD4+T cells from WT, but not from TRIM28−/−mice (Fig. 5 A–C). In contrast, increased CD28 en-gagement in TRIM28−/−, but not in WT Th1 cells, resulted in up-regulation of Foxp3 expression (Fig. 5 D, Left). Foxp3 expression was further increased by inhibition of PI3K by Ly294002 (Fig. 5 D, Right), suggesting that CD28-dependent Foxp3 induction is achieved through an alternative, PI3K-independent pathway. In contrast, we did not observe any differences in Ca2+ sig-naling between WT and TRIM28−/−T cells following activation with αCD3/αCD28 or ionomycin (SI Appendix, Fig. S5B). The signaling defect was limited to stimulation through CD28, as T cell activation, S6 phosphorylation, and blasting were rescued by stimulation with PMA/ionomycin (SI Appendix, Fig. S5C). Western blot analysis of downstream signaling molecules revealed that phosphorylation of the Akt substrate Foxo1/3a, but not that of ERK1/2, downstream of CD3e signaling, was impaired in TRIM28−/−, compared to WT T cells, also consistent with a defect in signaling through the CD28–PI3K–AKT–mTOR axis (Fig. 5 E and F). PKCθ recruitment is a hallmark difference in CD28 signaling between Tregs and Tconv (23). Strikingly,αCD3/ αCD28 stimulation led to decreased recruitment of PKCθ to the immune synapse in TRIM28−/−compared to WT cells (SI Ap-pendix, Fig. S5 D and E).
Together, these results indicate that, while CD28 is active in both WT and TRIM28−/−T cells, CD28 signals through alternative pathways in TRIM28−/−T cells, leading to Foxp3 expression rather than mTOR activation. The results also show that TRIM28−/− naive T cells present differences in precocious events of activation, minutes after TCR engagement, when transcriptional or epige-netic regulation events are unlikely to have occurred. We therefore explored the possibility that the observed phenotype is due to epigenetic deregulation in naive T cells before they are activated.
TRIM28 Deficiency Reactivates Silent Regulatory Elements in Naive T Cells through H3K9 Histone Modifications.To investigate possible differences in gene expression between naive WT and TRIM28−/− cells, we analyzed their respective transcriptomes by means of Affymetrix microarrays. In total, 222 RNA species were signifi-cantly up-regulated, and 76 are down-regulated in naive TRIM28−/− T cells, compared to WT naive T cells (Fig. 6A). Differences in gene expression were statistically significant, but small (ranging between 1.2- and 10-fold). Three times more genes were up- than down-regulated, consistent with the known role of TRIM28 as a transcriptional corepressor (11).
TRIM28 functions as a molecular adaptor for gene si-lencing through both the polycomb and the HP1 pathways. HP1-mediated control of gene expression depends on H3K9 trimethylated (H3K9me3) and acetylated (H3K9Ac) epigenetic marks, which are associated with stable silencing and active
Fig. 2. TRIM28 is required for Treg expansion and suppression in vivo.
(A) Weight (as percent starting weight) of Rag2−/− mice irradiated
and reconstituted with BM from WT or TRIM28−/−mice. (B) Rag2−/−BM
chimeras were reconstituted with the indicated percentages of WT and
TRIM28−/−BM and weighed 6 wk after reconstitution. (C and D)
Repre-sentative dot plots (C ) and quantification (D) of splenic Tregs and CD4 EM cells of mice from (B). Data are presented as percentage of CD45.1 (WT) or
CD45.2 (TRIM28−/−) CD4+T cells. (E ) Weight (as percent starting weight)
of Rag2−/−mice reconstituted with TRIM28−/−BM and sorted Tregs from
WT or TRIM28−/−mice. (A–E) Data are from 2 independent experiments
with 4 to 7 mice per group. Symbols (A and E ) or bars (B and D) show
mean± SEM. Two-way ANOVA (A and E), one-way ANOVA (C), or Student’s
t test (D) was used to calculate statistical significance. *P< 0.05; **P < 0.01;
transcription, respectively (24). To explore whether the observed transcriptional changes would be correlated to changes in H3K9 histone modifications, we performed chromatin immunoprecipi-tation sequencing (ChIP-seq) for H3K9me3, H3K9Ac on naive CD4+T cells from TRIM28−/−and WT mice. We observed a significant correlation between increased acetylation and de-creased trimethylation 20 to 50 kB around differentially regu-lated genes (Fig. 6 B and C). Increase in acetylation and decrease in trimethylation positively correlated with changes in gene expression in TRIM28−/− T cells compared to WT lit-termates. H3K9Ac was significantly increased on 51 promoters
and 347 distal regulatory elements (defined based on a classical H3K4me1/H3K27ac signature) around the differentially regu-lated genes (SI Appendix, Fig. S6A), indicating a more pro-nounced effect of TRIM28 depletion on distal regions and thus on putative active enhancers, compared to promoters (Fig. 6C; P< 10−5, Fisher test).
RNA-seq and ChIP-seq for RNA Pol II revealed an increased transcription at H3K9-hyperacetylated distal regions in TRIM28−/−, compared to WT CD4+T cells (SI Appendix, Fig. S6B). This is exemplified at the TNFRII, Snai3/Rnf166, and NRP1 loci, which showed increased H3K9ac signals at a distal, regulatory upstream regions (E) that also correlated with decrease of the H3K9me3 signal (Fig. 6D and SI Appendix, Fig. S6C). Reanalysis of a published ChIP-seq dataset using TRIM28-specific antibodies on thymocytes revealed significant enrichment of TRIM28 peaks around transcriptionally deregulated genes (SI Appendix, Fig. S6D). We further confirmed the presence of TRIM28 at transcriptionally deregulated genes using TRIM28-specific ChIP-PCR and primers designed for TRIM28 peaks identified in SI6C, negative and published positive controls (SI Appendix, Fig. S6E
and refs. 17 and 18). Taken together, these results suggest that TRIM28 regulates the levels of acetylation vs. trimethylation of H3K9 at a selective set of distal regulatory elements (and pro-moters) of genes that are up-regulated in TRIM28-defective cells. To investigate the nature of the link between this set of deregulated genes and the phenotype observed in TRIM28−/− T cells, we used pathway and transcription factor binding site analysis. While we did not detect any significant gene enrich-ment for published pathways and GO terms among differentially deregulated genes, we did detect a significant enrichment of binding sites for Foxo1, a transcription factor strongly associated with Tregs and metabolic regulation (25–28) (Fig. 6E andSI Ap-pendix, Fig. S6 F and G). Gene set enrichment analysis (GSEA) revealed that a significant proportion of differentially expressed genes overlap with a published Treg signature (Fig. 6 E and F and ref. 29). Increased RNA levels of Tnfrsf1b, Folr4, and Nrp1 co-incided with increased surface expression levels for TNFR II, FR4, or NRP1 on naive CD4+T cells (SI Appendix, Fig. S6H). Also, a similar increase in FR4 and NRP1 was observed on naive TRIM28−/−T cells and CD4+single- and double-positive thy-mocytes from mixed BM chimeras, indicating a direct, cell-intrinsic effect of TRIM28 on these genes during thymic devel-opment (SI Appendix, Fig. S6I). These results suggest that a defect in epigenetic silencing of a set of Treg-associated genes alters early T cell activation, causing defective downstream mTOR signaling and effector differentiation.
TRIM28 Regulates T Cell Activation and Differentiation through Treg-Associated Genes and Akt.NRP1 has been shown to interfere with T cell activation by recruiting the phosphatase PTEN to the immunological synapse (30). To test whether thymic epigenetic silencing of NRP1 is required for activation and proliferation of peripheral T cells, we overexpressed NRP1 alongside Ametrine, a fluorescent reporter gene in an OVA-specific T cell hybridoma and activated the transduced cells via OVA-pulsed dendritic cells. NRP1-overexpressing cells proliferated less in response to den-dritic cell-mediated activation compared to the Ametrine reporter transfection control, as evidenced both by less CFSE dilution and lower cell numbers up to 12 d posttransfection, relative to the Ametrine-only control (Fig. 7 A–C). To further explore the con-tribution of overexpressed Treg genes to TRIM28-associated de-fects, we first sought to block Nrp1 function in TRIM28−/−naive T cells. Using blocking antibodies against Nrp1 and its ligand semaphorin4a or CRISPR/Cas9-mediated gene ablation, we found IL17, but not IFNγ production was partially restored by blocking the Nrp1-signaling axis (Fig. 7 D and E). In contrast, CRISPR/Cas9 targeting of Snai3 increased both IFNγ and IL17 production. CRISPR/Cas9-mediated knockdown led to a 40 to 50% decrease in Nrp1 surface levels as assessed by flow cytometry (SI Appendix, Fig. S7A) and 30 to 50% Snai3 frameshift mutations (SI Appendix,
Fig. 3. Transcriptional deregulation of key metabolic pathways in
TRIM28−/−T cells. (A and B) Dot plots and quantification showing Cell Trace
Violet (CTV) dilution (A), IFNγ (A and B) and Foxp3 (A and B) expression in
differentiated TRIM28−/−or littermate control Th1 at day 5 of culture after
restimulation. Data are from 6 experiments and 12 mice per time point. (C) Pie chart of pathways enriched in genes with decreased expression levels in Th1
TRIM28−/−cells compared to littermate control cells. Numbers of deregulated
genes are indicated in the corresponding plot section. (D) Heatmaps and hierarchical clustering of metabolic pathways showing genes
differen-tially regulated in Th1 cells from TRIM28−/−or littermate control mice.
Coloring corresponds to relative expression values, normalized for each
gene. Data are generated from 3 TRIM28−/− and matching littermate
control mice. (E ) Quantification of TRIM28 expression, IFNγ production, and Foxp3 expression after Th1 differentiation of naive T cells from
TRIM28+/+or TRIM28−/−× Rosa26ERTCre mice in the presence or absence
of tamoxifen, at day 5, following restimulation. Data are from 2 independent
experiments. (A and E) Symbols (A) or bars (E) show mean± SEM, and 2-way
ANOVA was used to determine statistical significance. *P< 0.05; **P < 0.01;
***P< 0.001. IMM UNOLOGY AND INFLAM MATION
Fig. S7B) as assessed by tracking of indels by decomposition, as described previously (31).
Since NRP1 has been shown to recruit PTEN, an antagonist of the PI3K–Akt pathway, we asked whether overexpression of constitutively active Akt in TRIM28−/− CD4 T cells would rescue effector T cell differentiation. Following transduction of activated naive CD4 T cells with a construct coding for myristoylated Akt and subsequent differentiation into Th1, Th2, or Th17 effector cells, TRIM28−/− Th1 cells produced significantly more IFNγ (Th1) and IL17 (Th17) than the respective trans-duction control (Fig. 7 F and G and SI Appendix, Fig. S7C). Cytokine levels reached those of control vector transduced WT Th1 and Th17 cells (Fig. 7 F and G andSI Appendix, Fig. S7C). Similar findings were made for Th2 cells, although differences did not reach statistical significance (SI Appendix, Fig. S7D). Increased cytokine responses in Th1 and Th17 cells were de-pendent on glucose concentrations in the medium suggesting that myr-Akt overexpression rescues effector T cell differen-tiation by restoring glycolysis (SI Appendix, Fig. S7E). We
conclude that TRIM28 permits effector T cell differentiation due to epigenetic silencing of genes that interfere with the Akt signaling pathway. In the absence of TRIM28, restoring the Akt pathway can overcome the TRIM28-induced hyporesponsiveness in a glucose-dependent manner.
TRIM28 Requirement for Effector T Cell Differentiation Is Dependent on HP1.Since transcriptional changes in TRIM28−/−T cells corre-lated with changes in H3K9 histone modifications, we investigated whether TRIM28 needs to interact with the H3K9me3-binding HP1 isoforms (α, β, and γ) to control the induction of glycolysis and effector/regulatory fates. We first analyzed T cell effector differentiation in mice harboring a mutated version of TRIM28 (V488L490/AA), which impairs interactions with all HP1 isoforms α, β, or γ (32). TRIM28ΔHP1box/flox× CD4Cre (TRIM28ΔHP1box/−) mice express normal levels of the mutated TRIM28 protein (SI Appendix, Fig. S8A). While TRIM28ΔHP1box/−mice had phenotypi-cally normal spleens, thymus, and T cell compartments (SI Appen-dix, Fig. S8 B–D, Left), CD4+T cells from TRIM28ΔHP1box/−mice
Fig. 4. TRIM28 regulates the metabolic switch to glycolysis in naive and regulatory CD4+T cells following TCR activation. (A and B) Histogram plots of Cell
Trace Violet (CTV) dilution (A), division index (B, Left), or FSC (B, Right; used as a measure of T cell blasting), 48 h (A) or at different time points (B) after
stimulating TRIM28−/−or littermate control naive CD4+T cells withαCD3/αCD28. (C) Graphic representation of glucose-dependent metabolic pathways and
scatter plots of13C incorporation in indicated metabolites in TRIM28−/−or littermate control CD4+activated for 24 h usingαCD3/αCD28. Data are from
bi-ological replicates of 1 to 2 mice per group. (D and G) Quantification of the extracellular acidification rate (ECAR) of TRIM28−/−or littermate control naive
CD4+(D) or Tregs (G) activated for 24 h usingαCD3/αCD28 (D), in presence or absence of IL2 (G) as measured by the Seahorse XFe96 Analyzer. (E and F)
Quantification of ribosomal S6 phosphorylation 24 h after activation of naive CD4+T cell from TRIM28−/−or littermate control mice withαCD3/αCD28 in total
cells (E) or Foxp3- vs. Foxp3+cells from cells stimulated in Th1 conditions (F). (H) Quantification of ribosomal S6 phosphorylation at 24 h and division index
48 h after activation of CD4+Tregs from TRIM28−/−or littermate control mice withαCD3/αCD28 in presence of absence of IL2. (A, B, D, and H) Data are from
2 independent experiments. Two-way ANOVA (B, D, and G), Student’s t test (C and E), or paired t test (F and H) was used to determine statistical significance.
displayed the same defects in proliferation, blasting, and IFNγ and Foxp3 as TRIM28−/−cells (Fig. 8 A, Left, andSI Appendix, Fig. S8 E and F). These results indicate that TRIM28–HP1 interactions
are critical to TRIM28 functions in T cells.
To identify which HP1 isoforms are recruited by TRIM28, we used mice lacking either one or a combination of 2 HP1 isoforms (α, β, and γ). Spleens and thymi of HP1-deficient mice were phenotypically normal (SI Appendix, Fig. S8 B–D and ref. 9). Neither single HP1 isoform defects, nor combined deletion of HP1α and β, affected T cell activation, blasting, or differentiation
(Fig. 8 A, Right, andSI Appendix, Fig. S8 E and F). Simultaneous disruption of HP1β and HP1γ, however, reproduced all of the observed phenotypes of TRIM28−/−or TRIM28ΔHP1box/−T cells (Fig. 8 A, Right). An impaired glycolytic switch, reduced blasting, and decreased mTOR activity were all observed in HP1β/γ−/−, but not HP1α-KO T cells (Fig. 8B andSI Appendix, Fig. S8 E and F). We also detected a similar increase in Treg signature genes, in both TRIM28ΔHP1box/− and HP1β/γ−/−but not HP1α−/−T cells, both at the RNA and protein levels (Fig. 8 C and D andSI Ap-pendix, Fig. S8 G and H). Finally, HP1β/γ−/−or TRIM28ΔHP1box/− BM chimeras developed autoimmune symptoms (similar to TRIM28−/−chimeras), as indicated by severe weight loss and a lack of splenic Tregs (Fig. 8 E and F). We conclude that effector T cell differentiation and Treg expansion both require the interaction of TRIM28 with HP1β/γ isoforms, establishing a direct link between the observed phenotypes and heterochromatin dynamics. Discussion
Over the last few years, it has become clear that T cell functions are linked to specific modes of cell metabolism. While naive and memory T cells, similar to Tregs, rely mainly on oxidative res-piration, differentiation to effector helper T cells, capable of active expansion and secreting high levels of cytokines, requires a “switch” to glycolysis. This glycolytic switch depends on gene expression reprograming that occurs after TCR/CD28-mediated activation of the mTOR pathway. In this study, we unravel an unexpected level of epigenetic control of metabolic reprogram-ing by heterochromatin-dependent gene silencreprogram-ing. TRIM28 or HP1β/γ expression in early differentiating T cells represents an absolute requirement for effective switch of CD4+ T cells to glycolysis. In the absence of the heterochromatin regulators, the balance between H3K9me3 and H3K9ac is modified at regula-tory enhancers at a series of genes, causing their overexpression and inhibiting glycolytic reprograming.
It is unclear at this point which genes are direct targets of TRIM28-HP1β/γ regulation, and which genes are overexpressed as a consequence of indirect effects, as TRIM28 ChIP-seq proved to be irreproducible (in our hands) and unconvincing (in published datasets). It is also unclear whether the defective glycolytic switch is due to deregulation of a complex combination of genes, or to one individual gene among this list. While decreased H3K9me3 levels at some gene regulatory regions were decreased in TRIM28−/− cells, neither TRIM28 nor HP1 possess H3K9 trimethylation activity, suggesting that the TRIM28-HP1β/γ complex recruits a histone-methyltransferase (HMT) of H3K9. HP1 proteins can recruit the HMTs Suv39h1 or Suv39h2, while TRIM28 can recruit another H3K9 HMT, SETDB1 (33–35). Our preliminary results indicate that neither Suv39h1- nor Suv39h2-defective T cells phenocopy the observed defect in effector T cell differen-tiation or the increased expression of the Treg signature. It is therefore most likely that other H3K9 trimethylases, such as SETDB1, are involved.
If TRIM28 is necessary for the full development of effector T cell responses, how then can TRIM28-deficient mice develop autoimmunity [as reported by others (18)]? The authors suggested a defect in the suppressive activity of TRIM28-defective Tregs, even though they did not detect differences in Treg-suppressive activity in vitro. Our results indicate that Tregs from WT and TRIM28−/−mice were equally suppressive in vitro (SI Appendix, Fig. S2F). Tregs from TRIM28−/−mice, however, did not respond to IL2 and failed to expand in vivo to suppress colitis as well as in pure and mixed BM chimeras (Fig. 2C andSI Appendix, Figs. S2 B, D, and E and S4F). Our data further suggest that this expansion defect is due to a defect in mTOR signaling and glycolytic switch (Fig. 4 E and F), which was recently suggested to be necessary for Treg expansion and thereby for their suppressive capacity in vivo (36). Thus, in addition to its role in regulating effector T cell re-sponses, TRIM28 also regulates the expansion of regulatory T cells. A partial defect in Teff development, associated to a strong defect in Treg expansion, most likely accounts for the autoimmune
Fig. 5. Inefficient CD28–PI3K–mTOR signaling in TRIM28−/−T cells. (A and B)
Representative profiles (A) and quantification of ribosomal S6 phosphorylation
(B) and blasting (B) 24 h after activation of TRIM28−/−or littermate control
naive CD4+T cells withαCD3 and increasing concentrations of αCD28. (C) IFNγ
expression on day 5 of Th1 cell cultures from TRIM28−/−or littermate naive
CD4+T cells in the presence of increasing doses ofαCD28. (D) Foxp3 expression
on day 5 of Th1 cell cultures from TRIM28−/−or littermate control mice in the
presence of increasing doses ofαCD28 or PI3K inhibitor Ly294002. (E and F)
Representative Western blots (E) and quantification of band intensities (F)
using cell lysates from TRIM28−/−or littermate control naive CD4+T cells
acti-vated for up to 30 min usingαCD3 and αCD28. (A–D) Data are from 2
in-dependent experiments, and 2-way ANOVA was used to calculate statistical
significance. *P< 0.05; **P < 0.01; ***P < 0.001; and ****P < 0.0001. IMM UNOLOGY AND INFLAM MATION
phenotype observed by others in TRIM28-deficient mice, and by us in BM chimeras (17, 18).
One of the most striking differences between WT and TRIM28 KO T cells is signaling downstream of CD28. While stimulation with αCD28 induced efficient mTOR phosphorylation and Th1 differentiation in WT T cells, it resulted in increased Foxp3 in-duction in TRIM28−/−T cells, even under Th1 priming conditions (Fig. 4A). Foxp3 induction was antagonized by PI3K, as pharma-cological inhibition of this kinase further increased Foxp3 ex-pression in KO T cells, while inhibiting IFNγ exex-pression in WT Th1 cells (Fig. 4F). Therefore, CD28 activation can lead to at least 2 different signaling pathways: one inducing PI3K–Akt–mTOR activity and favoring effector T cell differentiation, the second one leading to Foxp3 expression independently of PI3K. It is interesting to notice that TRIM28 and even HP1 have been implicated as targets for phosphorylation after TCR or IL2 activation (16, 18, 37, 38). TRIM28 can also be phosphorylated downstream of Grb2, an adaptor for the intracellular domain of CD28 (39). Thus, TRIM28 acts proximal to TCR signaling, possibly through chro-matin remodeling. Interestingly, Sauer et al. (40) described a TGFβ-independent pathway of Foxp3 induction that involved chromatin remodeling. The authors demonstrated that premature termination of CD3/CD28 signaling leads to Foxp3 expression in around 10% of activated cells and could further be augmented by inhibition of mTOR and PI3K. Premature termination of signaling also led to increased levels of H3K4me2/3 marks and chromatin accessibility at the promoter and 5′-untranslated region of Foxp3 and other Treg-associated genes (40). Altogether, the results suggest that, in addi-tion to controlling the expression of critical genes in naive T cells, TRIM28 is also necessary for chromatin remodeling at enhancers of Treg-associated genes upon TCR engagement.
Previous studies suggested that hyperresponsivity to TGFβ-derived signals causes the bias toward Treg cell differentiation
(17). While we confirm the overexpression of TGFβ3 mRNA, especially in Th17 cells, we found that deficient effector cell differentiation is a T cell-intrinsic defect and could not be re-stored by blocking TGFβ present in the culture (SI Appendix, Fig. S1 D and E). Furthermore, the transcriptomic Treg signature was enriched in TCR signaling- or Foxp3-dependent genes, but not in genes related to TGFβ signaling. Interestingly, we could not detect any changes in H3K9me3, H3K9Ac, or Pol II proxi-mal to the Foxp3 gene (SI Appendix, Fig. S7C), and its expression was not significantly changed between WT and KO naive T cells up to 24 h postactivation (SI Appendix, Fig. S4F).
These results also suggest that TRIM28 is an important epige-netic regulator during thymic development. Zhou et al. (16) showed that TRIM28 intervenes in TCR rearrangement, and Chikuma et al. (18) found severe defects in thymus development when TRIM28 was deleted at the CD4−/CD8− stage. Disruption of TRIM28 at the CD4+/CD8+stage of thymocyte differentiation (in our case) does not lead to abnormal T cell development. However, silencing of Treg-associated genes, such as NRP1, already occurs in the thymus and might be a prerequisite for the development of naive CD4+T cells with the full potential to differentiate into Treg or Teff in the periphery. Supporting this notion, overexpression of NRP1 in a T cell hybridoma strongly reduced the proliferative re-sponse to antigenic stimulation by dendritic cells (Fig. 7 A–C), while Nrp1 inactivation in naive TRIM28−/− T cells partially restored cytokine secretion. Interestingly, genetic ablation of the Treg-associated genes Nrp1 or Snai3 had different outcomes. Indeed, Snai3 deletion partially restores cytokine secretion both in Th1 and Th17 conditions, while Nrp1 inactivation only had an effect on IL17 production. This suggests that the different Treg-associated genes overexpressed in TRIM28−/− T cells contribute by various mechanisms to the observed defects. Full phenotype restoration is thus likely to depend on targeting multiple genes simultaneously.
Fig. 6. Naive TRIM28−/−T cells display a Treg-like signature. (A) Volcano plot of gene expression in naive TRIM28−/−or littermate control CD4+T cells.
Differentially expressed genes (P< 0.01) are colored blue (down in KO) and red (up in KO). (B) Correlation dot plot using log2FC values for gene expression in
TRIM28−/−over WT naive CD4 T cells (x axis) and H3K9 acetylation in a 20-kb window around the transcription start site (TSS) of differentially expressed genes
(y axis). Correlation was calculated using the Pearson method, and trend line is indicated in black. (C) Correlation dot plot using log2FC values for gene
expression in TRIM28−/−over WT naive CD4 T cells (x axis) and H3K9 trimethylation in a 50-kb window around the TSS of differentially expressed genes (y axis).
Correlation was calculated using the Pearson method, and trend line is indicated in black. (D) Examples of epigenetic and transcriptional perturbations associated with presence or absence of Trim28 at promoters and enhancers at the Trim24 and Snai3 loci. The labels of ChIP-seq tracks are indicated on the Left. P, P1, and P2 represent promoters, and E, putative enhancers, in which gain of H3K9ac active mark and loss of H3K9me3 are observed. (E) Gene set
enrichment analysis (GSEA) using the transcriptome of naive TRIM28−/−or littermate control CD4+T cells in comparison to published Treg↑ and Treg↓
Since the overexpression of a constitutively active form of Akt in TRIM28−/−CD4 T cells rescued their ability to differentiate into cytokine-expressing effectors, and since NRP1 has been shown to interfere with the PI3K–Akt pathway by recruiting the phosphatase PTEN (30), we believe that TRIM28 regulates pe-ripheral T cell activation by epigenetically silencing antagonists of the PI3K–Akt–mTOR pathway during thymic development.
Altogether, this work unravels an unexpected, mechanism of control of effector T cell responses through epigenetic imprint-ing in thymocytes and/or naive T cells. Whether this process of “imprinting” is physiologically controlled during infections, chronic inflammation or aging will be a fascinating subject for future studies. Methods
For detailed information and protocols, seeSI Appendix.
In Vitro T Cell Activation and Differentiation. To isolate naive T cells for in vitro assays, secondary lymphoid organs were collected, pooled, and homogenized
into single-cell suspensions. Naive T cells were enriched using magnetic and
fluorescence-activated cell sorting (MACS and FACS) of naive CD4+, CD62L+, CD25−,
CD44−and CD8+, CD62L+, CD44−T cells using a FACSAria II (BD Biosciences).
Sorted, naive T cells were stained with Cell Trace Violet (Thermo Fisher
Scientific) according to the manufacturer’s instructions, stimulated on αCD3 (BD
Biosciences)-coated flat-bottomed 96-well plates (Corning) with solubleαCD28
(BD Biosciences) in the absence or presence of T cell differentiation mixtures for Th1, Th2, Th17, or Treg.
In Vivo Differentiation Experiments. Naive WT or TRIM28-deficient CD4+
OT-II-GFP cells were isolated using a CD4+T cell enrichment kits (Thermo Fisher
Scientific) as described above, followed by FACS sorting and staining with
Cell Trace Violet as described above. On day−1, 5 × 10⁵sorted naive T cells
were injected i.v. into C57BL/6 recipient mice followed by s.c. immunization
with 50μg of OVA in CFA (Thermo Fisher Scientific) into the left flank on day
0. Four and 8 d later, mice were killed and draining lymph nodes and spleen were removed for analysis of OT-II proliferation (division index based on Cell Trace Violet dilution) and cytokine production. Animal care and use for this study were performed in accordance with the recommendations of the
Fig. 7. Overexpression of NRP1 and constitutively active Akt recapitulate and rescue the TRIM28−/−phenotype. (A–C) Ametrine expression (A) and proliferation
(B and C) of Ametrine-reporter gene+B097 (hybridoma) T cells transduced to express Ametrine (fluorescent reporter) or Nrp1-2A-Ametrine. (A) Ametrine
ex-pression from day 2 to day 12 posttransduction. (B) Relative cell numbers based on positive cells presented in A. Data are normalized based on Ametrine-positive cells in the Ametrine-only condition. (C) CFSE dilution over the course of the first 48 h. Days following CFSE labeling and CFSE mean fluorescence intensity
are indicated. (D) Percentage of IFNγ+TRIM28−/−or littermate control Th1 cells following differentiation in presence of NRP1 and Sma4a or isotype control
an-tibodies. Data are from 2 independent experiments; dots represent individual mice, and paired Wilcoxon test was used to test for statistical significance. (E)
Percentage of IFNγ+or IL17+TRIM28−/−or littermate control cells following CRISPR/Cas9-mediated genetic ablation of Nrp1 (upper row) or Snai3 (lower row). Data
are from 3 to 4 independent experiments. The colors indicate 2 different single-guide RNAs used for gene targeting. The dots represent individual mice, and paired
Wilcoxon test was used to test for statistical significance. (F and G) Representative dot plots (F) and quantification (G) of IFNγ+in WT and TRIM28−/−CD4 T cells
following overexpression of myristoylated Akt and differentiation in Th1 conditions. Wilcoxon (to compare mock to Akt-Myr for each sample) or Mann–Whitney U
test (to compare WT to KO) test were used to test for statistical significance. The dots represent individual mice. Data are from at least 2 independent
experiments. *P< 0.05; **P < 0.01. IMM UNOLOGY AND INFLAM MATION
European Community (2010/63/UE) for the care and use of laboratory animals. Experimental procedures were specifically approved by the ethics committee of the Institut Curie CEEA-IC #118 (CEEA-IC 2014-03 and CEEA-IC 2017-006) in compliance with the international guidelines.
T Cell Transfer Colitis. Transfer colitis was performed similar as reported by Powrie et al. (20).
BM Chimeras. BM was prepared from tibia and femur of TRIM28−/−, littermate
control, or CD45.1 congenic mice, as described previously (41).
Seahorse Assay. Sorted, naive CD4+and CD8+T cells were activated in vitro
using plate-boundαCD3 and soluble αCD28 for 24 h as described above.
Activated T cells were harvested, counted, and washed, and resuspended in assay medium (Seahorse Biosciences). Assay plates (Seahorse
Biosci-ences) were coated with Cell-Tak (Corning) at 22.4μg/mL in PBS for 1 h
before cells were plated at a density of 2× 10⁵cells per well according to
the manufacturer’s instructions. Mitochondrial respiration and glycolysis
were measured using Cell Mito Stress Kit and Glycolysis Stress Kit (both
Seahorse Biosciences) according to the manufacturer’s instructions.
Immunohistochemistry and Microscopy.Immunohistochemistry of colon samples.
Swiss roll samples were fixed in 4% formaldehyde, and 4-μm-thick slices were
cut and embedded in paraffin for further immunohistochemical analysis. CD3 (clone 145-2C11) staining was performed at pH9 (Dako S2367) using a 1:100 dilution for 1 h at room temperature. Staining was revealed using an Elite ABC kit (Vector Laboratories) using diaminobenzidine for 10 min. Nuclei were stained using diluted Harris hematoxylin for 1 min. All immunostainings were performed on a LabVision Autostainer (Thermo Fisher Scientific).
RNA Isolation and Analysis by qPCR or NanoString nCounter. RNA was isolated from naive, activated, or differentiated effector or regulatory cells using the
miRNEasy isolation kit (Qiagen) according to the manufacturer’s
instruc-tions. For qPCR, 200 ng of RNA was transcribed into cDNA using reverse
transcriptase (Thermo Fisher Scientific) according to the manufacturer’s
instructions. qPCR was performed using 5 ng of template cDNA, H2O, Sybr
Green (Roche), and specific primers on a LightCycler 480 (Roche) (45 cy-cles, 60 °C annealing temperature). The following primer sequences were used (9, 42, 43).
Chromatin Immunoprecipitation. Chromatin immunoprecipitation was per-formed similar as previously published (9). Data is deposited in the GEO
database (http://www.ncbi.nlm.nih.gov/geo/query/acc.cgi?acc=GSE140448).
CRISPR/Cas9 Deletion in Naive CD4 T Cells. CRISPR/Cas9-based deletion of NRP1 and Snai3 in naive CD4 T cells was performed as described in ref. 44. Transduction and Protein Overexpression in CD4 T Cells. T cell transduction protocol was performed similar to Singh et al. (45). Cytokine production was
measured 2 d after transduction. SeeSI Appendixfor detailed information.
Statistical Analysis. Student’s t test and one-way ANOVA were used for
normally distributed data, while Mann–Whitney U or Kruskal–Wallis tests
were used for not normally distributed data. For paired samples (e.g., data from mixed BM chimera), paired t test or Wilcoxon test was used, depending on the type of distribution. Data from kinetic experiments were analyzed
using 2-way ANOVA using Bonferroni’s multiple-test correction. *P < 0.05,
**P< 0.01, ***P < 0.001, and ****P < 0.0001. Statistical analysis was
per-formed using GraphPad software (GraphPad Software).
ACKNOWLEDGMENTS. We are grateful to C. Benoist for discussions and analyzing the Treg signature expressed in naive TRIM28-deficient cells. We thank L. Menger and S. Menegatti for advice on setting up CRISPR/ Cas9 experiments in naive T cells. U.G. has been funded by a scholarship of the German Academic Exchange Program (Deutscher Akademischer
Fig. 8. TRIM28 recruits HP1β and HP1γ to silence Treg signature genes and regulate the metabolic switch. (A) Representative dot plots and
quantifi-cation of IFNγ and Foxp3 expression in differentiated Th1 cells from TRIM28ΔHP1box/−, HP1α−/−, and HP1β−/−/γ−/−or littermate control mice. (B)
Quanti-fication of the extracellular acidiQuanti-fication rate (ECAR) of CD4+T cells from HP1α−/−and HP1β−/−/γ−/−or littermate control T cells activated for 24 h using
αCD3/αCD28 as measured by the Seahorse XFe96 Analyzer. The bars or dots indicate mean + SEM. Data are from at least 4 independent experiments. (C)
mRNA quantification using NanoString probes and RNA isolated from naive CD4+T cells from TRIM28ΔHP1box/−, TRIM28wt/−, or WT mice. (D) mRNA
quantification using qPCR and RNA isolated from naive CD4+T cells from HP1α−/−and HP1β−/−/γ−/−or littermate control mice. Data are from 2
in-dependent experiments. (E ) Weight of Rag2−/−mice reconstituted with BM from TRIM28ΔHP1box/−, HP1β−/−/γ−/−, or littermate control mice 6 wk after
reconstitution. The dots represent individual mice. (F ) Percentage of Tregs among CD4+T cells from BM chimeras from E. (A, C, and E ) Data are from
at least 2 independent experiments. Two-way ANOVA (A and B, kinetics) or Student’s t test (B, average; C, D, E, and F) was used to test for
Austauschdienst). S.A. received funding from the following: the Institute Curie;
INSERM; CNRS; Agence Nationale de la Recherche (ANR)“ChromaTin”
ANR-10-BLAN-1326-03; la Ligue contre le Cancer (Equipe Labellisée Ligue, EL2014.LNCC/ SA); Association de Recherche contre le Cancer (ARC); the European Research Council (2013-AdG 340046 DCBIOX), INCA PLBIO13-057; ANR-11-LABX-0043 and ANR-10-IDEX-0001-02 Paris Sciences et Lettres (PSL); and ANR-16-CE15001801 and ANR-16-CE18002003. F.C. is supported by Institut National
du Cancer (INCa) Grant PLBIO13-146. O.J. is funded by ANR“EpiTreg”
(ANR-14-CE14-0021-01). M.B. and G.S. are supported by an ARC postdoctoral fellow-ship. High-throughput sequencing has been performed by Institut Curie Geno-mics of Excellence Next-Generation Sequencing platform of Institut Curie
supported by Grants ANR-10-EQPX-03 (Equipex) and ANR-10-INBS-09-08 (France
Génomique Consortium) from the ANR (“Investissements d’Avenir” program),
and by the Canceropole Ile-de-France. The Nanostring platform of Institut Curie was initiated with the support of French grants (Laboratory of Excellence [LabEx] and Equipment of Excellence): ANR-10-IDEX-0001-02 PSL,
ANR-11-LBX-0044, and“INCa-DGOS- 4654” SIRIC11-002. We acknowledge Plateforme
d’Imagerie Cellulaire et Tissulaire de l’Institut Curie–Infrastructures Biologie
Santé et Agronomie, member of the France-BioImaging national research in-frastructure, supported by the CelTisPhyBio LabEx (ANR-10-LBX-0038) part of the Initiative of Excellence (IDEX) PSL (ANR-10-IDEX-0001-02 PSL). G.K. was supported by ANR, INCa, LabEx Immuno-Oncology, and Ligue contre le Cancer.
1. E. L. Pearce, E. J. Pearce, Metabolic pathways in immune cell activation and quies-cence. Immunity 38, 633–643 (2013).
2. H. Zeng et al., mTORC1 couples immune signals and metabolic programming to es-tablish Treg-cell function. Nature 499, 485–490 (2013).
3. G. Wei et al., Global mapping of H3K4me3 and H3K27me3 reveals specificity and plasticity in lineage fate determination of differentiating CD4+T cells. Immunity 30, 155–167 (2009).
4. M. Koyanagi et al., EZH2 and histone 3 trimethyl lysine 27 associated with Il4 and Il13 gene silencing in Th1 cells. J. Biol. Chem. 280, 31470–31477 (2005).
5. M. Kimura et al., Regulation of Th2 cell differentiation by mel-18, a mammalian polycomb group gene. Immunity 15, 275–287 (2001).
6. A. Onodera et al., STAT6-mediated displacement of polycomb by trithorax complex establishes long-term maintenance of GATA3 expression in T helper type 2 cells. J. Exp. Med. 207, 2493–2506 (2010).
7. M. Yamashita et al., Crucial role of MLL for the maintenance of memory T helper type 2 cell responses. Immunity 24, 611–622 (2006).
8. J. Huehn, J. K. Polansky, A. Hamann, Epigenetic control of FOXP3 expression: The key to a stable regulatory T-cell lineage? Nat. Rev. Immunol. 9, 83–89 (2009). 9. R. S. Allan et al., An epigenetic silencing pathway controlling T helper 2 cell lineage
commitment. Nature 487, 249–253 (2012).
10. R. F. Ryan et al., KAP-1 corepressor protein interacts and colocalizes with heterochromatic and euchromatic HP1 proteins: A potential role for Krüppel-associated box-zinc finger proteins in heterochromatin-mediated gene silencing. Mol. Cell. Biol. 19, 4366–4378 (1999).
11. S. Iyengar, P. J. Farnham, KAP1 protein: An enigmatic master regulator of the ge-nome. J. Biol. Chem. 286, 26267–26276 (2011).
12. M. K. Ayrapetov, O. Gursoy-Yuzugullu, C. Xu, Y. Xu, B. D. Price, DNA double-strand breaks promote methylation of histone H3 on lysine 9 and transient formation of repressive chromatin. Proc. Natl. Acad. Sci. U.S.A. 111, 9169–9174 (2014). 13. B. Mateescu, B. Bourachot, C. Rachez, V. Ogryzko, C. Muchardt, Regulation of an
inducible promoter by an HP1beta-HP1gamma switch. EMBO Rep. 9, 267–272 (2008). 14. S. H. Kwon et al., Heterochromatin protein 1 (HP1) connects the FACT histone chaperone complex to the phosphorylated CTD of RNA polymerase II. Genes Dev. 24, 2133–2145 (2010).
15. H. Bunch et al., TRIM28 regulates RNA polymerase II promoter-proximal pausing and pause release. Nat. Struct. Mol. Biol. 21, 876–883 (2014).
16. X. F. Zhou et al., TRIM28 mediates chromatin modifications at the TCRα enhancer and regulates the development of T and natural killer T cells. Proc. Natl. Acad. Sci. U.S.A. 109, 20083–20088 (2012).
17. F. R. Santoni de Sio et al., KAP1 regulates gene networks controlling T-cell develop-ment and responsiveness. FASEB J. 26, 4561–4575 (2012).
18. S. Chikuma, N. Suita, I. M. Okazaki, S. Shibayama, T. Honjo, TRIM28 prevents auto-inflammatory T cell development in vivo. Nat. Immunol. 13, 596–603 (2012). 19. B. Cheng, X. Ren, T. K. Kerppola, KAP1 represses differentiation-inducible genes in
embryonic stem cells through cooperative binding with PRC1 and derepresses pluripotency-associated genes. Mol. Cell. Biol. 34, 2075–2091 (2014).
20. F. Powrie et al., Inhibition of Th1 responses prevents inflammatory bowel disease in scid mice reconstituted with CD45RBhiCD4+T cells. Immunity 1, 553–562 (1994). 21. H. Zeng, H. Chi, mTOR signaling in the differentiation and function of regulatory and
effector T cells. Curr. Opin. Immunol. 46, 103–111 (2017).
22. K. A. Frauwirth et al., The CD28 signaling pathway regulates glucose metabolism. Immunity 16, 769–777 (2002).
23. A. Zanin-Zhorov et al., Protein kinase C-theta mediates negative feedback on regu-latory T cell function. Science 328, 372–376 (2010).
24. J. C. Rice, C. D. Allis, Histone methylation versus histone acetylation: New insights into epigenetic regulation. Curr. Opin. Cell Biol. 13, 263–273 (2001).
25. Y. M. Kerdiles et al., Foxo transcription factors control regulatory T cell development and function. Immunity 33, 890–904 (2010). Erratum in: Immunity 34, 135 (2011). 26. W. Ouyang, O. Beckett, R. A. Flavell, M. O. Li, An essential role of the Forkhead-box
transcription factor Foxo1 in control of T cell homeostasis and tolerance. Immunity 30, 358–371 (2009).
27. R. H. Newton et al., Maintenance of CD4 T cell fitness through regulation of Foxo1. Nat. Immunol. 19, 838–848 (2018).
28. W. Ouyang et al., Foxo proteins cooperatively control the differentiation of Foxp3+ regulatory T cells. Nat. Immunol. 11, 618–627 (2010).
29. W. Fu et al., A multiply redundant genetic switch“locks in” the transcriptional sig-nature of regulatory T cells. Nat. Immunol. 13, 972–980 (2012).
30. G. M. Delgoffe et al., Stability and function of regulatory T cells is maintained by a neuropilin-1-semaphorin-4a axis. Nature 501, 252–256 (2013).
31. E. K. Brinkman, T. Chen, M. Amendola, B. van Steensel, Easy quantitative assessment of genome editing by sequence trace decomposition. Nucleic Acids Res. 42, e168 (2014).
32. F. Cammas, M. Herzog, T. Lerouge, P. Chambon, R. Losson, Association of the tran-scriptional corepressor TIF1beta with heterochromatin protein 1 (HP1): An essential role for progression through differentiation. Genes Dev. 18, 2147–2160 (2004). 33. D. C. Schultz, K. Ayyanathan, D. Negorev, G. G. Maul, F. J. Rauscher, 3rd, SETDB1: A
novel KAP-1-associated histone H3, lysine 9-specific methyltransferase that contrib-utes to HP1-mediated silencing of euchromatic genes by KRAB zinc-finger proteins. Genes Dev. 16, 919–932 (2002).
34. A. J. Bannister et al., Selective recognition of methylated lysine 9 on histone H3 by the HP1 chromo domain. Nature 410, 120–124 (2001).
35. M. Lachner, D. O’Carroll, S. Rea, K. Mechtler, T. Jenuwein, Methylation of histone H3 lysine 9 creates a binding site for HP1 proteins. Nature 410, 116–120 (2001). 36. V. A. Gerriets et al., Foxp3 and Toll-like receptor signaling balance Tregcell anabolic
metabolism for suppression. Nat. Immunol. 17, 1459–1466 (2016).
37. S. Rajagopalan, E. O. Long, Cellular senescence induced by CD158d reprograms nat-ural killer cells to promote vascular remodeling. Proc. Natl. Acad. Sci. U.S.A. 109, 20596–20601 (2012).
38. S. H. Ross et al., Phosphoproteomic analyses of interleukin 2 signaling reveal in-tegrated JAK kinase-dependent and -independent networks in CD8+T cells. Immunity 45, 685–700 (2016).
39. R. Tian et al., Combinatorial proteomic analysis of intercellular signaling applied to the CD28 T-cell costimulatory receptor. Proc. Natl. Acad. Sci. U.S.A. 112, E1594–E1603 (2015).
40. S. Sauer et al., T cell receptor signaling controls Foxp3 expression via PI3K, Akt, and mTOR. Proc. Natl. Acad. Sci. U.S.A. 105, 7797–7802 (2008).
41. U. Gehrmann et al., Synergistic induction of adaptive antitumor immunity by codelivery of antigen withα-galactosylceramide on exosomes. Cancer Res. 73, 3865–3876 (2013). 42. S. Tanaka et al., The enhancer HS2 critically regulates GATA-3-mediated Il4
tran-scription in TH2 cells. Nat. Immunol. 12, 77–85 (2011).
43. X. Wang et al., Transcription of Il17 and Il17f is controlled by conserved noncoding sequence 2. Immunity 36, 23–31 (2012).
44. A. Seki, S. Rutz, Optimized RNP transfection for highly efficient CRISPR/Cas9-mediated gene knockout in primary T cells. J. Exp. Med. 215, 985–997 (2018).
45. Y. Singh, O. A. Garden, F. Lang, B. S. Cobb, Retroviral transduction of helper T cells as a genetic approach to study mechanisms controlling their differentiation and func-tion. J. Vis. Exp. 2016, 54698 (2016).
IMM
UNOLOGY
AND
INFLAM