CONJUGATED POLYMERS AND DESIGNED INTERFACES: CONFORMATIONAL ANALYSIS AND APPLICATIONS
by Byungjin Koo
B.S., Materials Science and Engineering, summa cum laude Seoul National University, 2012
Submitted to the Department of Materials Science and Engineering in Partial Fulfillment of the Requirements for the Degree of
DOCTOR OF PHILOSOPHY IN MATERIALS SCIENCE AND ENGINEERING at the
MASSACHUSETTS INSTITUTE OF TECHNOLOGY June 2017
© 2017 Massachusetts Institute of Technology. All Rights Reserved.
Signature of Author: ____________________________________________________________ Department of Materials Science and Engineering
May 10, 2017
Certified by: ___________________________________________________________________ Timothy M. Swager John D. MacArthur Professor of Chemistry Thesis Supervisor Certified by: ___________________________________________________________________
Michael F. Rubner TDK Professor of Polymer Materials Science and Engineering Thesis Reader Accepted by: __________________________________________________________________
Donald R. Sadoway John F. Elliott Professor of Materials Chemistry Chairman, Departmental Committee on Graduate Studies
Dedicated to My Loving Family: Kyungsool, Chaesoon, and Hyunjoo
CONJUGATED POLYMERS AND DESIGNED INTERFACES: CONFORMATIONAL ANALYSIS AND APPLICATIONS
by Byungjin Koo
Submitted to the Department of Materials Science and Engineering on May 10, 2017 in Partial Fulfillment of the Requirements for the Degree of
Doctor of Philosophy in Materials Science and Engineering
ABSTRACT
The conformations of conjugated polymers can be altered by nearby environments. The intrapolymer conformation and interpolymer assemblies have a crucial impact on a variety of properties such as absorption, energy migration, and fluorescence. In this dissertation, the conformational changes and their effects on photophysics in different environments will be discussed. In Chapter 1, the basic principles to understand this thesis will be reviewed, including the processes of absorption and emission, exciton migration, the Langmuir–Blodgett technique, and interfacial phenomena. In Chapter 2, the conformational control and alignment of conjugated polymers at the air–water interface and how this alignment of polymers can lead to new emissive aggregates will be presented. The emission has the characteristics of excimers with the improved fluorescence quantum yields. The transfer of the aligned aggregates to glass substrates is attempted and these excimer films undergo reorganization upon exposure to solvent vapors, which triggers the fluorescence color change from yellow to cyan, leading to fluorescence-based chemical sensors. In Chapter 3, exciton migration to low-energy emissive traps at amphiphilic interfaces will be discussed. This chapter will deliver the design of interfaces and how the exciton migration can occur at the air–water interface and the hydrocarbon–water interface in lyotropic liquid crystals. To expand this interfacial exciton migration to more generalizable interfaces, Chapter 4 will show the fabrication of oil-in-water emulsions and how exciton migration in oil-in-water emulsion can produce distinct fluorescences between solution and interfaces. Chapter 5 will discuss the structural variations of novel functional conjugated polymers and how substituents can change the conformation of the polymer backbones. Additionally, how this conformational change affects the electronic and optical properties of polymers will be examined.
Thesis Supervisor: Timothy M. Swager
Table of Contents
Title Page ...1 Dedication ...3 Abstract ...5 Table of Contents ...7 List of Figures ...10 List of Schemes ...15 List of Tables ...16Chapter 1: Introduction and Backgrounds ...17
1.1 Photophysics of π-Conjugated Polymers and Conformational Analysis ...18
1.2 Poly(Phenylene Ethynylene)s ...23
1.3 Energy Transfer ...26
1.4 Phenomena at Interfaces ...28
1.5 Objectives ...32
1.6 References ...32
Chapter 2: Conformational Control and Supramolecular Assemblies of Conjugated Polymers for Emissive Excimers and Chemical Sensors...37
2.1 Introduction ...38
2.2 Results and Discussion ...40
2.3 Conclusions ...49
2.4 Experimental Details ...49
2.4.1 General ...49
2.4.2 Polymerization Procedure for P1 ...51
2.5 References ...52
2.6 Appendix for Chapter 2 ...55
Chapter 3: Exciton Migration of Conjugated Polymers: Dual-Fluorescence at Water Interfaces ...57
3.2 Results and Discussion ...60
3.2.1 Synthesis of P1 ...60
3.2.2 Pressure-Area Isotherms and Photophysics ...64
3.2.3 Exciton Migration in Lyotropic Liquid Crystals (LLCs) ...66
3.2.4 Mechanism Studies on Exciton Migration ...68
3.3 Conclusions ...71 3.4 Experimental Details ...71 3.4.1 General ...71 3.4.2 Polymerization for P1 ...73 3.4.3 Synthesis of Perylene-1 ...75 3.5 References ...78
3.6 Appendix for Chapter 3 ...80
Chapter 4: Oil-in-Water Emulsions Stabilized by Conjugated Polymers ...86
4.1 Introduction ...87
4.2 Results and Discussion ...88
4.2.1 Structure Optimizations ...88 4.2.2 Fabrication of Emulsions ...91 4.3 Conclusions ...95 4.4 Experimental Details ...95 4.4.1 General ...95 4.4.2 Synthesis of Monomers...97 4.4.3 Polymerizations...98 4.5 References ...100
4.6 Appendix for Chapter 4 ...102
Chapter 5: Chemistry of Poly(3-hexylthiophene)s: 4-Position Functionalizations for Conformational Studies and New Functional Materials ...108
5.1 Introduction ...109
5.2 Results and Discussion ...111
5.2.1 Formation of Poly(3-Hexyl-4-Thienyllithium)s ...111
5.2.3 Conformational Studies of P3HT: The Effects of 4-Position Sizes ...117
5.2.4 Azide-Alkyne Click Reactions on Azido-P3HT ...120
5.3 Conclusions ...121
5.4 Experimental Details ...122
5.4.1 General ...122
5.4.2 Synthetic Procedures for Polymers ...123
5.5 References ...132
5.6 Appendix for Chapter 5 ...136
List of Figures
Figure 1.1. Absorption and fluorescence with different vibrational transitions ...18 Figure 1.2. Potential energy curves where (a) ground-state and excited-state geometries are similar
and (b) excited-state geometry is different from the ground-state geometry and thus horizontally shifted. The most probable Franck–Condon transition is (a) 0–0 and (b) 0–n (here 0–2). Expected absorption spectra are shown in the bottom. Fluorescence curves are expected to be mirror images of absorption spectra ...20
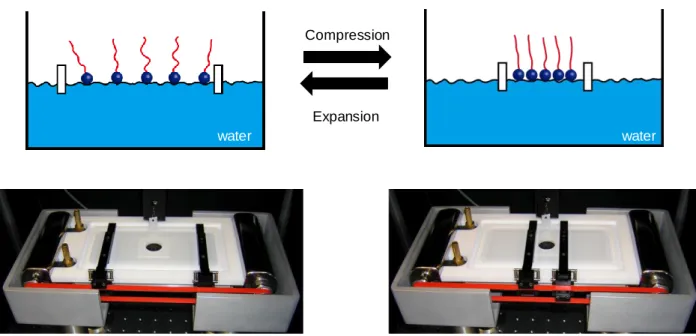
Figure 1.3. Schematic representation and pictures of the Langmuir–Blodgett instrument.
Surfactants can be deposited on top of water and their intermolecular distance can be altered by compression and expansion of the two bars. ...23
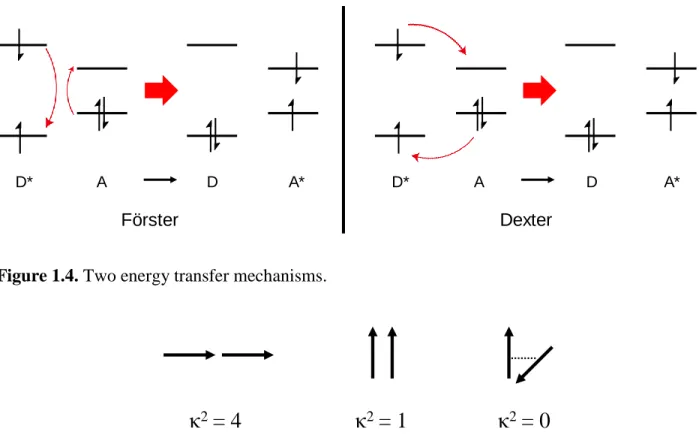
Figure 1.4. Two energy transfer mechanisms ...27 Figure 1.5. Examples of the orientation factor in Förster energy transfer. A head-to-tail type
alignment (left) shows the highest orientation value, whereas an orthogonal alignment (right) produces the zero value ...27
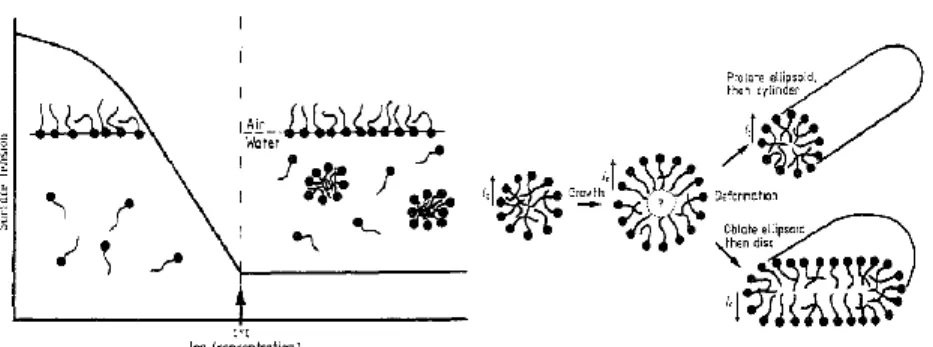
Figure 1.6. Example of pressure–area isotherm. The numbers on x- and y-axis are arbitrary but
represent the order-of-magnitude in ordinary measurements ...29
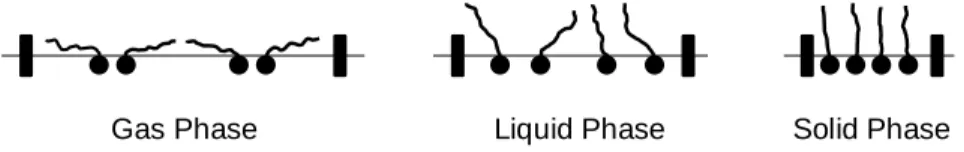
Figure 1.7. Conformation of surfactants in each phase in Langmuir monolayers ...30 Figure 1.8. Schematic of micellization processes (Reference 35) ...31
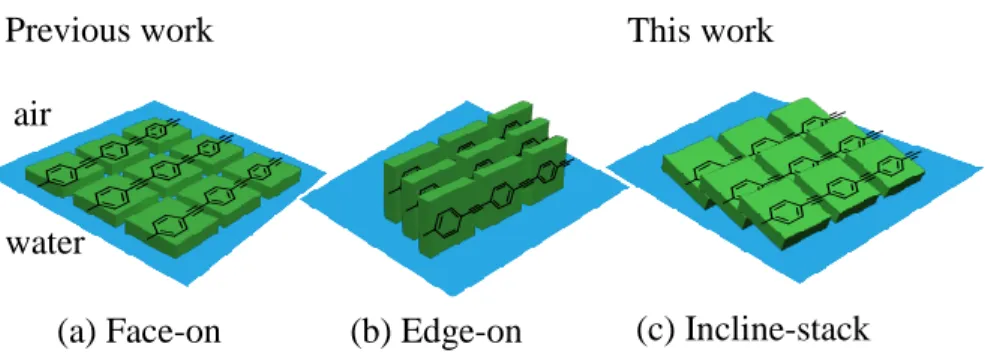
Figure 2.1. Polymer conformations at the air-water interfaces. Planes of phenyl repeat units are
(a) parallel (face-on) and (b) perpendicular (edge-on) to the surface of water, respectively, reported in the literature. (c) Incline-stack is proposed in this work where the face of phenyl is inclined and stacked to form bright excimers ...39
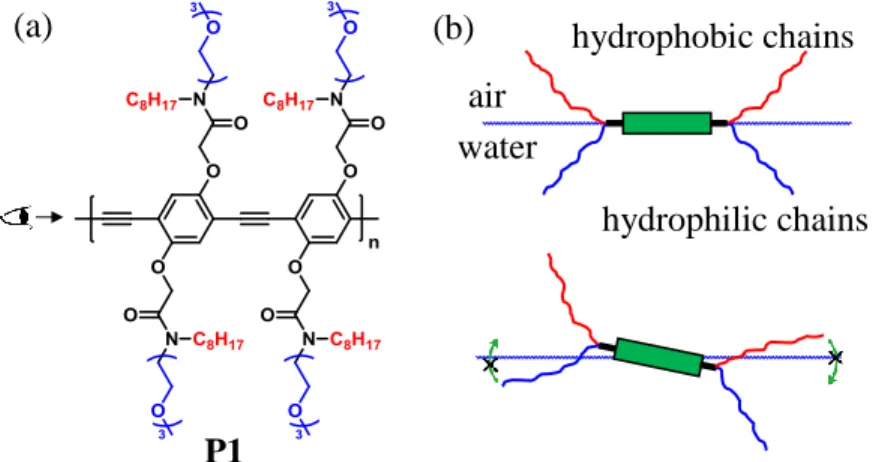
Figure 2.2. (a) The structure of the polymer P1 (33 kDa, Đ 1.40) with amphiphilic side chains
functionalized in a symmetric fashion. (b) The possible conformation depending on the presence of the external surface pressure. The green rectangle is a phenylethynylene repeat unit seen from the end of the axis of the backbone. With surface pressures less than 25 mN/m (top), a face-on structure is present. At higher surface pressures (bottom), the strong anchoring of side chains to the water prevents the perpendicular orientation of the backbone and result in the proposed incline-stack conformation ...40
Figure 2.3. Pressure-area isotherm of P1 with the small amount of sample loading to observe the
onset point. The isotherm with the higher amount of sample loading is shown in Figure 2.4d ....41
Figure 2.4. (a) Compression-induced bright yellow excimers of P1. Pictures are taken under 365
nm hand-held UV lamp from the fixed position. The areas upon expansion (top) and compression (bottom) are ca. 77 cm2 (11 × 7 cm) and 18 cm2 (2.6 × 7 cm), respectively. (b) In situ absorption spectra depending on the surface pressure. Increased planarization is observed from 27 mN/m to
37 mN/m with a new peak around 480 nm. All spectra (except multilayer at 43 mN/m) shows identical shape with the increased absorbance as a result of the decreased surface area. (c) In situ PL spectra recorded depending on the applied surface pressure with excitation at 435 nm. Broad, structureless, red-shifted emission bands from 475–650 nm are the characteristics of excimers. Relative quantum yields are shown in the parenthesis. The inset is the modified spectra calculated based on the same absorption at 435 nm in each surface pressure. (d) Pressure-area isotherm of the P1 monolayer. Here the repeat unit on the x-axis is considered as one phenylene ethynylene unit. The inflection point at 25 mN/m is the point where the transition of the conformation from face-on to incline-stack occurs. Another transitiface-on observed at ca. 38 mN/m exhibits the multilayer formation ...42
Figure 2.5. Spectra of solution and thin films of P1 that do not display emissive excimers.
Absorption (solid) and emission (dotted) spectra in solution (black) and thin films (red) are obtained. Thin films show no excimeric emission...43
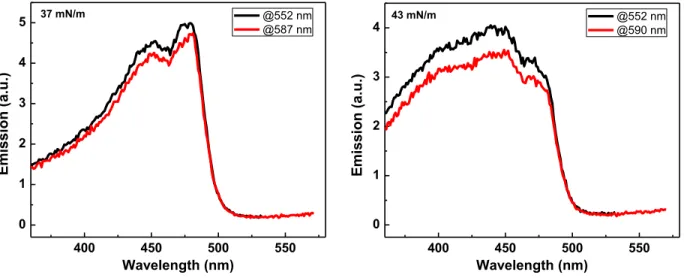
Figure 2.6. Excitation spectra at 37 mN/m (left) and 43 nm (right) of the P1 monolayer at the
air-water interface ...43
Figure 2.7. The pressure-area isotherms of the first three cycles for mechanical annealing,
supplemental to Figure 2.4d. The consistent shapes indicate the reversible and reproducible formation of incline-stack conformation. The first cycle is slightly off from the equilibrium, implying that the mechanical annealing indeed helps the polymers pack each other after one compression-expansion cycle ...45
Figure 2.8. Emission spectra (left) of solution aggregates of P1 that do not display emissive
excimers. Aggregate dispersions by adding a poor solvent (hexane) are generated. The increased amount of hexane triggers the self-quenching as a result of cofacial ground-state aggregates (see absorption spectra (right)). The enlarged spectra in inset confirm the absence of excimers. Absorption spectra (right) of solution aggregates of P1 in varying ratio of hexane to chloroform ...45
Figure 2.9. A hetero-type PPE, P2, showing the absence of excimer formation. (a) The structure
of P2 (23 kDa, Đ 1.51) where bis(N,N-dioctylamide)benzene in blue is introduced as a co-monomer. (b) The in situ emission spectra of P2 at the air-water interface. No excimer emission was observed ...46
Figure 2.10. Pressure-area isotherm of hetero-type PPE (P2). The repeat unit on the x-axis
contains two phenylene ethynylenes ...47
Figure 2.11. Transfer of the compressed multilayer onto the glass substrate using
Langmuir-Blodgett method and solvent vapor detection. (a) Absorption (solid) and emission spectra (dotted) of the transferred P1 films and before (black) and after (red) exposure to chloroform. The inset picture is the film under 365 nm irradiation. (b) Solvent vapor sensing is demonstrated wherein good solvents (chloroform, methanol, acetone, and THF) induce the reorganization of the aligned polymers, reverting to cyan emission in a few seconds. In contrast, prolonged exposure to poor solvents (hexane and water) produces no response ...47
Figure 2.12. Excimer films that are exposed to different solvent vapors. Overall, they are
responsive to good solvents (chloroform, methanol, THF, and acetone) and not responsive to poor solvents (hexane and water) ...48
Figure 3.1. Schematic illustration of enhanced energy transfer to red end-caps in conjugated
polymers upon applied surface pressure (top). The structure of the PPE P1 (bottom) ...60
Figure 3.2. (a) Synthesis of P1 using M1 and M2 (5% excess) with sequential in situ endgroup
functionalization. Yield 71%, Mn = 27 kDa, and Đ 1.38. (b) Absorption and emission spectra of
P1 in solution (top) and spin-coated films (bottom) ...61 Figure 3.3. Partial NMR spectrum of P1. Full spectrum is shown in the Chapter 3.6 ...62 Figure 3.4. (a) Different polymerization conditions to optimize the extent of end-group
incorporation. (b) NMR spectrum from condition 2. (c) NMR spectrum from condition 3. We attempted different polymerization conditions to optimize the extent of end-group (Perylene-1) incorporation. The condition 1 is described in Figure 3.2, synthesizing P1. In condition 2 and 3, we shortened the polymerization time before adding Perylene-1. In the “End-group Added (%)” column, the stoichiometric amount (abbreviated as stoic.) means the mol% of Perylene-1 needed by considering the theoretical degree of polymerization (DP). 15 mol% in Condition 1 therefore means that 1.5 times more of Perylene-1 was added. In all conditions, the excess amounts of endgroups are added. The end-groups per chain are indicated in the last column. The NMR spectra of the polymers synthesized from the condition 2 and 3 are shown in (b) and (c), respectively ...63
Figure 3.5. (a) Pressure-area isotherm of P1. The extrapolated area per one Ph-CC unit is ca. 150
Å2, indicative of face-on conformation below 25 mN/m. The inflection point at 25 mN/m (the arrow in inset) indicates the transition from face-on to incline-stack conformation. (b) In situ absorption spectra of P1. A new peak (planarization) at 477 nm is observed above 25 mN/m. (c) In situ emission spectra (raw data) of P1 and (d) its normalized spectra. The varying relative intensity of backbone to perylene depending on the surface pressure suggests P1 as an interfacial pressure indicator ...65
Figure 3.6. (a) Schemes of energy transfer in aqueous solution. More polymers are localized at
the micelle-water interface with the increased P1 concentration, resulting in enhanced energy transfer to perylene. (b) Absorption and (c: normalized; d: raw) emission spectra of LLCs with different concentrations of P1. Planarization of the polymers at the micelle-water interface results in the red-shifted sharp absorption shapes with clear vibronic transitions. Owing to energy transfer, the relative perylene emission is enhanced. (e) The LLC solutions are transparent (left) and their fluorescence is highly emissive with varying colors (right). ...67
Figure 3.7. Images of lyotropic liquid crystals under an optical microscope with cross-polarizers
...68
Figure 3.8. (a) The experimental design to distinguish intra- and interchain energy transfer. The
number of the perylene end-caps is systematically varied; for example, the left and right schemes exhibit the monolayers composed only from P1 (black curve in Figure 3.8b) and from P1 : P2 = 1
: 1 (blue curve in Figure 3.8b), respectively. (b) Comparison of emission spectra at 15 mN/m. Overall, the decrease in the number of end-groups shows the lower end-group emission, indicative of efficient intrachain and relatively inefficient interchain energy transfer ...69
Figure 4.1. Schematics of exciton migration upon the formation of emulsions. In water (left), P1
shows cyan fluorescence. At oil–water interfaces, P1 shows red fluorescence owing to enhanced exciton migration to perylene endgroups ...88
Figure 4.2. Absorption and emission spectra in water (left) and thin films (right). The absorption
spectra are similar each other, whereas the emission spectra exhibit either backbone (solution) or end-group fluorescence (thin films) as a result of the exciton migration in the solid state ...91
Figure 4.3. (a) Pictures of emulsions. To P1 in water (left), heptane (top right) and benzyl benzoate
(top bottom) are added and then vortexed. (b) Emission spectra of heptane-in-water (black) and BB-in-water (red) emulsions. Increased red emissions are observed in both cases after adding oil phases ...92
Figure 4.4. Confocal laser scanning microscopy images. (a-c) Heptane-in-water emulsions. Scale
bar: 50 μm. Emission channels from (a) mixed (b) green and (c) red. (d-f) Benzyl benzoate-in-water emul-sions. Scale bar: 100μm. Emission channels from (d) mixed (e) green and (f) red. Excitation laser at 458 nm. Green emission (471–511 nm) and red emission (579–621 nm) ...93
Figure 4.5. Confocal laser scanning microscopy images with higher concentration of P1 in water
(100 μg/mL). (a-c) Heptane-in-water emulsions. Scale bar: 50 μm. Emission channels from (a) mixed (b) green and (c) red. (d-f) Benzyl benzoate-in-water emulsions. Scale bar: 50 μm. Emission channels from (d) mixed (e) green and (f) red. Excitation laser at 458 nm. Green emission (471– 511 nm) and red emission (579–621 nm) ...94
Figure 5.1. 1H NMR spectra of the polymers: (a) P3HT, (b) 1 (Br-P3HT), (c) 3c, and (d) 4. The sharp peak at 6.98 ppm from 4-position proton (●) enables the estimation of the Li-Br exchange by comparison to the peak at 2.81 ppm from α–methylene (■) of the hexyl chain. For detailed integration values and peak locations, please refer to the Chapter 5.6 Appendix. ...113
Figure 5.2. Control experiments with n-butyl bromide. (a) Reaction scheme. n-butyl bromide is
added after Li-Br has occurred and before quenching with methanol. (b, c) Two NMR spectra obtained from two independent experiments ...115
Figure 5.3. (a) Synthesis of F-P3HT (16). NFSI = N-fluorobenzenesulfonimide. (b) Absorption
(solid line) and photoluminescence (dotted line) spectra of P3HT (black), F-P3HT (red), and Br-P3HT (blue) in CHCl3. Excitation at 400 nm (Br-P3HT), 380 nm (F-Br-P3HT), and 330 nm (Br-Br-P3HT). (c) Absorption spectra of thin films of each polymer. The films are fabricated on glass by spin-coating each polymer from a chlorobenzene solution. (d) Electronic properties of P3HT, F-P3HT, and Br-P3HT obtained from photophysics and cyclic voltammetry measurements. *Optical bandgap (Bg) was measured by onset (drawing a tangent line) of the absorption spectra in thin film.
**HOMO = e(−Epolymeronset,oxidation+ EFconset,oxidation− 4.8 V). *** LUMO = HOMO + Bg. (e) Cyclic voltammetry curves of P3HT (black), F-P3HT (red), Br-P3HT (blue), ferrocene (light green), and blank measured on bare ITO (light blue) ...119
Figure 5.4. (a) Click reactions with azido-P3HT (17) in the Cu-catalyzed (18) and strain-promoted
Cu-free (19) conditions. (b) Comparison of IR of 17 (black), 18 (red), and 19 (blue). 17 was made from HCl quenching and resulted in a strong azide peak at 2105 cm-1. Quenching with AcOH produced the same azide peak. In both 18 and 19, complete disappearance of the azide peak was observed ...120
List of Schemes
Scheme 1.1. Retrosynthetic analysis of PPEs ...24
Scheme 1.2. Catalytic cycle of the Sonogashira cross-coupling reaction ...24
Scheme 1.3. Excited-state structure of the PPE repeat unit ...25
Scheme 1.4. Conformation of PPEs. The rotational barrier of the red bond is low (< 1 kcal/mol), suggesting that they could be responsive to environmental stimuli ...25
Scheme 2.1. Polymerization for P1 ...52
Scheme 3.1. Polymerization procedure for P1 ...73
Scheme 3.2. Synthetic procedures for Perynene-1 ...74
Scheme 4.1. Structures of endcapped surfactant-type PPE P1 (moderately water-soluble), P2 (highly water-soluble) and P3 (non water-soluble) ...90
Scheme 4.2. Polymerization for P1. 1.05 equiv of M2 is used to make Ar-Pd-I endgroups after polymerization, which further react in situ with acetylene-terminal perylene ...91
Scheme 5.1. Post-polymerization modification via Li-Br exchange and subsequent quenching with functional electrophiles ...111
Scheme 5.2. Analysis of the lithium-bromine exchange ...112
Scheme 5.3. The scope of this methodology: ketone (5–11), secondary alcohol (12–14), TMS (15), F (16), and azide (17) functionalized P3HTs ...117
List of Tables
Table 5.1. Relationship between equivalents of n-BuLi and degree of lithium-bromine exchange.
NMR indicates conversions determined by 1H NMR integration, and EA indicates conversions determined by elemental analysis ...113
Chapter 1
Introduction and Backgrounds
Abstract: This chapter will describe the concepts of photophysics, the chemistry and properties
of poly(phenylene ethynylene)s (PPEs), energy transfer, and interfacial phenomena, all of which are central to understand this dissertation. Photophysics (absorption and emission) is an essential optical method to analyze the conformation and aggregation states of conjugated polymers. Fundamentals of vibrational transitions along with the Franck–Condon principles will be reviewed, which determines the shapes of absorption and emission spectra. The synthesis of PPEs with Sonogashira cross-couplings will be discussed. Exciton migration, a central topic of this dissertation, will be dealt based on the fundamental mechanisms, Förster and Dexter energy transfer. In the section of interfacial phenomena, pressure–area isotherms, micellization, and emulsion fabrication will be discussed.
1.1 Photophysics of π-Conjugated Polymers and Conformational Analysis
Photophysics deals with the interaction between light and matter (a molecule) with no structural change of a molecule, as opposed to photochemistry which results in the change of a chemical structure.1 Photophysics commonly refers to the process of absorption and emission of light in a molecule. The absorption of light causes an electron to be excited, called excitation where an electron is transferred from its ground-state (low-energy) to excited-state (high-energy). This process can be described in the following equation.
A + hν → A*
where A and A* represent a molecule in a ground-state and an excited-state, respectively. Figure 1.1 shows the singlet ground state (S0) and singlet first-excited state (S1) with the vibrational energy levels ν, assuming there are only three vibrational states. The excitation of an electron starts from the S0 (ν = 0), and the transitions from S0 (ν = 0) to different vibrational states in S1 (ν = 0, 1, 2) are possible. These transitions are indicated as 0–0, 0–1, 0–2 absorption transitions, respectively (Figure 1.1). 0-0 0-1 0-2 Absorption Fluorescence
S
0S
1 ν = 0 ν = 1 ν = 2 ν = 0 ν = 1 ν = 2 0-2 0-1 0-0The probability of relative vibrational transitions are determined by the Franck–Condon principle. The principle states that during the radiative transition of an electron, nuclei do not change their positions and geometry. From the classical mechanics point of view, nuclei are much heavier than electrons, so the nucleus vibrations take 10–13 – 10–14 s, whereas the electron vibrations take 10–15 – 10–16 s. That is, at an instant time, excitation is only seen from electron, while nuclei are stationary. Quantum mechanically, the principle states that the most probable transition takes place between the closely resembling wave functions of the initial and final vibrational states.2 When the potential energy curve of the exited-state is vertically placed from the one of the ground-state (Figure 1.2a), 0–0 transition is the Franck–Condon-allowed transition, whereas 0–2 transition is weak. The Franck–Condon principle states that the position of the potential curve cannot be moved horizontally since the nuclei are stationary during the transition. In the case where the excited-state structure is significantly different from the ground-state (Figure 1.2b), the potential energy curve of the excited-state is moved horizontally, meaning that from the diagram of Figure 1.2b, the most probable transition is 0–2, and the least is 0–0. In both cases, the expected absorption spectra are shown in Figure 1.2. The emission spectra are mirror images each other since once again, from the result of the Franck–Condon principle, if the 0–0 absorption is most probable, so is the 0–0 emission. So far, it is assumed the emission begins from the lowest excited-state (S1, ν = 0). This is generally true because the electron in the higher vibrational energies undergoes fast relaxation to the lowest excited-state energy level (ν = 0), following the Kasha’s rule (dotted arrow in Figure 1.1).3 This relaxation is much faster than any other process such as intersystem crossing or fluorescence.
π-Conjugated molecules generally interact with light ranging from untraviolet (UV) and visible to near-infrared (NIR) and therefore have a variety of technological applications such as
solar cells,4,5 luminescence materials,6,7 and fluorescent chemical sensors.8,9 The interaction with UV–NIR range of light takes place because the frontier molecular orbitals (HOMO, highest
Figure 1.2. Potential energy curves where (a) ground-state and excited-state geometries are similar
and (b) excited-state geometry is different from the ground-state geometry and thus horizontally shifted. The most probable Franck–Condon transition is (a) 0–0 and (b) 0–n (here 0–2). Expected absorption spectra are shown in the bottom. Fluorescence curves are expected to be mirror images of absorption spectra.
occupied molecular orbital, and LUMO, lowest unoccupied molecular orbital) of π-conjugated molecules have similar energy levels with UV, visible, and near-infrared light, in contrast to σ-molecular orbitals where the difference between boning and antibonding orbitals are higher as a result of their greater orbital overlap and stabilization compared to π-orbitals.
π-Conjugated polymers are a special type of π-conjugated molecules where (1) polymer backbone should be π-conjugated and (2) molecular weights are typically more than 3,000 Da. Changing chemical structures of polymers, molecular weights, and processing conditions (solution or solid-states) can alter photophysical properties of conjugated polymers. First, the changes of chemical structures include attaching electron-rich or electron-poor functional groups. More electrons that participate in π-conjugation leads to the decrease in HOMO–LUMO gap and red-shift of absorption and emission spectra. Donor–acceptor type conjugated polymers have also been increasingly investigated as low bandgap materials.10-12 Second, molecular weights affect the conjugation length, and generally increasing molecular weights lead to the red-shift of absorption spectra. However, it is known that expanding the molecular weight infinitely does not necessarily result in the infinite red-shift of spectra. Effective conjugation length (ECL) is defined as the minimum length, typically expressed as nECL where n is the repeat unit, of aromatic bonds wherein optical and electronic properties are converged. That means that at a certain length the red-shift of absorption spectra would be saturated. The ECL even exists in a very high molecular weight polymer without any defects13 and was reported in many different types of conjugated polymers including poly(phenylene vinylene)s (nECL = 11),13 poly(phenylene ethynylene)s (nECL = 5),13 poly(p-phenylene)s (nECL = 9),13 polythiophenes (nECL = 1713 or higher14), polypyrroles (nECL = 13),13 polyfluorenes (nECL = 11),15 and pentiptycene-drived oligo(p-phenylene ethynylene)s (nECL = 4.5).16 Computational results also support the concept of ECL and the experimental results.17
Third, processing conditions alter photophysical properties. In solution with a sufficiently diluted concentration, polymers behave individually and possess relatively random conformations, whereas in thin films they are stretched and planarized, leading to the red-shift of optical properties. Interpolymer interactions and aggregations are possible in the solid-state. The absorption spectra in solution are usually broad, whereas the solid-state absorption generally shows more sharp spectra. This is because in solution a variety of random conformations or ensemble absorb all different wavelengths of light, as opposed to solid-state polymers which have limited conformations whose segments absorb narrow range of light.
A 2D plane can serve as the intermediate state between solution and thin films. When polymers are on the plane, if they are far apart, they may exist individually, but if they are close together, they may exist in a collective way. On a 2D plane, they are presumably slightly more stretched than solution because of spatial constraints, but not as much as the solid-state. We can think of a 2D planar interface as a platform to study the conformations and assemblies of conjugated polymers depending on the interpolymer distances, along with any changes in properties such as absorption and fluorescence.
In order to address conformation–photophysics relationships in conjugated polymers, we will utilize the Langmuir–Blodgett method where a planar 2D interface is given. A detailed review on the Langmuir–Blodgett technique was reported,18 and a brief concept will be discussed in this Chapter and Chapter 1.4. Figure 1.3 shows the schematics and pictures of the Langmuir–Blodgett instrument. The instrument is composed of a trough that contains water and two bars that are placed on top of the trough. Two bars serve as compressing and expanding the surfactant monolayers (or multilayer). The aligned monolayers can be transferred to a substrate (either hydrophobic or
hydrophilic). Using this method, highly anisotropic films were previously fabricated for energy transfer studies.19,20
1.2 Poly(Phenylene Ethynylene)s
The most parts of my thesis are mainly using poly(phenylene ethynylene)s (PPEs) (Chapter 2–4), and thus the chemistry and properties of these polymers are introduced in this chapter. The details on PPEs are reviewed in the literature.21 Polythiophenes (Chapter 5) are also utilized for new synthetic methodology and conformational studies, but the introductory statement on polythiophenes will be delivered in Chapter 5.1.
PPEs are synthesized by a Sonogashira cross-coupling reaction (Scheme 1.1) wherein a terminal acetylene and an aryl halide are coupled to form a Csp–Csp2 bond in the presence of palladium (0), copper (I), and a base.22 Palladium (II) can also be used, but should be reduced in
Compression
Expansion
water water
Figure 1.3. Schematic representation and pictures of the Langmuir–Blodgett instrument.
Surfactants can be deposited on top of water and their intermolecular distance can be altered by compression and expansion of the two bars.
the reaction. To make a polymer, diacetylene and dihalide monomers are employed with the reaction temperature around 50–70 °C. Hence, the polymerization is an AA and BB type polycondensation reaction and thus follow step–growth polymerization kinetics. Pd(PPh3)4 (Pd(0)) or Pd(PPh3)2Cl2 (Pd(II)) are commonly used, but the latter one should be reduced to Pd(0) for an oxidative addition reaction. CuI (I) is used for the copper (I) source, and the amine bases such as
Scheme 1.2. Catalytic cycle of the Sonogashira cross-coupling reaction. Scheme 1.1. Retrosynthetic analysis of PPEs.
triethylamine or diisopropylamine are used. The catalytic cycle is shown in Scheme 1.2. The first step is the oxidative addition of aryl halide (aryl iodide or aryl bromide is common) to Pd(0), which is oxidized to Pd(II). Then transmetallation with a Cu(I)-acetylene, which is made from a terminal alkyne, CuI, and a base, takes place, followed by the reductive elimination of Pd(II) to Pd(0), releasing the coupling product.
PPEs are highly fluorescent polymers and have been utilized as fluorescence indicators.8 The fluorescence quantum yields are around 50% in most cases and up to unity.21 The high quantum yields would be related to their highly rigid excited-state structure, which is butatriene-like planar structure (Scheme 1.3).23 This means that in the excited-state electrons undergo less nonradiative pathways such as phonon vibrations. Another factor that makes PPEs as promising fluorescence markers is their signature cyan emission (460 – 480 nm) wherein the lowest perception concentration by human eyes is 0.1 μg/ml CHCl3.23 Therefore, their fluorescence is sensitive to human eyes.
One interesting feature that makes PPEs as sensory materials is that the rotational barrier of Csp–Csp2 between acetylene and phenyl group (red in Scheme 1.4) is weak and thus sensitive to
Scheme 1.4. Conformation of PPEs. The rotational barrier of the red bond is low (< 1
kcal/mol), suggesting that they could be responsive to environmental stimuli.
environmental stimuli. The barrier is less than 1 kcal/mol,24,25 indicating that at room temperature about 20% of the bonds are freely-rotating (consider the Boltzmann factor exp(-E/kT)). Therefore, environmental stimuli could facilitate conformational changes. Since the absorption and emission are dependent on the effective conjugation lengths as discussed in Chapter 1.1, their photophysics can be varied depending on whether they are in a highly stretched conformation (red-shift) or random conformation (blue-shift), which can be triggered from the stimuli. This also changes the exciton migrations to low-energy traps, which will be discussed in the next section.
1.3 Energy Transfer
Energy transfer, or exciton migration, is the diffusion of an exciton (excited electron/hole pair) to low-energy sites. Conjugated polymers undergo facile energy transfer in the presence of low-energy traps.26 Our group has exploited this strategy to produce signal-amplified chemical sensors.27-29 Herein the mechanism of energy transfer will be reviewed and how this can be related to the photophysics of conjugated polymers.
Two mechanisms30 explain energy transfer as shown in Figure 1.4. Förster31 energy transfer takes place between two weakly interacting dipoles, or called a dipole–dipole interaction. This happens through space and thus it is not necessary to have the direct orbital overlap which is significant in the Dexter energy transfer. Furthermore, Förster transfer operates in a relatively long-range (up to 100 Å ). The transfer rate kET is shown as follows.
𝑘𝐸𝑇 =
𝜅2𝐽 × 8.8 × 10−28 𝑚𝑜𝑙 𝑛4𝜏
0𝑅𝐷𝐴6
where n is the refractive index of the medium, τ0 is the donor lifetime, RDA is the distance between the donor and the acceptor, and J is the spectral overlap between the donor emission and the
acceptor absorption. The orientation factor κ is related to the relative orientation of transition dipoles. Figure 1.5 shows the examples of the orientation factor wherein the maximum value is observed in a head-to-tail alignment of the donor and acceptor dipoles.
Dexter energy transfer32 is referred as electron–exchange as shown in Figure 1.4. Direct wavefunction overlap is a necessary condition for the Dexter transfer and therefore the donor and acceptor should be in closer proximity than Förster energy transfer. In this sense, it occurs when dipoles are strongly coupled usually within the distance of 10 Å . The rate of Dexter transfer is shown as follows. 𝑘𝐸𝑇 = 𝐾𝐽 𝐸𝑥𝑝 (2𝑅𝐷𝐴 𝐿 ) Förster Dexter D* A D A* D* A D A*
Figure 1.4. Two energy transfer mechanisms.
κ
2= 4
κ
2= 1
κ
2= 0
Figure 1.5. Examples of the orientation factor in Förster energy transfer. A head-to-tail type
alignment (left) shows the highest orientation value, whereas an orthogonal alignment (right) produces the zero value.
where K is the specific orbital interactions and L is the van der Waals radii between the donor and the acceptor. The exponential relationship between the rate and the distance demonstrates that Dexter energy transfer is indeed highly effective when they are very close each other.
Energy transfer in conjugated polymers is facilitated when the interpolymer distance is small. That means in solution where polymer chain exists individually, energy transfer is not facile. In thin films, however, higher energy transfer to low-energy sites is observed. This may results from the combination of Dexter (improved π-orbital overlap from planarization) and Förster energy transfer. In addition, in the solid-states exciton hoppings can happen through 3-dimension, whereas in solution it could happen along intrapolymer chain (1-dimension), which indicates that the solid-states may provide improved statistical movement of excitons (a shortcut for excitons). It is believed that energy transfer is usually facile in the solid-states, which is an important point to understand the phenomena discussed in this thesis.
1.4 Phenomena at Interfaces
Hydrophobic–hydrophilic interfaces play a pivotal role in many scientific and technological systems such as colloids and membranes. Colloids are metastable dispersion of one phase in a continuous phase and have significance in from medicine and food to petroleum recovery. Membranes are the materials that separate two phases and are central components especially in biology where protein activities and essential cell signaling can occur. From thermodynamic point of view, these interfaces have excess (Gibbs) free energy because two phases with the disparate nature meet each other.33 Surfactants are the surface-active components that stabilize these interfaces. In this Chapter 1.4, three interface systems (air–water interface, micellization, and oil-in-water emulsions) and their preparation, thermodynamics, and applications
are briefly discussed. Surfactant-type conjugated polymers and their applications in these interfaces are the main subjects of the Chapter 2, 3, and 4.
Langmuir–Blodgett provides a 2D planar interface (air–water interface) and the operation principle is introduced in Chapter 1.1 with Figure 1.3. The development and applications of Langmuir–Blodgett was reviewed recently.18 In this chapter, the concept of pressure–area isotherm will be discussed and how that related to the conformation of simple surfactants, which can also be extended to polymer cases. Pressure–area isotherms are recorded during the compression and expansion cycles and exhibit how the effective interfacial tension is varied depending on the intermolecular distances. An example pressure–area isotherm is shown in Figure 1.6. It is often misleading that the y axis indicates the absolute surface tension. However, the values of y-axis are
Figure 1.6. Example of pressure–area isotherm. The numbers on x- and y-axis are arbitrary but
represent the order-of-magnitude in ordinary measurements.
Gas Phase Liquid Phase Solid Phase S u rf a ce P re ssu re ( mN /m) Area/Molecules (Å2) 50 100 10 20 30
obtained by subtracting 72.8 mN/m (surface tension of water) from the absolute surface pressure, which is also given as follows.
absolute surface pressure = 72.8 − y
Therefore, the increase of the y-axis value does not mean that absolute surface tension between water and air is increasing; rather, absolute surface tension is decreasing because the surfactant density is increasing and serves as stronger stabilizing agents. The values of x-axis are calculated by dividing the actual area by the number of molecules added.
Pressure–area isotherms are generally divided three regions for simple surfactant molecules (such as stearic acid), which are a gas phase, a liquid phase, and a solid phase.34 The molecular snapshot in each phase is given in Figure 1.7. In a gaseous phase, the area per molecules is large and the tail of a surfactant does not interact one another, and therefore it has random conformations. Since they do not interact, a two dimensional ideal gas law holds, which is πA = kT where surface pressure (π) is approaching to zero and thus the area (A) becomes infinite. When surfactants are compressed, it enters into a liquid phase. For stearic acids, this transition occurs around 24 Å2.34 The alkyl chain of the surfactant is now interacting and the absolute value of the slope is increased (steeper). Further compression leads to a solid phase (20 Å2 for stearic acid)34 and the tail becomes closely packed and highly anisotropic.
Gas Phase Liquid Phase Solid Phase
Micellization can also provide an interface between hydrocarbon and water. Micelles are a type of surfactant aggregates in water which can be generated above critical micellar concentration (CMC). Figure 1.8 indicates the micellization processes.35 Surface tension becomes decrease as increasing the concentration of surfactants and will be saturated at CMC at which micelles begin to form. Micelles are initially spherical. However, the further addition of surfactants induce the transformation of micelles into rod or disk shapes, and the entire solution becomes anisotropic. This anisotropic solution is called lyotropic liquid crystals (LLCs, and further discussion in Chapter 3) and specific liquid crystalline textures can be observed in an optical microscope equipped with cross polarizers.
Emulsions are dispersion of two (or more) immiscible liquids where one phase is dispersed in a continuous phase in the presence of surfactants. Some review papers on microemulsion and nanoemulsions are reported.36-39 Many different combinations can be possible, and herein the discussion is restricted to oil-in-water emulsions where oil is a dispersed phase (usually less than 10 vol%) and water is a continuous phase. Depending on the surfactants, the droplet sizes and numbers can be controlled. In order to stabilize the droplets, a stronger surfactant is necessary which is the difference between micelles (thermodynamically stable) and emulsions (microemulsions are thermodynamically stable but our focus is on macroemulsions which are
thermodynamically unstable but kinetically weakly stable). In Chapter 4 where conformation and exciton migration of conjugated polymers in emulsions are discussed, we will show a design principle to synthesize strongly hydrophilic surfactant-type conjugated polymers.
1.5 Objectives
The title of this thesis is “Conjugated Polymers and Designed Interfaces: Conformational Analysis and Applications”. As it says, the primary purpose is to provide an understanding of how the conformations of conjugated polymers can be altered in interfaces (Chapter 2, 3, and 4) or structurally varied environments (Chapter 5), as well as how their photophysical outcome will be. Chapter 2 discusses the relative conformational changes of PPEs to the air–water surface, which results in the new emissive excimeric aggregates, referred as incline–stack conformation. It is observed that the exciton migration to the excimer bands occurs, and their application to solvent vapor sensing will be displayed. Chapter 3 exhibit the exciton migration at the air–water interface in the presence of low-energy emissive end-groups. Compared to Chapter 3 which uses 2D planar interface, Chapter 4 deals with the exciton migration in oil–water emulsions, which has curved, spherical interfaces. Conjugated polymers with stronger surface-active properties are required for emulsion fabrication. In contrast to Chapter 2–4, Chapter 5 discusses the functionalized polythiophenes with different substituents and how their conformations can be varied depending on the substituents. Novel postpolymerization modification methodology using lithium–bromine exchange reactions will be discussed.
(1) Anslyn, E. V.; Dougherty, D. A. Modern Physical Organic Chemistry; University Science Books: Sausalito, California, 2006.
(2) Turro, N. J.; Ramamurthy, V.; Scaiano, J. C. Modern Molecular Photochemistry of Organic Molecules; University Science Books: Sausalito, California, 2010.
(3) Kasha, M. Discuss. Faraday. Soc. 1950, 9, 14. (4) Li, G.; Zhu, R.; Yang, Y. Nat Photon 2012, 6, 153.
(5) Günes, S.; Neugebauer, H.; Sariciftci, N. S. Chem. Rev. 2007, 107, 1324.
(6) Burroughes, J.; Bradley, D.; Brown, A.; Marks, R.; Mackay, K.; Friend, R.; Burns, P.; Holmes, A. Nature 1990, 347, 539.
(7) Friend, R. H.; Gymer, R. W.; Holmes, A. B.; Burroughes, J. H.; Marks, R. N.; Taliani, C.; Bradley, D. D. C.; Santos, D. A. D.; Bredas, J. L.; Logdlund, M.; Salaneck, W. R. Nature 1999, 397, 121.
(8) McQuade, D. T.; Pullen, A. E.; Swager, T. M. Chem. Rev. 2000, 100, 2537. (9) Thomas, S. W.; Joly, G. D.; Swager, T. M. Chem. Rev. 2007, 107, 1339. (10) Müllen, K.; Pisula, W. J. Am. Chem. Soc 2015, 137, 9503.
(11) Jenekhe, S. A.; Lu, L.; Alam, M. M. Macromolecules 2001, 34, 7315.
(12) Beaujuge, P. M.; Amb, C. M.; Reynolds, J. R. Acc. Chem. Res. 2010, 43, 1396. (13) Meier, H.; Stalmach, U.; Kolshorn, H. Acta Polym. 1997, 48, 379.
(14) Izumi, T.; Kobashi, S.; Takimiya, K.; Aso, Y.; Otsubo, T. J. Am. Chem. Soc. 2003, 125, 5286. (15) Klaerner, G.; Miller, R. Macromolecules 1998, 31, 2007.
(16) Yang, J. S.; Yan, J. L.; Lin, C. K.; Chen, C. Y.; Xie, Z. Y.; Chen, C. H. Angew. Chem. Int. Ed. 2009, 48, 9936.
(18) Ariga, K.; Yamauchi, Y.; Mori, T.; Hill, J. P. Adv. Mater. 2013, 25, 6477. (19) Levitsky, I. A.; Kim, J.; Swager, T. M. J. Am. Chem. Soc. 1999, 121, 1466.
(20) Kim, J.; McQuade, D. T.; Rose, A.; Zhu, Z.; Swager, T. M. J. Am. Chem. Soc. 2001, 123, 11488.
(21) Bunz, U. H. F. Chem. Rev. 2000, 100, 1605.
(22) Chinchilla, R.; Najera, C. Chem. Soc. Rev. 2011, 40, 5084.
(23) Bunz, U. H. In Conjugated Polymers: Theory, Synthesis, Properties, and Characterization; CRC Press: 2006.
(24) Okuyama, K.; Hasegawa, T.; Ito, M.; Mikami, N. J. Phys. Chem. 1984, 88, 1711. (25) Seminario, J. M.; Zacarias, A. G.; Tour, J. M. J. Am. Chem. Soc. 1998, 120, 3970. (26) Swager, T. M.; Gil, C. J.; Wrighton, M. S. J. Phys. Chem. 1995, 99, 4886.
(27) Zhou, Q.; Swager, T. M. J. Am. Chem. Soc. 1995, 117, 12593. (28) Yang, J.-S.; Swager, T. M. J. Am. Chem. Soc. 1998, 120, 11864. (29) Rochat, S.; Swager, T. M. ACS Appl. Mater. Interfaces 2013, 5, 4488.
(30) Rose, A.; Tovar, J. D.; Yamaguchi, S.; Nesterov, E. E.; Zhu, Z.; Swager, T. M. Phil. Trans. R. Soc. A 2007, 365, 1589.
(31) Förster, T. Discuss. Faraday. Soc. 1959, 27, 7. (32) Dexter, D. L. J. Chem. Phys. 1953, 21, 836.
(33) Roberts, G. Langmuir-blodgett films; Springer Science & Business Media, 2013.
(34) Ulman, A. An Introduction to Ultrathin Organic Films: From Langmuir--Blodgett to Self--Assembly; Academic press, 2013.
(35) Chevalier, Y.; Zemb, T. Rep. Prog. Phys. 1990, 53, 279.
(37) Bibette, J.; Calderon, F. L.; Poulin, P. Rep. Prog. Phys. 1999, 62, 969.
(38) Mason, T.; Wilking, J.; Meleson, K.; Chang, C.; Graves, S. J. Phys.: Condens. Matter 2006, 18, R635.
Chapter 2
Conformational Control and Supramolecular Assemblies of Conjugated
Polymers for Emissive Excimers and Chemical Sensors
Abstract: Interactions between π-conjugated polymers are known to create ground-state
aggregates, excimers, and exciplexes. With few exceptions, these species exhibit decreased fluorescence quantum yields relative to the isolated polymers in liquid or solid solutions. Herein, we report a method to assemble emissive conjugated polymer excimers and demonstrate their applicability in the detection of selected solvent vapors. Specifically, poly(phenylene ethynylene)s (PPEs) with amphiphilic side chains are organized in a Langmuir monolayer at the air−water interface. Compression of the monolayer results in the reversible conversion from a face-on organization of the π-system relative to the water to what appears to be an incline-stack conformation. The incline-stack organization creates a bright yellow emissive excimeric state with increases of 28% in relative fluorescence quantum yields to the face-on monolayer conformation. Multilayers can be transferred onto the glass substrate via a Langmuir−Blodgett method with preservation of the excimer emission. These films are metastable and the fluorescence reverts to a cyan color similar to the spectra obtained in solution and spin-cast films after exposure to selected solvent vapors. This behavior has practical utility as a fluorescence-based indicator for selected volatile organic compounds.
Parts of this chapter were adapted and reprinted with permission from Koo, B.; Swager, T. M. “Highly Emissive Excimers by 2D Compression of Conjugated Polymers” ACS Macro Lett. 2016, 5, 889.
2.1 Introduction
Understanding and controlling the structure and electronic couplings of semiconductive polymers in the solid state is central to their utility in photonic and organic electronic technologies.1,2 Intrapolymer conformation and relevant physical properties have been investigated by conventional spectroscopy and by single-molecule spectroscopy.3 Studying and understanding interpolymer couplings is complicated by a virtual continuum of conformations that depend on sample composition, deposition, and annealing. To this end, there has been considerable focus on modulating intrinsic polymer properties such as molecular weight, side-chain structure/density, and processing conditions that produce film morphologies with largely empirically optimized transport properties4 and organizations.5 However, presently the critical solid-state properties of transport (carriers and excitons) are limited by interpolymer interactions, and hence new methods are needed for the continued development of organic electronics.
The Langmuir-Blodgett method6 remains as a preferred technique for the fabrication and study of highly ordered films from surfactants. For π-conjugated polymers, Langmuir monolayers at the air-water interface and transferred films have provided definitive information regarding correlations between conformation and π-stacking.7,8 These conclusions were made possible by in situ absorption and emission spectroscopic measurements. These previous studies revealed that depending upon the structure poly(phenylene ethynylene)s display highly emissive phases with planarized or twisted conformations and π-stacked (H-type) organizations with highly quenched emission. The latter is understood to be the reason for the low solid-state emission quantum yields of organic polymers that lack steric blocking groups.
Interpolymer interactions most often give rise to ground-state aggregates with low quantum yields9 and excimers that similarly have low emission.10 Ground-state aggregates typically have
cofacial π-π stacking, with spectroscopic properties similar to the edge-on conformation at the air-water interface (Figure 2.1b). With the associated aggregation-caused quenching, they display characteristic red-shifted absorption peaks.7,8,11-13 Excimers (excited-state dimers: M*+M → [MM]*)14,15 have red-shifted and broad emissions with increased lifetimes. Both ground-state aggregates and excimers are generally considered to be species that should be avoided as a result of their nonradiative decay channels that give lower the quantum yields.16,17 As a result, many electrooptic polymers accommodate groups that block cofacial π-π stacking,18 large disordered side chains19 or hyperbranched copolymers20 to generate amorphous films.
Although excimers of conjugated polymers are considered to be less emissive and are thus to be avoided, there are cases wherein excimers of small molecules are highly emissive.21,22 We report herein emissive excimers of conjugated polymers23 that are organized at the air-water interface by compression of a film with face-on (Figure 2.1a) organization to give a proposed incline-stack (Figure 2.1c) with π-π interactions. The incline-stack model that we propose is achieved as a result of the strong anchoring at the water interface that prevents cofacial polymer aggregates (vide infra).
Previous work This work
water
(a) Face-on air
(b) Edge-on (c) Incline-stack
Figure 2.1. Polymer conformations at the air-water interfaces. Planes of phenyl repeat units are
(a) parallel (face-on) and (b) perpendicular (edge-on) to the surface of water, respectively, reported in the literature. (c) Incline-stack is proposed in this work where the face of phenyl is inclined and stacked to form bright excimers.
2.2 Results and Discussion
We synthesized homopolymer P1 (Figure 2.2a), a derivative of poly(phenylene ethynylene) (PPE), with amphiphilic side chains at 1,4-position. Related polymers had been previously demonstrated to give sufficiently strong anchoring at water/organic interfaces to be incorporated in lyotropic liquid crystals.24 P1 was synthesized through Sonogashira-type polymerization (procedures in the Chapter 2.4 Experimenal Details) and after purification has a molecular weight (GPC) of 33 kDa (degree of polymerization (n) ~ 22) and polydispersity of 1.40. Consistent with previous designs, P1’s equilibrium structure is a face-on organization at the air-water interface (Figure 2.2b, top). An extrapolated area per one phenylene ethynylene unit is about 170 Å2 obtained from the pressure-area isotherm (Figure 2.3) and is consistent with the expected face-on conformation.7 Upon compression of the Langmuir monolayer, the cyan emission of the face-on
(a) (b) air P1 hydrophobic chains hydrophilic chains water
Figure 2.2. (a) The structure of the polymer P1 (33 kDa, Đ 1.40) with amphiphilic side chains
functionalized in a symmetric fashion. (b) The possible conformation depending on the presence of the external surface pressure. The green rectangle is a phenylethynylene repeat unit seen from the end of the axis of the backbone. With surface pressures less than 25 mN/m (top), a face-on structure is present. At higher surface pressures (bottom), the strong anchoring of side chains to the water prevents the perpendicular orientation of the backbone and result in the proposed incline-stack conformation.
state (Figure 2.4a, top) transforms to give a yellow emission that is visibly observed under a hand-held black light (Figure 2.4a, bottom, and see the SI for a video in the following publication: Koo, B.; Swager, T. M. ACS Macro Lett. 2016, 5, 889). We propose that the yellow emission results from incline-stack conformation, which is formed by strong anchoring to the water (Figure 2.2b, bottom) that would be lost if the system adopted an edge-on compressed conformation.
In situ absorption and photoluminescence (PL) spectroscopy (Figure 2.4b,c) were performed to determine the origin of emission changes. At 8 mN/m, the absorption (466 nm) and emission (475 nm) maxima are red-shifted when compared to the solution spectra shown in Figure 2.5 (439 nm for absorption and 471 nm for emission), which indicates the planarized conformation at the air-water interface. Initial compression promotes a very slight blue shift in the absorption spectra from 466 nm (8 mN/m) to 464 nm (21 mN/m) owing to disorder of π-system from the equilibrium face-on structure7 and similarly small changes in the emission. The pressure-area isotherm (Figure 2.4d) is relatively linear from 8 mN/m (black circle) to 21 mN/m (green circle),
Figure 2.3. Pressure-area isotherm of P1 with the small amount of sample loading to observe the onset
point. The isotherm with the higher amount of sample loading is shown in Figure 2.4d.
50 100 150 200 250 0 10 20 30 40 S u rf ac e Pr es su re ( mN /m) Area/Repeat Unit (Å2)
which suggests the absence of a phase transition. At 25 mN/m, we observe an inflection point in the pressure-area isotherm and large changes in the absorption and emission spectra. The absorption spectrum at 27 mN/m gains a new sharp red-shifted peak (475 nm) that is typical of
40 80 120 160 10 20 30 40 S u rf ac e Pr es su re ( mN /m) Area/Repeat Unit (Å2 ) Compression Expansion (a) (b) (c) (d)
Figure 2.4. (a) Compression-induced bright yellow excimers of P1. Pictures are taken under 365
nm hand-held UV lamp from the fixed position. The areas upon expansion (top) and compression (bottom) are ca. 77 cm2 (11 × 7 cm) and 18 cm2 (2.6 × 7 cm), respectively. (b) In situ absorption spectra depending on the surface pressure. Increased planarization is observed from 27 mN/m to 37 mN/m with a new peak around 480 nm. All spectra (except multilayer at 43 mN/m) shows identical shape with the increased absorbance as a result of the decreased surface area. (c) In situ PL spectra recorded depending on the applied surface pressure with excitation at 435 nm. Broad, structureless, red-shifted emission bands from 475-650 nm are the characteristics of excimers. Relative quantum yields are shown in the parenthesis. The inset is the modified spectra calculated based on the same absorption at 435 nm in each surface pressure. (d) Pressure-area isotherm of the P1 monolayer. Here the repeat unit on the x-axis is considered as one phenylene ethynylene unit. The inflection point at 25 mN/m is the point where the transition of the conformation from face-on to incline-stack occurs. Another transition observed at ca. 38 mN/m exhibits the multilayer formation. 500 550 600 650 0 5 10 15 E mis sion ( a.u.) Wavelength (nm) 8 mN/m (1.00) 11 mN/m (1.03) 21 mN/m (1.09) 27 mN/m (1.28) 33 mN/m (1.12) 37 mN/m (0.97) 43 mN/m (1.02) ( ): Rel. QY 360 400 440 480 520 0.000 0.004 0.008 0.012 0.016 0.020 Ab so rb an ce Wavelength (nm) 8 mN/m 11 mN/m 21 mN/m 27 mN/m 33 mN/m 37 mN/m 43 mN/m 500 550 600 650 0 1 2 3
chain-chain interactions of planar polymers25 which further red-shifts (483 nm at 37 mN/m) at higher pressures. The PL spectrum shows the red-shifted, broad, featureless emission extending from 475 to 650 nm. There are two broad emission bands at 545 and 585 nm (ΔE = 1260 cm-1),
350 400 450 500 550 600 650 0.0 0.3 0.6 0.9 1.2 0.0 0.3 0.6 0.9 1.2 484 Emis sion ( No rma liz ed ) Ab so rp tion ( No rma liz ed ) Wavelength (nm) Solution, Abs Solution, Emi Thin film, Abs Thin film, Emi
439 471
454
Figure 2.5. Spectra of solution and thin films of P1 that do not display emissive excimers. Absorption
(solid) and emission (dotted) spectra in solution (black) and thin films (red) are obtained. Thin films show no excimeric emission. 400 450 500 550 0 1 2 3 4 5 E mis sion ( a.u.) Wavelength (nm) @552 nm @587 nm 37 mN/m 400 450 500 550 0 1 2 3 4 43 mN/m E mis sion ( a.u.) Wavelength (nm) @552 nm @590 nm
Figure 2.6. Excitation spectra at 37 mN/m (left) and 43 nm (right) of the P1 monolayer at the air-water
the relative intensities of which vary with pressure, suggesting two slightly different emissive states, although the excitation spectra (Figure 2.6) cannot distinguish them. The new emissions have classic broad exciplex features. The strong anchoring of the hydrophilic side-chains in the water prevents eclipsed stacking of the backbones and we suggest that the excimer emission and the new sharp feature in the absorption are associate with an incline-stack organization. The fact that the repeating unit area (one phenylene ethynylene unit) of the incline-stack transition (ca. 90 Å2) is between the face-on (170 Å2) and the previously reported edge-on (30 – 40 Å2)8 further implies the intermediate conformational features of the incline-stack between face-on and edge-on. With this area of 90 Å2, one Ph-CC unit length of 7 Å provides the average interpolymer distance of 13 Å , which is in the similar range of pyrene excimer distance of ~ 10 Å . At 27 mN/m, the quantum yield increases by 28% (Figure 2.4c parentheses) relative to the uncompressed face-on cface-onformatiface-on (8 mN/m). The slight decreases in the relative quantum yields after 27 mN/m are attributed to unstructured ground-state interactions, which typically give rise to self-quenching. Multilayer formation is observed above 38 mN/m from the pressure-area isotherm and the vivid yellow emission is maintained at 43 mN/m. In the multilayers, the observed broader absorption is perhaps attributed to the fact that some of the layers lack anchoring to the water and therefore may have more random conformations. The subsequent expansion from 43 mN/m entails the rapid decrease of the surface pressure and a different isotherm shape from compression, which may indicate the fast relaxation of the compressed multilayers (discussed later). The isotherms are highly reversible (Figure 2.7).
In order to confirm that the preorganization (planarization and alignment) at the air-water interface is key to forming emissive excimers, we investigated emission obtained from different sample preparations (Figure 2.5 and 2.8). Spin-cast films of P1 on glass substrates display an
emission maximum at 484 nm that is red-shifted from λmax of the solution with no evidence of the broad excimer emission (Figure 2.5). Aggregates generated in solution by the addition of hexane (a poor solvent for the polymer) results in aggregation-induced quenching without excimeric emission (Figure 2.8).
Figure 2.7. The pressure-area isotherms of the first three cycles for mechanical annealing, supplemental to
Figure 2.4d. The consistent shapes indicate the reversible and reproducible formation of incline-stack conformation. The first cycle is slightly off from the equilibrium, implying that the mechanical annealing indeed helps the polymers pack each other after one compression-expansion cycle.
40 80 120 160 10 20 30 40 S u rf ac e Pr es su re ( mN /m) Area/Repeat Unit (Å2) Initial compression Subsequent expansion 1st cycle 450 500 550 600 650 0 2 4 6 8 10 E mis sion ( a.u.) Wavelength (nm) 1:0 1:0.03 1:0.2 1:0.5 1:1 1:2 1:5 1:23 1:120 Chloform:Hex 472 increase hexane 540 570 600 0.0 0.7 1.4 E mis sion ( a.u.) Wavelength (nm)
Figure 2.8. Emission spectra (left) of solution aggregates of P1 that do not display emissive excimers.
Aggregate dispersions by adding a poor solvent (hexane) are generated. The increased amount of hexane triggers the self-quenching as a result of cofacial ground-state aggregates (see absorption spectra (right)). The enlarged spectra in inset confirm the absence of excimers. Absorption spectra (right) of solution aggregates of P1 in varying ratio of hexane to chloroform.
350 400 450 500 550 600 0.0 0.3 0.6 0.9 Ab so rb an ce Wavelength (nm) 1:0 1:0.03 1:0.2 1:0.5 1:1 1:2 1:5 1:23 1:120 Chloroform:Hex 449
To probe the role of chemical structure on excimer formation, we designed and synthesized an alternating copolymer, P2 (Figure 2.9a). Following the synthesis from the literature,24 a molecular weight of 23 kDa with the polydispersity of 1.51 was obtained which was similar to P1.
P2 also forms Langmuir monolayers but the PL spectra (Figure 2.9b) exhibit no evidence of
excimer formation. This sustained shape of P2’s PL spectra, its extrapolated area (155 Å2 per one phenyl ethynylene unit), and absence of aggregation-induced quenching suggest that the conformation of the P2 is face-on at pressures below folding into multilayers (pressure-area isotherm in Figure 2.10).
The ability of P1 to form excimers with compression suggests their utility as a chemical indicator. To accomplish this, we first transferred P1 in its compressed multilayer excimer form that shows intense yellow emission (43 mN/m) to a hydrophilic glass slide (treated with nitric acid and sodium hydroxide solution) using the Langmuir-Blodgett (LB) method with an upstroke. The
(a) (b) P2 450 500 550 600 650 2 4 6 8 10 12 14 16 470 E mis sion ( a.u.) Wavelength (nm) 0 mN/m 8 mN/m 23 mN/m 31 mN/m 33 mN/m 34 mN/m 480
Figure 2.9. A hetero-type PPE, P2, showing the absence of excimer formation. (a) The structure
of P2 (23 kDa, Đ 1.51) where bis(N,N-dioctylamide)benzene in blue is introduced as a co-monomer. (b) The in situ emission spectra of P2 at the air-water interface. No excimer emission was observed.
films are highly emissive (Figure 2.11a, inset) and the absorption spectrum (Figure 2.11a, black solid line) is analogous to those of cyan emitting spin-coated films, implying there are no new ground-state interactions among polymer chains. The sharp absorption peak at 482 nm that existed
50 100 150 200 250 300 350 0 10 20 30 40 S u rf ac e Pr es su re ( mN /m) Area/Repeat Unit (Å2)
Figure 2.10. Pressure-area isotherm of hetero-type PPE (P2). The repeat unit on the x-axis contains two
phenylene ethynylenes. 350 400 450 500 550 600 650 700 0.000 0.005 0.010 0.015 0.020 0.0 0.2 0.4 0.6 0.8 1.0 Ab so rb an ce Wavelength (nm) Abs, before CHCl3 Abs, after CHCl3 447 Emis sion ( No rma li ze d ) Emi, before CHCl3 Emi, after CHCl3 476 530 (a) (b)
Figure 2.11. Transfer of the compressed multilayer onto the glass substrate using
Langmuir-Blodgett method and solvent vapor detection. (a) Absorption (solid) and emission spectra (dotted) of the transferred P1 films and before (black) and after (red) exposure to chloroform. The inset picture is the film under 365 nm irradiation. (b) Solvent vapor sensing is demonstrated wherein good solvents (chloroform, methanol, acetone, and THF) induce the reorganization of the aligned polymers, reverting to cyan emission in a few seconds. In contrast, prolonged exposure to poor solvents (hexane and water) produces no response.