HAL Id: hal-02998461
https://hal.archives-ouvertes.fr/hal-02998461
Submitted on 14 Nov 2020
HAL is a multi-disciplinary open access
archive for the deposit and dissemination of sci-entific research documents, whether they are pub-lished or not. The documents may come from teaching and research institutions in France or
L’archive ouverte pluridisciplinaire HAL, est destinée au dépôt et à la diffusion de documents scientifiques de niveau recherche, publiés ou non, émanant des établissements d’enseignement et de recherche français ou étrangers, des laboratoires
Vicky Oelze, Alice Percher, Gontran Nsi Akoué, Nory El Ksabi, Eric
Willaume, Marie Charpentier
To cite this version:
Vicky Oelze, Alice Percher, Gontran Nsi Akoué, Nory El Ksabi, Eric Willaume, et al.. Seasonality and interindividual variation in mandrill feeding ecology revealed by stable isotope analyses of hair and blood. American Journal of Primatology, Wiley, 2020, �10.1002/ajp.23206�. �hal-02998461�
For Peer Review
Seasonality and inter-individual variation in mandrill feeding ecology revealed by stable isotope analyses of hair
and blood Journal: American Journal of Primatology Manuscript ID AJP-20-0069.R2
Wiley - Manuscript type: Research Article Date Submitted by the
Author: n/a
Complete List of Authors: Oelze, Vicky Percher, Alice
NSI-Akoue, Gontran; University of Sciences and Technology of Masuku, Department of Biology; University of Sciences and Technology of Masuku, Department of Biolohy
El Ksabi, Nory
Willaume, Eric; SODEPAL,
Charpentier, Marie; ISEM UMR 5554 Indicate which taxonomic
group was the subject of your study (select all that apply or type another option)::
Old World monkeys
For Peer Review
1
Seasonality and inter-individual variation in mandrill feeding ecology
2revealed by stable isotope analyses of hair and blood
3
4 Vicky M Oelze1,2, Alice M Percher3, Gontran Nsi Akoué4, Nory El Ksabi5, Eric
5 Willaume5, Marie JE Charpentier3*
6
7 1 Anthropology Department, University of California Santa Cruz, Santa Cruz, USA
8 2 Department of Primatology, Max Planck Institute for Evolutionary Anthropology, 9 Leipzig, Germany
10 3 Institut des Sciences de l’Évolution de Montpellier UMR5554, CNRS, IRD, EPHE,
11 Université de Montpellier, Montpellier, France
12 4 Université des Sciences et Techniques de Masuku, Franceville, Gabon
13 5 SODEPAL, Bakoumba, Gabon 14
15 Running head:
16 Stable isotope analyses in free ranging mandrills 17
18 *Corresponding author: 19 Marie JE Charpentier
20 ISEM UMR5554
21 Place Eugène Bataillon cc065
22 34095 Montpellier cedex 05, France 23 Email: marie.charpentier@umontpellier.fr 4 5 6 7 8 9 10 11 12 13 14 15 16 17 18 19 20 21 22 23 24 25 26 27 28 29 30 31 32 33 34 35 36 37 38 39 40 41 42 43 44 45 46 47 48 49 50 51 52 53 54 55 56 57 58
For Peer Review
25 Abstract
26 Mandrills are large bodied, terrestrial forest primates living in particularly large social
27 groups of several hundred individuals. Following these groups in the wild to assess 28 differences in diet over time as well as among individuals is demanding. We here use
29 isotope analyses in blood and hair obtained during repeated captures of 43 identified 30 free-ranging mandrills (Mandrillus sphinx) from Southern Gabon, to test how dietary 31 variation relates to season as well as an individual’s age and sex. We measured the
32 stable carbon (δ13C‰) and nitrogen (δ15N‰) isotope ratios in 46 blood and 214 hair 33 section samples as well as from a small selection of mandrill foods (n=24). We found
34 some seasonal isotopic effects, with lower δ13C values but higher δ15N values observed 35 during the highly competitive long dry season compared to the fruit-rich long rainy 36 season. Variation in δ13C was further predicted by individual age, with higher δ13C
37 values generally found in younger individuals suggesting that they may consume more 38 high canopy fruit than older individuals, or that older individuals consume more low
39 canopy foliage. The best predictor for δ15N values was the interaction between age and 40 sex, with mature and reproductively active males revealing the highest δ15N values, 41 despite the observation that males consume substantially less animal food items than
42 females. We interpret high δ15N values in these mature male mandrill blood and hair 43 sections to be the result of nutritional stress associated to intense male-male 44 competition, particularly during mating season. This is the first study showing isotopic 45 evidence for nutritional stress in a free-ranging primate species and may spark further 46 investigations into male mandrill diet and energy balance.
47
48 Keywords: carbon, nitrogen, sex differences, season 4 5 6 7 8 9 10 11 12 13 14 15 16 17 18 19 20 21 22 23 24 25 26 27 28 29 30 31 32 33 34 35 36 37 38 39 40 41 42 43 44 45 46 47 48 49 50 51 52 53 54 55 56 57 58 59
For Peer Review
49 Research Highlights 50
51 Stable isotope analyses of hair and blood have the potential to provide short and 52 long-term data on how individual diets may shift over the season and with
53 individual traits.
54 Dietary patterns differ across seasons, between sexes as well as between young 55 and older mandrills.
56 Mature and reproductively active male mandrills showed the highest nitrogen 57 isotope values as a result of nutritional stress possibly associated to intense 58 male-male competition in this species.
59 This is the first study showing isotopic evidence for nutritional stress in a free-60 ranging primate species.
61 4 5 6 7 8 9 10 11 12 13 14 15 16 17 18 19 20 21 22 23 24 25 26 27 28 29 30 31 32 33 34 35 36 37 38 39 40 41 42 43 44 45 46 47 48 49 50 51 52 53 54 55 56 57 58
For Peer Review
62 Introduction
63 Feeding ecology studies are essential to determine an individuals’ nutritional and
64 energetic requirements and understand how they translate into different biological and 65 ecological characteristics of a species, such as ranging patterns and socio-sexual
66 behavior (e.g. Chapman and Chapman, 1990, Hohmann et al., 2006, Lambert and 67 Rothman, 2015; McGraw and Daegling, 2012). As with many other animal species, 68 primate sociality highly depends on how food is distributed in the environment. The
69 degree at which individuals use clumped and high energy food resources such as fruits 70 vs. much more dispersed lower energy foods such as foliage gives insights into the
71 evolution of sociality across primate species (Clutton-Brock and Janson, 2012; van 72 Schaik, 1989; Sterck et al., 1997).
73 Compared to other terrestrial large bodied primates in Africa, such as great apes and
74 baboons, mandrills (Mandrillus sphinx) are clearly understudied in the wild. Our 75 knowledge about mandrill feeding seasonality and competition is limited to a handful of
76 studies conducted in the 1980s (Harrison, 1988; Hoshino et al., 1984; Lahm, 1986; 77 Rogers et al., 1996) as well as much more recent work at a research site in Southern 78 Gabon, the Lékédi Park (Nsi Akoué et al., 2017). Our current understanding is that
79 mandrills are generalist feeders with a clear tendency towards frugivory (Lahm, 1986; 80 Nsi Akoué et al., 2017). During a 17-month behavioral survey, 57 mandrills from the 81 Lékédi population were observed consuming about 150 different plant species 82 (including more than 440 different items), representing 74% of their diet, along with 83 mushrooms (<1%), invertebrates (6%) and vertebrates (<1%) (Nsi Akoue et al., 2017).
84 Behavioral data additionally suggest that females consumed more faunal food items 85 than males (Nsi Akoue et al., 2017). Among the plant species frequently consumed, 4 5 6 7 8 9 10 11 12 13 14 15 16 17 18 19 20 21 22 23 24 25 26 27 28 29 30 31 32 33 34 35 36 37 38 39 40 41 42 43 44 45 46 47 48 49 50 51 52 53 54 55 56 57 58 59
For Peer Review
86 mandrills relied essentially on C3 plants (e.g. Xylopia aethiopica and Pentaclethra
87 macrophylla), including bamboo, a C3 plant within the grass family Poaceae (e.g. Olyra
88 latifolia, see Nsi Akoué et al., 2017).
89 While long-term and direct observations of feeding behavior generally constitute the
90 ideal method for determining dietary differences between individuals and across 91 seasons, this requires full habituation and long-term systematic study. In mandrills, 92 direct observations are partially impeded by the fairly large group sizes of several
93 hundred individuals (Abernethy et al., 2002; Harrison, 1988; Rogers et al., 1996). The 94 use of indirect methods to study primate diets are thus a tempting and cost-effective
95 alternative to some, clearly not all, aspects of direct observation. Fecal analysis provides 96 a good overview of what food items are eaten by a primate species over short to long 97 term periods and can be conducted even in unhabituated groups (e.g. Tutin and
98 Fernandez, 1993). However, while fecal analysis is strictly non-invasive and reveals 99 some aspects of what was ingested by the animals the previous day(s), the dietary
100 assessment is potentially biased towards indigestible food items such as fruit seeds, 101 tough foliage and insect chitin (Lahm, 1986) and the method requires repeated sampling 102 over large stretches of time. As an alternative approach, the stable isotopes of carbon
103 (δ13C) and nitrogen (δ15N) are increasingly used to reconstruct diet and ecological 104 niches of wild animal species with less sampling effort (Crowley, 2012; Crowley et al., 105 2015). For example, patterns of seasonal dietary overlap and dietary differentiation 106 found in isotope values of hair collected non-invasively from nests of central 107 chimpanzees (Pan troglodytes troglodytes) and lowland gorillas (Gorilla gorilla gorilla)
108 suggested plasticity in the feeding niches of these sympatric apes (Oelze et al., 2014), 4 5 6 7 8 9 10 11 12 13 14 15 16 17 18 19 20 21 22 23 24 25 26 27 28 29 30 31 32 33 34 35 36 37 38 39 40 41 42 43 44 45 46 47 48 49 50 51 52 53 54 55 56 57 58
For Peer Review
109 consistent with previous results based on long-term and labor intensive fecal sample 110 collection and analysis (Head et al., 2011).
111 Stable isotope analysis in samples of body tissue provides estimates of several aspects 112 of the animals’ diet in the recent or more distant past (Crowley, 2012; Crowley et al.,
113 2015; Sandberg et al., 2012). Feces and blood are for example turned over by the body 114 fairly rapidly and are related to the diet of the previous days or weeks (Hobson and 115 Clark, 1992). By contrast, hair keratin has a much slower turnover rate of ~1cm per
116 month (Tobin, 2005; Fourie et al., 2016), although hair growth rates are yet unknown 117 for most wild primates necessitating to fall back on human hair growth rates as a proxy
118 (Oelze, 2016). In hair, sampling along the growth trajectory from hair root to tip allows 119 for a isotopic time sequence of several consecutive months (O’Connell and Hedges, 120 1999; Schwertl et al., 2003; Oelze, 2016). The use of sequential hair isotope analysis
121 has shown to be particularly useful to investigate dietary changes over time in response 122 to shifts in climate and food availability as well as dietary differences between
123 individuals within the same social group (Oelze, 2016; Oelze et al., 2011, 2014, 2016a). 124 Some aspects of diet may be reconstructed using stable isotopes because the ratios of 125 the stable isotopes of carbon (13C/12C = δ13C) and nitrogen (15N/14N = δ15N) in animal
126 bodies are sourced from the predominant foods, which can vary drastically and thus be 127 relevant dietary markers (DeNiro and Epstein, 1978, 1981). On the one hand, the δ13C 128 values of plants differ substantially between C3 and C4 photosynthetic pathways
129 (Tieszen, 1991), but also between high canopy and low canopy plant resources in forest 130 habitats (Medina and Minchin, 1980; van der Merwe and Medina, 1989), and even
131 between photosynthetic (e.g. foliage) and reproductive plant parts (e.g. fruits and 132 flowers; Cernusak et al., 2009). In C3 plant dominated tropical rainforest habitats, we
4 5 6 7 8 9 10 11 12 13 14 15 16 17 18 19 20 21 22 23 24 25 26 27 28 29 30 31 32 33 34 35 36 37 38 39 40 41 42 43 44 45 46 47 48 49 50 51 52 53 54 55 56 57 58 59
For Peer Review
133 can expect the majority of variation in δ13C in herbivore consumers to be associated 134 with differences in the consumption of high versus low canopy food items (e.g. arboreal
135 fruit versus terrestrial herbs), as well as between reproductive and photosynthetic plant 136 parts (e.g. fruit versus leaves; Blumenthal et al., 2016; Oelze et al., 2016a; Roberts et
137 al., 2017).On the other hand, the δ15N values in foods mainly relate to the trophic level 138 of a food item, with plants revealing the lowest δ15N values (DeNiro and Epstein, 1981). 139 Primary consumers have significantly higher δ15N values than the plants they eat,
140 whereas carnivores reveal higher δ15N values than herbivores (DeNiro and Epstein, 141 1981).
142 While differences between some food categories can be striking, there are several 143 environmental factors that influence the isotopic variation within plants in a given 144 habitat, including temperature (Barnes et al., 2007), rainfall (Nardoto et al., 2008; Sealy
145 et al., 1987), altitude (Tieszen et al., 1979), soil composition (Dawson et al., 2002), as 146 well as canopy density (Medina and Minchin, 1980). One strategy to cope with these
147 environmental influences is to assess the local isotope baseline using a small yet 148 representative plant sample, ideally consisting of plant foods frequently consumed by 149 the study subjects (Oelze et al., 2011, 2016b). There is no widespread consensus on how
150 extensive this plant sample should be to represent the habitat, and some studies still do 151 not include any plant samples at all (Loudon et al., 2014; Schoeninger et al., 2015; 152 Sponheimer et al., 2006). However, while these baseline values are crucial when 153 comparing between primate groups ranging in different habitats with different 154 environmental conditions (Oelze et al., 2016b), they may be less essential to studies
155 focusing on intra-community differences as well as isotopic variation over time. 4 5 6 7 8 9 10 11 12 13 14 15 16 17 18 19 20 21 22 23 24 25 26 27 28 29 30 31 32 33 34 35 36 37 38 39 40 41 42 43 44 45 46 47 48 49 50 51 52 53 54 55 56 57 58
For Peer Review
156 Isotopic patterns can vary considerably between individuals and reveal information on 157 their access to food as well as on their physiological condition. For example, sex and/or
158 social rank can result in a biased access to specific desirable foods which can be distinct 159 in their δ15N values, e.g. vertebrate meat (Fahy et al., 2013; Oelze et al., 2011, 2016a).
160 Also the energetic demands of female reproduction (gestation, lactation) can affect her 161 bodies nitrogen balance and thus skew the δ15N values (Fuller et al., 2004; Oelze et al., 162 2016a). Further, there is good evidence that negative energy balance due to severe
163 nutritional stress or fasting can result in shifts in nitrogen metabolism and thus δ15N 164 values in primates (Deschner et al., 2012; Mekota et al., 2006) and other animals
165 (Hobson et al., 1993).
166 In this study, we evaluate to what extent stable isotope analysis can provide novel 167 information regarding the feeding ecology of a natural population of mandrills living at
168 the Lékédi Park and surroundings, in Southern Gabon. In particular, we focus on the 169 effects of shifting environmental conditions (season) and individual characteristics (age,
170 sex) on the δ13C and δ15N values measured in mandrill body tissue samples. We here 171 use two different sample tissues with two very different turnover rates and thus 172 reflecting different periods in time. Blood isotope data is considered here to reflect the
173 recent dietary contributions of the past day(s) with relatively high accuracy, whereas 174 hair section isotope data relates to the isotopic characteristics of foods consumed over 175 the previous months, with data representing weekly or monthly intervals. We assess to 176 what extent these two different sample types pick up the same isotopic patterns.
177 Given the previous isotopic research in tropical forest of Gabon (Oelze et al., 2014), as
178 well as previous observational data on this primate population (Nsi Akoue et al., 2017), 179 we focus on the following predictions. Regarding the season of sampling, we expect 4 5 6 7 8 9 10 11 12 13 14 15 16 17 18 19 20 21 22 23 24 25 26 27 28 29 30 31 32 33 34 35 36 37 38 39 40 41 42 43 44 45 46 47 48 49 50 51 52 53 54 55 56 57 58 59
For Peer Review
180 isotopic values to vary between rainy and dry seasons, as fruit availability is commonly 181 shifting with rainfall. Shifting proportions of foliage vs. fruit should particularly have an
182 effect on the δ13C values of mandrills, with high fruit intake periods being associated 183 with high δ13C values (Blumenthal et al., 2016; Cernusak et al., 2009; Oelze et al.,
184 2016a; Roberts et al., 2017). Regarding individual age, we predict that the intense intra-185 sexual competition observed in fully adult males (Setchell et al., 2005), as compared to 186 younger, non-reproductive males, may result in nutritional stress particularly during the
187 mating season (long dry season) with higher δ15N values in mature males. Finally, 188 regarding individual sex, we expect to find slightly higher δ15N values in all females as
189 compared to all males as females have been shown to consume more animal food items 190 than males (Nsi Akoué et al., 2017), which can be expected to have higher δ15N values 191 than plant foods.
192
193 Materials and Methods
194 Ethical statement
195 This study complies with ethical protocols approved by the CENAREST institution 196 (authorization number: AR003/20/MESRSTT/CENAREST/CG/CST/CSAR). This
197 research adhered to the legal requirements of Gabon and to the American Society of 198 Primatologists principles for the ethical treatment of nonhuman primates.
199 Site and study population
200 The study group originates from 65 captive individuals released into the park on two 201 occasions in 2002 and 2006 (Peignot et al., 2008). Food supplementation with bananas
202 and home-made cakes three to five times a week was initiated with the release, then 4 5 6 7 8 9 10 11 12 13 14 15 16 17 18 19 20 21 22 23 24 25 26 27 28 29 30 31 32 33 34 35 36 37 38 39 40 41 42 43 44 45 46 47 48 49 50 51 52 53 54 55 56 57 58
For Peer Review
203 gradually declined for a few years and totally ceased in April 2012 except during 204 punctual trappings. The study population is monitored daily within the framework of a
205 long-term field project (Mandrillus Project) started in early 2012. In 2018, the group 206 was composed of ca. 180-200 habituated and individually identified mandrills, of which
207 ~ 90% were born in the wild. We collected tissue samples from a total of 43 individuals 208 (24 males, 19 females) aged 2.2-19.3 yrs. Data on individual age in this study are based 209 on observed birth dates (n=12) or are based on general body conditions as well as tooth
210 eruption and wear patterns (Galbany et al., 2014).
211 The study population ranges freely in the Lékédi Park and its surroundings near the
212 village of Bakoumba. This private park covers an area of 116km² at an elevation 213 varying from 430 to 610m. The habitat is composed of closed canopy forests and 214 patches of savanna (Brockmeyer et al., 2015). Gabon is characterized by an equatorial
215 climate with a long rainy season (Feb-May; in the studied site: monthly average 216 temperature=23.9°C and total rainfall=240.5 mm; data pooled from 04/2012-12/2014), a
217 long dry season (Jun-Sep; 22.1°C and 18.9 mm), a short rainy season (Oct-Nov; 23.3°C 218 and 152.3 mm) and a short dry season (Dec-Jan; 23.5°C and 133.3 mm). These four 219 climatic seasons have been shown to result in distinct diets in the studied mandrills,
220 with no overlap in food selection between these seasons (see Figure 1 in: Nsi Akoué et 221 al., 2017). In addition, reproduction is highly seasonal in mandrills, with most females 222 cycling during the long dry season and giving birth during the short dry season or at the 223 beginning of the long rainy season (MJEC, pers. obs). We therefore considered these 224 four climatic seasons as a reliable indicator for the seasonality of mandrill behavior and
225 ecology. 226 Sample collection 4 5 6 7 8 9 10 11 12 13 14 15 16 17 18 19 20 21 22 23 24 25 26 27 28 29 30 31 32 33 34 35 36 37 38 39 40 41 42 43 44 45 46 47 48 49 50 51 52 53 54 55 56 57 58 59
For Peer Review
227 We collected hair tufts and blood samples from mandrills during four capture events 228 between April 2012 and July 2014. During these events, mandrills were baited with
229 food (mostly bananas) and anesthetized via blowpipe intramuscular injection of a 230 ketamine-xylazine mix. After 30-40 min, individuals were awakened using atipamezole.
231 During anesthesia, we plucked hair from the mandrills’ arms or legs and stored them in 232 paper envelopes that were then stored dry. We collected blood samples from the iliac 233 vein of the individuals using heparinized tubes. Blood samples were centrifuged (15
234 min at 3000 rpm) the day of collection to obtain blood samples that were stored at -235 20°C (Beaulieu et al., 2017).
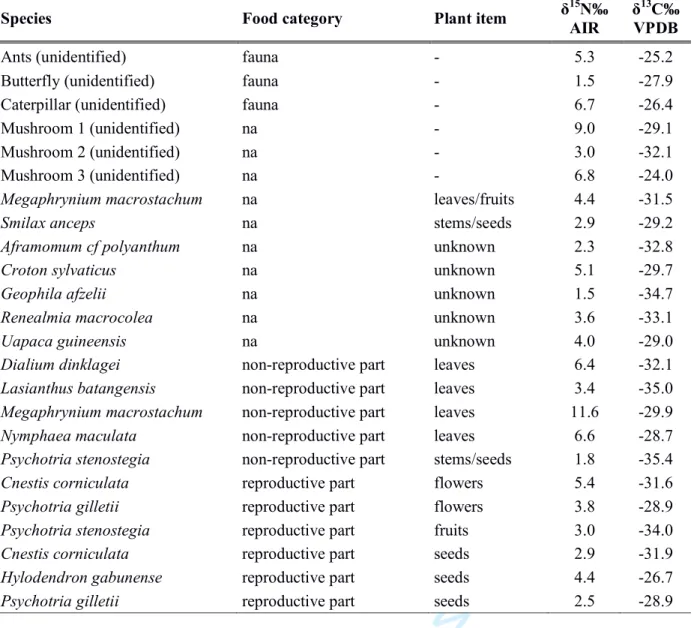
236 In 2014, we collected 24 food samples consumed by the studied mandrills, including 14 237 plant species, three mushroom and three insect species (Table S1). These items were 238 selected randomly among the hundreds of food items known to be consumed by the
239 studied population to gain a broad impression on the plant baseline values in the habitat, 240 without an expectation of grasping the entire picture of plant isotope diversity. All
241 selected plant species are frequently consumed by the studied mandrills (>0.10 242 occurrence per hour, as defined per: Nsi Akoué et al., 2017).
243 We prepared 214 hair sections from 62 hair samples. We selected 3 to 12 hairs of
244 similar length, diameter and growth stage from each hair tuft and followed a sequential 245 sectioning protocol (see for details: Oelze, 2016). Each hair sample provided up to 12 246 different sections of 1cm (3.5 on average), which we sometimes combined to reach a 247 weight suitable for a single isotopic measurement. We aliquoted 200 µL of 46 blood 248 samples and freeze-dried these samples for 24h before analyses. Plants were dried the
249 day of collection and homogenized thereafter. Insects and mushrooms were frozen at -4 5 6 7 8 9 10 11 12 13 14 15 16 17 18 19 20 21 22 23 24 25 26 27 28 29 30 31 32 33 34 35 36 37 38 39 40 41 42 43 44 45 46 47 48 49 50 51 52 53 54 55 56 57 58
For Peer Review
250 20°C the day of collection, freeze-dried during 24h and then homogenized using a 251 pebble mill before analyses.
252 Hair sections (0.33 to 0.74 mg), blood (0.88 to 1.14 mg) and food samples (0.44 to 253 2.25mg) were weighed into tin capsules for isotopic measurements performed parallel
254 to the IAEA standards CH6, CH7, N1 and N2 in a FLASH HT Plus coupled to a MAT 255 253 IRMS (both by Thermo Scientific, Waltham, MA, USA) at the commercial 256 laboratory IsoDetect GmbH in Leipzig, Germany. Stable isotope ratios are expressed in
257 permil (‰) using the delta (δ) notation and are calibrated against the international 258 standard materials Vienna PeeDee Belemite (vPDB) for carbon and atmospheric N2
259 (AIR) for nitrogen. Analytical error calculated from repetitive measurements of 260 international and lab-internal standard materials in each run is less than 0.2‰ (2σ) for 261 δ15N and δ13C. Stable isotope ratios for hair sections, blood samples and food items are
262 hereafter referred to as δ13Chair, δ13Cblood, and δ13Cdiet as well as δ15Nhair, δ15Nblood, and
263 δ15N
diet. We removed one blood sample from the dataset because of its abnormally high
264 value of C:N ratio (5.10 against an average value=3.56±0.08). 265 Estimation of diet-tissue fractionation factors
266 Despite the small sample set we have for mandrill plant food items, we calculated
267 isotopic fractionation factors for both isotope systems (Δ15Nhair-diet and Δ13Chair-diet)
268 between broad categories of plant foods (reproductive parts vs. non-reproductive parts; 269 see: Table S1) and individual hair sections to obtain a broad impression of which plant 270 food category is relevant to mandrill diet and is reflected in hair isotope values. In 271 addition, this approach controls for baseline differences and allows to compare between
272 populations and sites with differing environmental conditions (Crowley et al., 2013; 273 Nakagawa et al., 2007; Oelze et al., 2016b).
4 5 6 7 8 9 10 11 12 13 14 15 16 17 18 19 20 21 22 23 24 25 26 27 28 29 30 31 32 33 34 35 36 37 38 39 40 41 42 43 44 45 46 47 48 49 50 51 52 53 54 55 56 57 58 59
For Peer Review
274 Statistical analyses
275 We conducted all statistical analyses in SAS Studio. To test for relationships between
276 isotopic values obtained from hair and blood samples representing the same individual 277 and the same time window, we used Pearson correlation tests. We used Linear Mixed
278 Models (LMM, proc GLIMMIX) and Linear Models (LM, proc GLM) with Gaussian 279 distributions to study the effects of seasonality and individual traits on both δ13C and 280 δ15N recorded in hair sections (LMM) and blood samples (LM). The normality of the
281 models’ residuals was systematically verified by visual inspection of the residuals’ 282 distribution in qq-plots and by conducting Kolmogorov-Smirnov tests. Note that in one
283 model (δ15Nhair), we removed six outlier samples to attain a Gaussian distribution of the
284 data (leverage test, proc robustreg). We used differences in least square means as post-285 hoc analyses for pairwise comparisons of categorical variables when appropriate. In all
286 our statistical models performed, we considered all first order interactions and kept the 287 full models as final models excluding only non-significant interactions (p>0.05).
288 We ran four independent models on the response valuables δ13Chair, δ15Nhair, δ13Cblood
289 and δ15Nblood to explore the effects of season, individual age and sex. We added the
290 factor hair sample as a random effect in the two models on hair isotope values to control
291 for pseudo-replication biases caused by multiple sampling of the hair tufts (Mundry and 292 Oelze, 2015). We did not consider individual as a random effect in the analyses based 293 on blood samples because only few animals out of our dataset were sampled more than 294 once (n=10).
295 We were unable to estimate mandrill hair growth rates, so we relied on human scalp hair
296 growth rates as a rough estimate (see discussion in: Oelze, 2016). Hence, for each hair 297 section analyzed, we calculated the corresponding time window based on a growth rate 4 5 6 7 8 9 10 11 12 13 14 15 16 17 18 19 20 21 22 23 24 25 26 27 28 29 30 31 32 33 34 35 36 37 38 39 40 41 42 43 44 45 46 47 48 49 50 51 52 53 54 55 56 57 58
For Peer Review
298 of 1 cm of hair per 30 days (Tobin, 2005), with the root date identical to the hair 299 collection date and the distal date corresponding to 30 days before.
300 In all four models we considered sex as a class variable and age as a continuous variable 301 (calculated at the distal date for hair and at the date of collection for blood). We
302 considered the effect of season as a class variable with two (blood) to three (hair) 303 modalities including a long rainy season, a long dry season, and the two short seasons 304 that we pooled together for the models based on hair because of limited sample sizes (7
305 samples only were collected during the small rainy season). In the models based on 306 blood, we considered the season at the exact date of sampling while in the models based
307 on hair, we considered the season at the distal date.
308 Food supplementation that occurred just before the beginning of sampling (early 2012) 309 may have impacted isotope values in the distal sections of long mandrills’ hair (the ones
310 spanning the supplementation period that ceased in April 2012). Although 311 supplementation only constituted a limited proportion of mandrills’ diet, we conducted
312 preliminary analyses by removing these potentially biased hair sections. We found 313 similar results to those obtained from full datasets and therefore chose to include these 314 samples in the final models.
315
316 Results
317 We obtained a total of 46 isotopic measurements for blood and 214 measurements in 318 hair sections. The δ13Chair values range from -26.1‰ to -24.0‰ (mean ± 1σ: -25.1 ±
319 0.3‰), slightly higher than δ13C
blood values which vary between -27.7‰ and -25.8‰
(-320 26.6 ± 0.4‰). The δ15Nhair values range from 4.21‰ to 7.8‰ (6.0 ± 0.5‰) while
4 5 6 7 8 9 10 11 12 13 14 15 16 17 18 19 20 21 22 23 24 25 26 27 28 29 30 31 32 33 34 35 36 37 38 39 40 41 42 43 44 45 46 47 48 49 50 51 52 53 54 55 56 57 58 59
For Peer Review
321 δ15Nblood values vary less and range between 5.6‰ and 7.5‰ (6.4±0.3‰). Isotopic
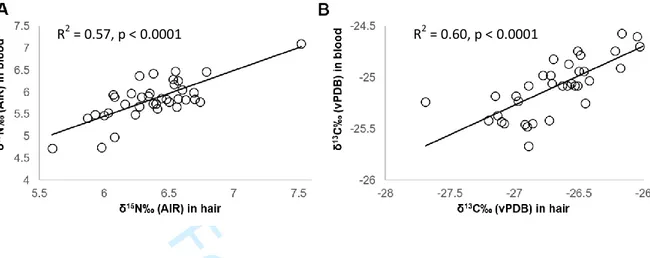
322 measurements retrieved from hair sections and blood samples collected from the same
323 individual on the same day (n=37) are significantly correlated (Figure S1). Despite the 324 small plant food dataset from the studied habitat, we can report that non-reproductive
325 plant parts (-32.2 ±3.0‰) yielded on average ~2‰ lower δ13C values than reproductive 326 plant parts (-30.3 ±2.6‰). In addition, δ15N values were on average higher in non-327 reproductive plant parts (6.0 ±3.8‰) than in reproductive plant parts (3.7±1.1‰). The
328 few arthropods we analyzed (ants, butterfly, caterpillar) did not have higher δ15N values 329 than plant foods (Table S1). Mean fractionation factors between mandrill hair and
330 reproductive plant parts, comprised by fruits, seeds and some flowers, resulted in mean 331 Δ15Nhair-fruit values of 2.3‰ and mean Δ13Chair-fruit values of 5.2‰. The calculated mean
332 fractionation values between mandrill hair and non-reproductive plant parts (leaves)
333 were 0.0‰ for Δ15Nhair-leaves and 7.1‰ for Δ13Chair-leaves.
334
335 Effect of season
336 In the δ13Cblood model, isotopic values were significantly higher during the rainy season
337 (see Table 1 for detailed statistical results; Figure 1A). In the δ13C
hair model, however,
338 the factor season was interacting with the predictors sex and age (Table 1). In females, 339 the lowest δ13C values of hair were found during the long rainy season, while we 340 observed exactly the reverse in males (Figure 2). Although the interaction between age 341 and season was not obvious, younger animals, especially males, tended to show higher 342 δ13C values of hair (Figure 2). The δ15N values of blood were significantly higher
343 during the long dry season compared to the long rainy season (Table 1; Figure 1B). By 344 contrast, the effect of seasonality was not captured by the δ15N values of hair (Table 1). 4 5 6 7 8 9 10 11 12 13 14 15 16 17 18 19 20 21 22 23 24 25 26 27 28 29 30 31 32 33 34 35 36 37 38 39 40 41 42 43 44 45 46 47 48 49 50 51 52 53 54 55 56 57 58
For Peer Review
345
346 Effects of individual age and sex
347 Individual age had a significant effect on δ13C values of blood which decreased with
348 mandrill’s age in male subjects (Table 1; Figure 3). Finally, we found significant 349 interactions between individual age and sex on δ15N values of blood and hair: older 350 males showed higher values than younger males and this age effect was not observed in 351 females (Table 1; Figure 4A and B).
352
353 Discussion
354 We here report the first isotopic study conducted on free ranging mandrills in which we 355 investigated effects of season and individual traits such as age and sex on feeding 356 behavior. The limited plant isotope data set allowed a glimpse into the natural isotopic 357 variation of food items in the mandrill habitat to understand how to interpret findings of
358 lower or higher isotope values across seasons and individuals. Similar to isotopic values 359 reported in several forests of Central and West African countries (Oelze et al., 2014; 360 Oelze et al., 2016b), the low δ13C values of the 14 plant species collected in the Lékédi 361 Park (mean: -31.3‰) indicate that mandrills’ habitat is similarly depleted in 13C as other 362 forest habitats in Gabon, such as Loango with a mean plant δ13C value of -30.5‰
363 (Oelze et al., 2014), although additional plant isotope data would be desirable to 364 confirm this finding.
365 The δ13C values of mandrills’ hair sections (-25.1±0.3‰) are within the range of those 366 obtained from hair of sympatric great apes also living in Gabon, namely central 367 chimpanzees (from -25.7‰ to -23.4‰) and lowland gorillas (from -27.1‰ to -24.5‰)
4 5 6 7 8 9 10 11 12 13 14 15 16 17 18 19 20 21 22 23 24 25 26 27 28 29 30 31 32 33 34 35 36 37 38 39 40 41 42 43 44 45 46 47 48 49 50 51 52 53 54 55 56 57 58 59
For Peer Review
368 from Loango National Park (Oelze et al., 2014). Similar to these species, mandrills live 369 in dense rainforest habitats strongly affected by the so called canopy effect (van der
370 Merwe and Medina, 1989). As expected, mandrills yielded much lower δ13C values than 371 those found in South African chacma baboons (ranging from -19.8‰ to -18.5‰) as
372 these baboons live in an open semiarid environment and ~20-30% of their diet is 373 comprised by C4 plants (Codron et al., 2006). Mandrills showed on average higher
374 δ15N
hair values (6.0±0.4‰) than chimpanzees and gorillas from Gabon (5.0‰ and 4.2‰,
375 resp.), which is well explained by the slightly lower mean δ15N value in plants from 376 Loango (4.2 at Lékédi vs. 3.3‰ at Loango; Oelze et al., 2014). These similarities with
377 other species in both isotope systems would suggest that the dietary pattern observed in 378 mandrills is comparable to the dietary niche of terrestrial great apes in other parts of 379 Gabon, particularly to the higher level of frugivory as seen in chimpanzees. While our
380 food item isotope dataset was too small to conduct dietary mixing models, at least the 381 fractionation factors we calculated between different plant categories and mandrills
382 seem to support this finding, as the relationship between mandrill hair and the different 383 plant foods found a better match between reproductive plant parts (fruits, seeds and 384 flowers) than it did with foliage. Δ13C
hair-fruit values between ~3 and 5‰ and Δ15Nhair-fruit
385 values between ~2 and 4‰ are reported for several populations of frugivorous great 386 apes in different regions of Africa (Oelze et al., 2016b). This very general observation is 387 well in line with direct observations of mandrill foraging behavior which suggests that 388 their diet consists of 70 to 90% of fruit (Nsi Akoue et al., 2017). For non-reproductive 389 plant parts (foliage) the fractionation values were either too low (0.0‰ Δ15N
hair-leaves) or
390 too high (7.1‰ Δ13Chair-leaves) to be considered reflecting foliage as a substantial dietary
391 contribution. However, this mismatch could also be related to a data bias introduced by 4 5 6 7 8 9 10 11 12 13 14 15 16 17 18 19 20 21 22 23 24 25 26 27 28 29 30 31 32 33 34 35 36 37 38 39 40 41 42 43 44 45 46 47 48 49 50 51 52 53 54 55 56 57 58
For Peer Review
392 using a very small and possibly not representative sample of leaves, that likely does not 393 encompass the full isotopic variation within non-reproductive plant parts in the
394 mandrills’ diet. Particularly leaves can vary substantially in their δ13C values depending 395 on whether they are sampled on the forest floor, understory or high up in the canopy
396 (Medina and Minchin, 1980; van der Merwe and Medina, 1991; Carlson and Kingston, 397 2014; Oelze et al., 2014, 2016a; Carlson and Crowley, 2016; Roberts et al., 2017), 398 which may make comparisons of hair-leave values less reliable than calculation
399 referring to reproductive plant parts alone (Oelze et al., 2016b).
400 We found some isotopic differences across seasons. We expected to find
401 isotopic variation in response to shifts in fruit availability between the dry and rainy 402 seasons. In Gabon, the rainy season generally corresponds to higher fruit availability 403 (White, 1994; but see: Head et al., 2011) and high fruit intake periods should be
404 associated with higher δ13C values (Cernusak et al., 2009; Oelze et al., 2014, 2016b). As 405 such, we found higher δ13C values of blood across all studied mandrills and also higher
406 δ13C values of hair in males during the long rainy season compared to the long dry 407 season. It remains unclear if this seasonal pattern in δ13C values could be related to 408 general seasonal changes within the δ13C values of plant food categories. Previous
409 research on primate forest plant foods did not suggest that seasonal variation is 410 considerable (Carlson and Kingston, 2014) and we thus did not systematically collect 411 samples from the same food plants across different seasons in this study.,
412 The δ13C values of hair in females did not follow this seasonal pattern in δ13C value, 413 possibly reflecting some sex-related differences in physiology or seasonal feeding
414 preferences. During the long dry season, most females are, indeed, cycling or are in 415 early pregnancy (see Figure 1 in: Dibakou et al., 2019), and the specific nutritional 4 5 6 7 8 9 10 11 12 13 14 15 16 17 18 19 20 21 22 23 24 25 26 27 28 29 30 31 32 33 34 35 36 37 38 39 40 41 42 43 44 45 46 47 48 49 50 51 52 53 54 55 56 57 58 59
For Peer Review
416 demands of maternal investment have been shown to affect the feeding behavior and 417 δ13C values of other large bodied primates (Oelze et al. 2016). The long dry season also
418 caused higher δ15N values in blood of the studied mandrills, although this season does 419 not correspond to the highest animal’s consumption in the studied population (Nsi
420 Akoué et al., 2017). This apparent contradictory finding probably results from highly 421 shifted δ15N values in adult male mandrills (see below).
422 Variation in δ13C values of blood was mainly predicted by age but not sex, whereas
423 δ15N variation was driven by the interaction between individual age and sex. In blood 424 and, to a lesser extent, in male hair section samples, the δ13C values were significantly
425 higher in young individuals compared to old mandrills. Given that variation in plant 426 δ13C values is primarily driven by canopy height (lower values in understory than in 427 canopy) and plant part (lower values in foliage than in fruit) in rainforest communities,
428 we can interpret higher δ13C values in young mandrills to be the result of consuming 429 significantly less low canopy plant foods and/or foliage, but more fruit from higher in
430 the canopy. Significant diet differences across age classes have been observed during 431 the long dry season in the studied mandrills. At this time of the year, interestingly, the 432 highest frequencies of fruit consumption was observed in juvenile males and adolescent
433 females (see Supplementary Information in: Nsi Akoué et al., 2017). Although, we 434 cannot comment further on this possible relationship, it seems puzzling as one may 435 predict that older, more experienced mandrills should be able to find ripe fruit better 436 than younger individuals. Alternatively, instead of high canopy fruit, the infrequent 437 consumption of C4 grasses may explain the higher δ13C values in young individuals.
438 However, we have little to no evidence that C4 grasses possibly available in the open
439 savanna patches are of any relevance to the mandrills feeding ecology. Finally, young 4 5 6 7 8 9 10 11 12 13 14 15 16 17 18 19 20 21 22 23 24 25 26 27 28 29 30 31 32 33 34 35 36 37 38 39 40 41 42 43 44 45 46 47 48 49 50 51 52 53 54 55 56 57 58
For Peer Review
440 mandrills were found, among others, to consume significantly more Ficus mucuso but 441 less Aframomum alboviolaceum than adults in the study population (Nsi Akoué et al.,
442 2017). While fruits of the former should result in high δ13C values, because they are 443 generally found high in the canopy, the latter should result in low δ13C values because it
444 is a terrestrial herbaceous species. These observations are consistent with our current 445 findings.
446 We anticipated to additionally find another effect of age on the dietary behavior of
447 mandrills as particularly older and reproductively active males may undergo periods of 448 nutritional stress during and around the mating season. An endocrinological study on
449 this mandrill population suggested high fecal glucocorticoid values in old males during 450 the mating season (long dry season) due to the influx of new competing males and 451 intense and aggressive male-male competition in this species (Charpentier et al., 2018).
452 This may suggest that older males undergo negative energy balance for several months 453 a year. Our models and the δ15N values obtained from both blood and hair sections
454 appear to support this assumption, with increasing δ15N values with age in males. We 455 assume that higher δ15N values in older males result from nutritional stress in response 456 to the intense male-male competition during the mating season. Mature male mandrills
457 fiercely fight over access to female and dedicate less time to feeding, resulting in higher 458 stress levels and negative energy balance (Charpentier et al., 2018). Adult males indeed 459 spend less time foraging compared to all other individuals (Nsi Akoué et al., 2017). The 460 δ15N values are known to increase in response to severe negative energy balance. When 461 basic metabolic requirements in nitrogen (protein) are not met through diet, it has to be
462 acquired from body own proteins through catabolism. Higher mobilization and 463 excretion of body own nitrogen then contributes to a reduction in body mass (Deschner 4 5 6 7 8 9 10 11 12 13 14 15 16 17 18 19 20 21 22 23 24 25 26 27 28 29 30 31 32 33 34 35 36 37 38 39 40 41 42 43 44 45 46 47 48 49 50 51 52 53 54 55 56 57 58 59
For Peer Review
464 et al., 2012). The reduction of net energy intake has to be substantial in order to lead to 465 reduction in body mass, and the condition has to be experienced for a prolonged period
466 of time in order to affect the animals physiology, nitrogen balance and in consequence 467 the bodies δ15N values (Barboza and Parker, 2006; Hobson et al., 1993). Changes in
468 δ15N values due to nutritional stress have rarely been shown in non-human and human 469 primates (Deschner et al., 2012; D’Ortenzio et al., 2015; Mekota et al., 2006, 2009). 470 This is the first study reporting isotopic evidence for nutritional stress in a free-ranging
471 primate supported by observational data, suggesting that nutritional stress experienced 472 by reproductive male mandrills is traceable using isotope analysis and worth future
473 more detailed investigation.
474 Finally, we anticipated to find slightly higher δ15N values in all females as compared to 475 all males. As the first direct observations of this population of mandrills suggested that
476 females consumed more animal food items than males (Nsi Akoue et al., 2017). 477 However, we found no support for this third prediction. We did not find higher δ15N
478 values in the three arthropods collected at the Lékédi Park than what we found in a 479 variety of plant foods (Table S1). Further, females did not show higher average δ15N 480 values than males across age classes. In fact, we found the opposite: females generally
481 showed slightly lower δ15N values than males, which we think is mainly driven by the 482 higher δ15N levels in productively active and thus nutritionally stressed male mandrills. 483 This is the first isotopic investigation conducted in a large population of free-ranging 484 mandrills. Our results partly confirm observational data, but also highlighted some 485 potential future avenues for behavioral research, particularly regarding dietary
486 differences between age classes as well as nutritional stress in reproductively active 4 5 6 7 8 9 10 11 12 13 14 15 16 17 18 19 20 21 22 23 24 25 26 27 28 29 30 31 32 33 34 35 36 37 38 39 40 41 42 43 44 45 46 47 48 49 50 51 52 53 54 55 56 57 58
For Peer Review
488 Acknowledgements
489 We thank past and present field assistants of the Mandrillus Project for their help in data
490 collection. We are grateful to Ilham Bentaleb for useful discussions regarding stable 491 isotopes. Alice Baniel also helped with data analyses. Laboratory analyses were
492 performed at the Plateforme d’Analyses Chimiques en Ecologie (PACE; Montpellier, 493 France), the Max Planck Institute for Evolutionary Anthropology (Leipzig, Germany) 494 and in the commercial laboratory IsoDetect GmbH (Leipzig, Germany). This study was
495 funded by a grant from the Deutsche Forschungsgemeinschaft grant (DFG, KA-1082-496 20-1), and from INEE-CNRS (“Station d’Etudes en Ecologie Globale” and a
497 “Laboratoire International Associé”) to MJEC. This is a Mandrillus Project publication 498 number 23 and a ISEM 2020-171 SUD.
499 4 5 6 7 8 9 10 11 12 13 14 15 16 17 18 19 20 21 22 23 24 25 26 27 28 29 30 31 32 33 34 35 36 37 38 39 40 41 42 43 44 45 46 47 48 49 50 51 52 53 54 55 56 57 58 59
For Peer Review
500 References
501 Abernethy, K.A., White, L.J.T., and Wickings, E.J. (2002). Hordes of mandrills
502 (Mandrillus sphinx): Extreme group size and seasonal male presence. Journal of 503 Zoology, 258, 131–137.
504 Barboza, P.S., & Parker, K.L. (2006). Body protein stores and isotopic indicators of N 505 balance in female reindeer (Rangifer tarandus) during winter. Physiological and
506 Biochemical Zoology, 79, 628–644.
507 Barnes, C., Sweeting, C.J., Jennings, S., Barry, J.T., & Polunin, N.V.C. (2007). Effect 508 of temperature and ration size on carbon and nitrogen stable isotope trophic
509 fractionation. Functional Ecology, 21, 356–362.
510 Beaulieu, M., Benoit, L., Abaga, S., Kappeler, P.M., & Charpentier, M.J.E. (2017). 511 Mind the cell: Seasonal variation in telomere length mirrors changes in leucocyte
512 profile. Molecular Ecology, 26, 5603–5613.
513 Blumenthal, S.A., Rothman, J.M., Chritz, K.L., & Cerling, T.E. (2016). Stable isotopic 514 variation in tropical forest plants for applications in primatology. American Journal of
515 Primatology, 78, 1041–1054.
516 Brockmeyer, T., Kappeler, P.M., Willaume, E., Benoit, L., Mboumba, S., & 517 Charpentier, M.J.E. (2015). Social organization and space use of a wild mandrill 518 (Mandrillus sphinx) group. American Journal of Primatology, 77, 1036–1048.
519 Carlson, B.A., & Crowley, B.E. (2016). Variation in carbon isotope values among 520 chimpanzee foods at Ngogo, Kibale National Park and Bwindi Impenetrable National 521 Park, Uganda. American Journal of Primatology, 78, 1031-1040.
522 Carlson, B.A., & Kingston, J.D. (2014). Chimpanzee isotopic ecology: A closed canopy 523 C3 template for hominin dietary reconstruction. Journal of Human Evolution, 76, 107– 524 115.
525 Cernusak, L.A., Tcherkez, G., Keitel, C., Cornwell, W.K., Santiago, L.S., Knohl, A., ...
526 Wright, I.J. (2009). Why are non-photosynthetic tissues generally 13C enriched 527 compared with leaves in C3 plants? Review and synthesis of current hypotheses. 528 Functional Plant Biology, 36, 199–213.
529 Clutton-Brock, T., & Janson, C. (2012). Primate socioecology at the crossroads: Past, 530 present, and future. Evolutionary Anthropology Issues News and Reviews, 21, 136–150. 531 Codron, D., Lee-Thorp, J.A., Sponheimer, M., de Ruiter, D., & Codron, J. (2006). Inter-
532 and intrahabitat dietary variability of chacma baboons (Papio ursinus) in South African 533 savannas based on fecal δ13C, δ15N, & %N. American Journal of Physical 534 Anthropology, 129, 204–214. 4 5 6 7 8 9 10 11 12 13 14 15 16 17 18 19 20 21 22 23 24 25 26 27 28 29 30 31 32 33 34 35 36 37 38 39 40 41 42 43 44 45 46 47 48 49 50 51 52 53 54 55 56 57 58
For Peer Review
535 Codron, D., Lee-Thorp, J.A., Sponheimer, M., de Ruiter, D., & Codron, J. (2008). What 536 insights can baboon feeding ecology provide for early hominin niche differentiation? 537 International Journal of Primatology, 29, 757–772.
538 Crowley, B.E. (2012). Stable isotope techniques and applications for primatologists. 539 International Journal of Primatology, 33, 673–701.
540 Crowley, B.E., Blanco, M.B., Arrigo-Nelson, S.J., & Irwin, M.T. (2013). Stable 541 isotopes document resource partitioning and effects of forest disturbance on sympatric
542 cheirogaleid lemurs. Naturwissenschaften, 100, 943–956.
543 Crowley, B.E., Reitsema, L.J., Oelze, V.M., & Sponheimer, M. (2015). Advances in 544 primate stable isotope ecology—Achievements and future prospects. American Journal
545 of Primatology, 78, 995-1003.
546 Dawson, T.E., Mambelli, S., Plamboeck, A.H., Templer, P.H., & Tu, K.P. (2002). 547 Stable isotopes in plant ecology. Annual Review of Ecology, Evolution, and Systematics,
548 33, 507–559.
549 DeNiro, M.J., & Epstein, S. (1978). Influence of diet on the distribution of carbon 550 isotopes in animals. Geochimica and Cosmochimica Acta, 42, 495–506.
551 DeNiro, M.J., & Epstein, S. (1981). Influence of diet on the distribution of nitrogen
552 isotopes in animals. Geochimica and Cosmochimica Acta, 45, 341–351.
553 Deschner, T., Fuller, B.T., Oelze, V.M., Boesch, C., Hublin, J.-J., Mundry, R., ... 554 Hohmann, G. (2012). Identification of energy consumption and nutritional stress by
555 isotopic and elemental analysis of urine in bonobos (Pan paniscus). Rapid 556 Communication in Mass Spectrometry, 26, 69–77.
557 D’Ortenzio, L., Brickley, M., Schwarcz, H., & Prowse, T. (2015). You are not what you
558 eat during physiological stress: Isotopic evaluation of human hair. American Journal of 559 Physical Anthropology, 157, 374–388.
560 Fahy, G.E., Richards, M., Riedel, J., Hublin, J.-J., & Boesch, C. (2013). Stable isotope
561 evidence of meat eating and hunting specialization in adult male chimpanzees.
562 Proceedings of the National Academy of Sciences, 110, 5829–5833.
563 Fourie, N.H., Brown, J.L., Jolly, C.J., Phillips-Conroy, J.E., Rogers, J., & Bernstein, 564 R.M. (2016). Sources of variation in hair cortisol in wild and captive non-human
565 primates. Zoology, 119, 119-125.
566 Fuller, B.T., Fuller, J.L., Sage, N.E., Harris, D.A., O’Connell, T.C., & Hedges, R.E.M. 567 (2004). Nitrogen balance and 15N: Why you’re not what you eat during pregnancy.
568 Rapid Communication in Mass Spectrometry, 18, 2889–2896.
569 Galbany, J., Romero, A., Mayo-Alesón, M., Itsoma, F., Gamarra, B., Pérez-Pérez, A., ... 570 Charpentier, M.J.E. (2014). Age-related tooth wear differs between forest and savanna
571 primates. PLoS ONE, 9(4), e94938. 4 5 6 7 8 9 10 11 12 13 14 15 16 17 18 19 20 21 22 23 24 25 26 27 28 29 30 31 32 33 34 35 36 37 38 39 40 41 42 43 44 45 46 47 48 49 50 51 52 53 54 55 56 57 58 59
For Peer Review
572 Harrison, M.J.S. (1988). The mandrill in Gabon’s rain forest - Ecology, distribution and 573 status. Oryx, 22, 218–228.
574 Head, J.S., Boesch, C., Makaga, L., & Robbins, M.M. (2011). Sympatric chimpanzees
575 (Pan troglodytes troglodytes) and gorillas (Gorilla gorilla gorilla) in Loango National 576 Park, Gabon: Dietary composition, seasonality, & intersite comparisons. International 577 Journal of Primatology, 32, 755–775.
578 Hobson, K.A., & Clark, R.G. (1992). Assessing avian diets using stable isotopes .1.
579 Turnover of C-13 in Tissues. Condor, 94, 181–188.
580 Hobson, K.A., Alisauskas, R.T., & Clark, R.G. (1993). Stable nitrogen isotope 581 enrichment in avian tissues due to fasting and nutritional stress - Implications for
582 isotopic analyses of diet. Condor, 95, 388–394.
583 Hoshino, J., Mori, A., Kudo, H., & Kawai, M. (1984). Preliminary report on the 584 grouping of mandrills (Mandrillus sphinx) in Cameroon. Primates, 25, 295–307.
585 Lahm, S.A. (1986). Diet and habitat preference of Mandrillus sphinx in Gabon: 586 Implications of foraging strategy. American Journal of Primatology, 11, 9–26.
587 Lambert, J.E., & Rothman, J.M. (2015). Fallback foods, optimal diets, & nutritional
588 targets: Primate responses to varying food availability and quality. Annual Review of
589 Anthropology, 44, 493–512.
590 Loudon, J.E., Grobler, P., Sponheimer, M., Moyer, K., Lorenz, J.G., & Turner, T.R. 591 (2014). Using the stable carbon and nitrogen isotope compositions of vervet monkeys
592 (Chlorocebus pygerythrus) to examine questions in ethnoprimatology. PLoS One, 9, 593 e100758.
594 McGraw, W.S., & Daegling, D.J. (2012). Primate feeding and foraging: Integrating
595 studies of behavior and morphology. Annual Review of Anthropology, 41, 203–219. 596 Medina, E., & Minchin, P. (1980). Stratification of d13C values of leaves in Amazonian 597 rain forests. Oecologia, 45, 377–378.
598 Mekota, A.M., Grupe, G., Ufer, S., & Cuntz, U. (2006). Serial analysis of stable
599 nitrogen and carbon isotopes in hair: Monitoring starvation and recovery phases of 600 patients suffering from anorexia nervosa. Rapid Communication in Mass Spectrometry, 601 20, 1604–1610.
602 Mekota, A.M., Grupe, G., Ufer, S., & Cuntz, U. (2009). Identifying starvation episodes 603 using stable isotopes in hair Forensic approach on serial hair analysis. Rechtsmedizin, 604 19, 431–438.
605 van der Merwe, N.J., & Medina, E. (1989). Photosynthesis and 13C12C ratios in 606 Amazonian rain forests. Geochimica and Cosmochimica Acta, 53, 1091–1094.
607 van der Merwe, N.J., & Medina, E. (1991). The canopy effect, carbon isotope ratios and
4 5 6 7 8 9 10 11 12 13 14 15 16 17 18 19 20 21 22 23 24 25 26 27 28 29 30 31 32 33 34 35 36 37 38 39 40 41 42 43 44 45 46 47 48 49 50 51 52 53 54 55 56 57 58
For Peer Review
609 Mundry, R., & Oelze, V.M. (2015). Who is who matters - The effects of 610 pseudoreplication in stable isotope analyses. American Journal of Primatology, 78, 611 1017-1030.
612 Nakagawa, M., Hyodo, F., & Nakashizuka, T. (2007). Effect of forest use on trophic 613 levels of small mammals: An analysis using stable isotopes. Canadian Journal of 614 Zoology, 85, 472–478.
615 Nardoto, G.B., Ometto, J.P.H.B., Ehleringer, J.R., Higuchi, N., Bustamante, M.M.D.C.,
616 & Martinelli, L.A. (2008). Understanding the influences of spatial patterns on N 617 availability within the Brazilian Amazon forest. Ecosystems, 11, 1234–1246.
618 Nsi Akoue, G., Mbading-Mbading, W., Willaume, E., Souza, A., Mbatchi, B., &
619 Charpentier, M.J.E. (2017). Seasonal and individual predictors of diet in a free-ranging 620 population of mandrills. Ethology, 123, 600–613.
621 O’Connell, T.C., & Hedges, R.E. (1999). Investigations into the effect of diet on
622 modern human hair isotopic values. American Journal of Physical Anthropology, 108, 623 409–425.
624 Oelze, V.M. (2016). Reconstructing temporal variation in great ape and other primate
625 diets: A methodological framework for isotope analyses in hair. American Journal of
626 Primatology, 78, 1004–1016.
627 Oelze, V.M., Fuller, B.T., Richards, M.P., Fruth, B., Surbeck, M., Hublin, J.-J., & 628 Hohmann, G. (2011). Exploring the contribution and significance of animal protein in
629 the diet of bonobos by stable isotope ratio analysis of hair. Proceedings of the National 630 Academy of Sciences, 108, 9792–9797.
631 Oelze, V.M., Head, J.S., Robbins, M.M., Richards, M., & Boesch, C. (2014). Niche
632 differentiation and dietary seasonality among sympatric gorillas and chimpanzees in 633 Loango National Park (Gabon) revealed by stable isotope analysis. Journal of Human 634 Evolution, 66, 95–106.
635 Oelze, V.M., Douglas, P.H., Stephens, C.R., Surbeck, M., Behringer, V., Richards,
636 M.P., ... Hohmann, G. (2016a). The steady state great ape? Long term isotopic records 637 reveal the effects of season, social rank and reproductive status on bonobo feeding 638 behavior. PLoS ONE, 11, 1–17.
639 Oelze, V.M., Fahy, G., Hohmann, G., Robbins, M.M., Leinert, V., Lee, K., ... Kühl, 640 H.S. (2016b). Comparative isotope ecology of African great apes. Journal of Human 641 Evolution, 101, 1–16.
642 Peignot, P., Charpentier, M.J.E., Bout, N., Bourry, O., Massima, U., Dosimont, O., ... 643 Wickings, E.J. (2008). Learning from the first release project of captive-bred mandrills 644 Mandrillus sphinx in Gabon. Oryx, 42, 122–131.
645 Roberts, P., Blumenthal, S.A., Dittus, W., Wedage, O., & Lee-Thorp, J.A. (2017). 646 Stable carbon, oxygen, and nitrogen, isotope analysis of plants from a South Asian 4 5 6 7 8 9 10 11 12 13 14 15 16 17 18 19 20 21 22 23 24 25 26 27 28 29 30 31 32 33 34 35 36 37 38 39 40 41 42 43 44 45 46 47 48 49 50 51 52 53 54 55 56 57 58 59
For Peer Review
647 tropical forest: Implications for primatology. American Journal of Primatology, 79, 648 e22656.
649 Rogers, M.E., Abernethy, K.A., Fontaine, B., Wickings, E.J., White, L.J.T., & Tutin,
650 C.E.G. (1996). Ten days in the life of a mandrill horde in the Lopé Reserve, Gabon. 651 American Journal of Primatology, 40, 297–313.
652 Sandberg, P.A., Loudon, J.E., & Sponheimer, M. (2012). Stable Isotope Analysis in 653 Primatology: A Critical Review. American Journal of Primatology, 74, 969-989.
654 van Schaik, C.P. (1989). The ecology of social relationships amongst female primates. 655 In V. Standen & Foley R.A. (Eds.), Comparative socioecology: The behavioural 656 ecology of humans and other mammals (pp. 195-218). Oxford, UK: Blackwell.
657 Schoeninger, M.J., Most, C.A., Moore, J.J., & Somerville, A.D. (2015). Environmental 658 variables across Pan troglodytes study sites correspond with the carbon, but not the 659 nitrogen, stable isotope ratios of chimpanzee hair. American Journal of Primatology,
660 78, 1055-1069.
661 Schwertl, M., Auerswald, K., & Schnyder, H. (2003). Reconstruction of the isotopic 662 history of animal diets by hair segmental analysis. Rapid Communication in Mass
663 Spectrometry, 17, 1312–1318.
664 Sealy, J.C., van der Merwe, N.J., Thorp, J.A.L., & Lanham, J.L. (1987). Nitrogen 665 isotopic ecology in southern Africa: Implications for environmental and dietary tracing. 666 Geochimica and Cosmochimica Acta, 51, 2707–2717.
667 Sponheimer, M., Loudon, J.E., Codron, D., Howells, M.E., Pruetz, J.D., Codron, J., ... 668 Lee-Thorp, J.A. (2006). Do “savanna” chimpanzees consume C-4 resources? Journal of 669 Human Evolution, 51, 128–133.
670 Sterck, E.H., Watts, D.P., & Van Schaik, C.P. (1997). The evolution of female social 671 relationships in nonhuman primates. Behavioral Ecology and Sociobiology, 41, 291– 672 309.
673 Tieszen, L.L. (1991). Natural variations in the carbon isotope values of plants:
674 implications for archaeology, ecology and paleoecology. Journal of Archaeological 675 Science, 18, 227–248.
676 Tieszen, L.L., Senyimba, M.M., Imbamba, S.K., & Troughton, J.H. (1979). The
677 distribution of C3 and C4 grasses and carbon isotope discrimination along an altitudinal 678 and moisture gradient in Kenya. Oecologia, 37, 337–350.
679 Tobin, D.J. (2005). The biogenesis and growth of hair. In D.J. Tobin (Ed.), Hair in
680 Toxycology. An Important Bio-Monitor (pp. 3–33). Cambridge, UK: The Royal Society 681 of Chemistry.
682 Tutin, C.E.G., & Fernandez, M. (1993). Composition of the diet of chimpanzees and
683 comparisons with that of sympatric lowland gorillas in the Lopé reserve, Gabon. 4 5 6 7 8 9 10 11 12 13 14 15 16 17 18 19 20 21 22 23 24 25 26 27 28 29 30 31 32 33 34 35 36 37 38 39 40 41 42 43 44 45 46 47 48 49 50 51 52 53 54 55 56 57 58
For Peer Review
685 White, C.D., & Schwarcz, H.P. (1994). Temporal trends in stable isotopes for Nubian 686 mummy tissues. American Journal of Physical Anthropology, 93, 165–187.
687 White, L.J.T. (1994). Patterns of fruit-fall phenology in the Lopé Reserve, Gabon.
688 Journal of Tropical Ecology, 10, 313-322. 4 5 6 7 8 9 10 11 12 13 14 15 16 17 18 19 20 21 22 23 24 25 26 27 28 29 30 31 32 33 34 35 36 37 38 39 40 41 42 43 44 45 46 47 48 49 50 51 52 53 54 55 56 57 58 59
For Peer Review
689 Table 1: Results of the four Mixed Models on the responses of δ15N and δ13C in hair 690 sections and blood samples, with the fixed effects of the season, individual age and sex.
Response Sample sizes Fixed effects Statistics p-value δ13C
hair 214 hair sections Season F=3.82 0.024
62 hair samples 37 individuals Age Sex F=13.22 F=5.00 <0.001 0.027 Sex*Season F=3.33 0.039 Age*Season F=3.06 0.050 δ13C blood Season F=21.52 <0.001 Age F=8.09 0.007 46 blood samples 36 individuals Sex F=0.73 0.400 δ15N hair Season F=0.93 0.400 Age F=2.23 0.140 208 hair sections 61 hair samples 37 individuals Sex F=4.34 0.004 Sex*Age F=6.51 0.012 δ15N blood Season F=33.55 <0.001 Age F=7 <0.001 Sex F=8.46 0.006 46 blood samples 36 individuals Sex*Age F=24.58 <0.001 4 5 6 7 8 9 10 11 12 13 14 15 16 17 18 19 20 21 22 23 24 25 26 27 28 29 30 31 32 33 34 35 36 37 38 39 40 41 42 43 44 45 46 47 48 49 50 51 52 53 54 55 56 57 58
For Peer Review
692 Figure captions
693
694 Figure 1: Whisker boxplots with median, upper/lower quartiles and min/max ranges 695 illustrating the effect of seasonal differences in mandrill isotope values between the long
696 dry and the long rainy seasons revealed by the δ13C (A) and δ15N (B) values of mandrill 697 blood.
698
699 Figure 2: Whisker boxplots with median, upper/lower quartiles and min/max ranges 700 illustrating the effect of seasonal differences in mandrill δ13C values of hair by sex (A:
701 males, B: females) and age class (young <10 years, old> 10 years). Two age classes 702 were defined here for the sake of clarity, although age was considered as a continuous 703 predictor in our statistical models.
704
705 Figure 3: Scatter plot showing the relationship between individual age and δ13C values
706 of blood. 707
708 Figure 4: Scatter plots showing the relationships between individual age in years and
709 δ15N values in mandrill hair (grey symbols) and blood (black symbols) separate for 710 males (A) and females (B).
4 5 6 7 8 9 10 11 12 13 14 15 16 17 18 19 20 21 22 23 24 25 26 27 28 29 30 31 32 33 34 35 36 37 38 39 40 41 42 43 44 45 46 47 48 49 50 51 52 53 54 55 56 57 58 59
For Peer Review
Research Highlights
Stable isotope analyses of hair and blood have the potential to provide short and long-term data on how individual diets may shift over the season and with individual traits. Dietary patterns differ across seasons, between sexes as well as between young and
older mandrills.
Mature and reproductively active male mandrills showed the highest nitrogen isotope values as a result of nutritional stress possibly associated to intense male-male competition in this species.
This is the first study showing isotopic evidence for nutritional stress in a free-ranging primate species. 4 5 6 7 8 9 10 11 12 13 14 15 16 17 18 19 20 21 22 23 24 25 26 27 28 29 30 31 32 33 34 35 36 37 38 39 40 41 42 43 44 45 46 47 48 49 50 51 52 53 54 55 56 57 58
For Peer Review
201x178mm (150 x 150 DPI) 4 5 6 7 8 9 10 11 12 13 14 15 16 17 18 19 20 21 22 23 24 25 26 27 28 29 30 31 32 33 34 35 36 37 38 39 40 41 42 43 44 45 46 47 48 49 50 51 52 53 54 55For Peer Review
227x177mm (150 x 150 DPI) 4 5 6 7 8 9 10 11 12 13 14 15 16 17 18 19 20 21 22 23 24 25 26 27 28 29 30 31 32 33 34 35 36 37 38 39 40 41 42 43 44 45 46 47 48 49 50 51 52 53 54For Peer Review
178x118mm (150 x 150 DPI) 4 5 6 7 8 9 10 11 12 13 14 15 16 17 18 19 20 21 22 23 24 25 26 27 28 29 30 31 32 33 34 35 36 37 38 39 40 41 42 43 44 45 46 47 48 49 50 51 52 53 54 55For Peer Review
353x132mm (150 x 150 DPI) 4 5 6 7 8 9 10 11 12 13 14 15 16 17 18 19 20 21 22 23 24 25 26 27 28 29 30 31 32 33 34 35 36 37 38 39 40 41 42 43 44 45 46 47 48 49 50 51 52 53 54For Peer Review
Supplementary information:
Figure S1: The δ13C (A) and δ15N (B) values measured in hair sections and blood samples, each obtained from the same individuals calculated to be representing overlapping time windows (n=37
samples). Blood and hair isotope values are significantly correlated.
R2 = 0.57, p < 0.0001 R2 = 0.60, p < 0.0001 4 5 6 7 8 9 10 11 12 13 14 15 16 17 18 19 20 21 22 23 24 25 26 27 28 29 30 31 32 33 34 35 36 37 38 39 40 41 42 43 44 45 46 47 48 49 50 51 52 53 54 55 56 57 58 59