Food Hydrocolloids 100 (2020) 105416
Available online 3 October 2019
0268-005X/© 2019 Elsevier Ltd. All rights reserved.
Optimising functional properties and chemical composition of Pinus
halepensis Mill. Seeds protein concentrates
Amina Abbou
a,**, Nabil Kadri
b,c,*, Farid Dahmoune
b,c, Achour Chergui
b,d, Hocine Remini
b,c,
Farida Berkani
a, Khadidja Adel
a,b, Farid Boukhalfa
c, Khodir Madani
caLaboratoire de Gestion et Valorisation des Ressources Naturelles et Assurance Qualit�e, Facult�e des Sciences de la Nature et de la Vie et Sciences de la Terre (LGVRNAQ), Universit�e de Bouira, 10000, Bouira, Algeria
bD�epartement de Biologie, Facult�e des Sciences de la Nature et de la Vie et Sciences de la Terre, Universit�e de Bouira, 10000, Bouira, Algeria
cLaboratoire de Biochimie, Biophysique, Biomath�ematiques et Scientom�etrie (L3BS), Facult�e des Sciences de la Nature et de la Vie, Universit�e de Bejaia, 06000, Bejaia, Algeria
dLaboratoire de Biochimie Analytique et Biotechnologies LABAB, Universit�e Mouloud Mammeri, 15000, Tizi-Ouzou, Algeria
A B S T R A C T
Vegetable proteins are widely used in many food formulations due to their physico-chemical properties, low cost and availability. The main objective of this work is to study the chemical composition and properties of a protein concentrate of Pinus halepensis. Mill seeds (PHPC) and mainly to optimize the effect of pH, NaCl concentration and phosphate buffer (PB) molarity on functional properties (solubility, emulsifying activity index (EAI) and foaming capacity (FC)) of this concentrate by response surface methodology (RSM). The chemical composition was determined in terms of proteins, sugars, lipids, ash and moisture. The physico-chemical characteristics were studied by their water and oil holding capacity (OHC, WHC) and their surface hydrophobicity (SH). Finally, the functional properties of PHPC were studied in terms of solubility, EAI, FC, minimum gelling concentration (MGC) and finally heat coagulability (HC). A PHPC yield of 36.66 � 0.7% was obtained. The WHC and OHC was 3.89 g water/g PHPC and 3.54 g oil/g PHPC respectively and a SH of 87.09 � 0.78 was obtained. The optimization results showed that the optimal conditions for solubility, EAI and FC were: pH:10.88, NaCl:0 g/l, PB:0.078 M; pH:12, NaCl:0.55 g/l, PB:0.1M and pH:2, NaCl:0, PB:0 M respectively, having given a solubility of 87.13 � 0.14%, an EAI of 36.82 � 0.34 and a FC of 182.72. Then, the desirability of the three responses (solubility, EAI and FC) which was pH:12, NaCl: 0.55 g/l and PB of 0.1M was used to assess the stability of EAI and FC, to determine the MGC and HC. This study shows that Aleppo pine seeds are a good source of functional proteins, potentially applicable in the food industry and that pH, NaCl concentration and PB molarity have a major influence on functional properties.
1. Introduction
Vegetable proteins are a very good alternative to animal proteins whether for food or cosmetic application, because of their low cost, abundance and diversity of their sources (legumes, cereals and oilseeds), their adequate quality and nutritional value, their ease of digestion, their non-toxicity and finally for their functionality (S. Damodaran, 2000, p. 384; Rodrigues, Coelho, & Carvalho, 2012; Soria-Hern�andez, Serna-Saldívar, & Chuck-Hern�andez, 2015).
In America, 60% of the population relies heavily on the protein content of food when choosing their product, because among the three primary metabolites (carbohydrates, proteins and fats), proteins are the most beneficial for their health. Most adults perceive proteins as the most energy-efficient ingredient that is very healthy and improves
muscle tone. They are macronutrients most considered in weight man-agement diets (Cheatham, 2014).
In recent years, oilseed proteins have made a very significant contribution to protein intake in the diet. In 2004/2005, 380 million tonnes of oleaginous plants were produced and 207 million tonnes of protein meals were produced worldwide (Ash, Dohlman, & Davis, 2006).
The most commonly used proteins of oleaginous origin are that of soybean, peanut and rapeseed for their functionalities in food processing (additives and the protein film industry). With the awareness of their usefulness and therefore the increase in needs, new sources have been developed, such as cashew nut (Ogunwolu, Henshaw, Mock, Santros, & Awonorin, 2009), milk weed (Hojilla-Evangelista, Evangelista, & Victor Wu, 2009) and almost all oilseeds. Pinus halepensis Mill seeds, come from
* Corresponding author. D�epartement de Biologie, Facult�e des Sciences de la Nature et de la Vie et Sciences de la Terre, Universit�e de Bouira, 10000, Bouira, Algeria.
** Corresponding author.
E-mail addresses: minabbou20@gmail.com (A. Abbou), kadri.montp2@gmail.com (N. Kadri).
Contents lists available at ScienceDirect
Food Hydrocolloids
journal homepage: http://www.elsevier.com/locate/foodhyd
https://doi.org/10.1016/j.foodhyd.2019.105416
a very abundant tree belonging to the Pinaceae family which can found on all the Mediterranean relief especially in Algeria and Tunisia (Maestre, Cortina, Bautista, & Bellot, 2003). The bible’s manual of medicinal plants reports that they have been used extensively in pastry making, especially in Tunisia, and are also used to cure diabetes and sexual weakness in the eastern region of the Mediterranean (Schiller, 2014). Kadri et al. (2015) studied the chemical composition of its seeds and found a protein percentage of 26.62 � 0.129 which is a very high percentage especially compared to other species Pinus pinea L., Pinus
pinaster and Pinus canariensis.
Functional proteins are those that when added to food, confer nutritional, sensory, physico-chemical and organoleptic properties (color, texture, flavor …). Functional properties could be classified ac-cording to their physico-chemical mechanisms as follows: hydration properties (water/oil retention and solubility) rheological properties (viscosity, elasticity, aggregation and gelation), and protein surface properties (emulsifying and foaming activities, surface hydrophobicity and whipping) (Moure, Sineiro, & Domı́nguez, 2001).
Food applications of proteins is limited by their low solubility (Moure, Sineiro, & Domı́nguez, 2001), it is known that the pH, presence or absence of salts and its concentration and thus the ionic strength of the medium, as well as electrostatic repulsions influence the functional properties of proteins (Soria-Hern�andez et al., 2015). For this purpose and taking into account that according to the databases consulted, no studies were carried out on the functional properties of Aleppo pine seed proteins, the physico-chemical characteristics of P. halepensis Mill. Seed concentrated proteins (PHPC) (approximate composition, water and oil holding capacity (WHC and OHC), surface hydrophobicity (SH)) were determined and the solubility, emulsifying activity index (EAI) and foaming capacity (FC) conditions were optimized using the Box Behnken Design (BBD) by the response surface methodology, to study the effect of the parameters considered (pH, NaCl concentration and phosphate buffer molarity) on each of the responses and the relationship between solubility and functional activities. Then the heat coagulability (HC) and the minimum gelling concentration (MGC) were determined under optimal conditions.
2. Material and methods 2.1. Plant material
The seeds of Aleppo pine (Pinus halepensis Mill.) were obtained from the Collo forest located in Skikda province of Alg�eria in May 2018. They were cleaned with bidistilled water; dried in an oven at 40 �C for 2 days
and then finely crushed using an electric grinder (KIKA Labortech-nik M20, Germany) until it became a fine powder (<250 μm) which was
delipidated by the Soxhlet method with petroleum ether.
2.2. Preparation of the protein concentrate
A mass of 10 g of delipidated powder was macerated under stirring for 20 min at room temperature. After filtration and centrifugation at 4 �C for 20 min at 6000 rpm, the supernatant was filtered again and its
pH was adjusted to 6 (with 0.1 M HCl), CaCl2 was added gradually until
a concentration of 1 M, then centrifuged at 6000 rpm for 20 min. Finally, the recovered pellet was washed with distilled water and freeze-dried (Rotimi E Aluko, McIntosh, & Katepa-Mupondwa, 2005).
2.3. Chemical composition and yield
The extraction yield was expressed by the ratio of the amount of extract to the amount of defatted powder used. Ash, moisture and fat were determined according to AOAC (1998) methods, the protein con-tent was determined by the Bradford (1976) method and the carbohy-drates content was carried out by the Dubois, Gilles, Hamilton, Rebers, and Smith (1956) method using BSA and glucose for calibration curves
respectively.
2.4. Water and oil holding capacity (WHC/OHC)
The Tan, Ying-Yuan, and Gan (2014) method was used to determine the capacity of the extract to retain water or oil. For this purpose, 100 mg of extract was suspended with the same amount of water or sunflower oil (1.5 ml), vortexed for 1 min, and then centrifuged at 3000 rpm for 20 min. The water and oil retention capacity was expressed in gram of water or oil retained per gram of extract.
2.5. Surface hydrophobicity (SH)
The bromophenol blue (BPB) binding method was used to study the surface hydrophobicity of the protein concentrate. A volume of 1 ml of protein concentrate suspension (5 mg/ml in 20 mM PB at pH 7) was added to 200 μl of BPB solution (1 mg/ml in distilled water). The
mixture was vortexed for 10 min and directly centrifuged at 3000 rpm for 15 min. Finally, the supernatant absorbance was read at 595 nm. A control containing 1 ml of PB (20 mM, pH 7) and 200 μl of BPB solution
was used (Mune & Sogi, 2016). The surface hydrophobicity is according to the following formula:
SH (%) ¼ BPB bound (%) ¼ (Absorbance control – Absorbance sample)/ Absorbance control X 100
2.6. Optimization of solubility conditions of PHPC and its functional properties
Before optimization of solubility conditions, three parameters (pH, NaCl concentration and PB molarity) were studied separately in the single-factor experiment, keeping the variables that were not studied constant each time in order to limite overall experimental work. After statistical analysis of the results of this preliminary study, three variables were selected as significant factors and three levels were used for each one. The study intervals were also determined for each parameter and then the response surface based on the Box Behnken Design was designed to obtain the conditions giving the best solubility, EAI and FC.
2.6.1. Protein solubility
A mass of 100 mg of PHPC was dispersed in 10 ml of different solu-tions prepared at the pH, NaCl concentration and molarity of PB determined according to the design of experiment. The dispersions were vortexed well for 15 min then centrifuged at 3000 g for 20 min. The protein content of the supernatant was determined by the Lowry method (Peterson, 1977) and the solubility was calculated as follows: Solubility (%) ¼ Protein content of supernatant x 100 /Total protein content
Total protein content represents 100% solubility and is determined in 3% NaOH (Chao, Jung, & Aluko, 2018).
2.6.2. Emulsifying properties
The emulsifying properties of the PHPC were determined using the method reported by Boye et al. (2010). A volume of 45 ml of protein solution (0.5% in different solution of pH, NaCl and PB) was added into 15 ml of sunflower oil. After homogenization of the emulsion with an ultra turrax (IKA T25, Staufen, Germany) for 1 min at 20,000 rpm, 50 μL
of the prepared solution were diluted in 5 ml of sodium dodecyl sulfate (SDS) at 0.1%. Finally, the absorbance was recorded at 500 nm. The EAI was calculated using following equation:
EAI (m2/g) ¼ 2 � 2303 � A0 �DF /C � ϕ � 10,000
where A0 is the absorbance of the emulsion after emulsification, DF is
the volume fraction of the oil in the emulsion.
2.6.3. Foaming properties
Foaming capacity of PHPC was determined according to the method of Shahidi, Han, and Synowiecki (1995). A volume of 20 ml of protein concentrate solution at 0.1% (W/V) was homogenized using a Mouli-nex_R62 homogenizer to incorporate the air for 1 min at room temper-ature (25 � 1 �C). The FC was expressed as percentage of volume
increase after homogenization, which was calculated according to the following equation:
FC (%) ¼ ((volume after whipping volume before whipping) / volume before whipping) � 100
2.6.3.1. Experimental design. To optimize the factors affecting
solubili-zation, foam capacity and emulsifying activity, the response surface methodology (RSM) with Box Behnken Design was studied using Min-atab 17 (statistical analysis system Inc., SAS) software and the experi-mental values obtained for solubility, EAI and FC were compared to their values predicted based on the t-test (p < 0.05) (Table 8). In this study, fifteen tests were performed with the different values of pH (2, 7, 12), NaCl concentration (0, 0.275, 0.55 g/ml), and PB concentration (0, 0.05, 0.1 M) as shown in Table 2. The values were coded as follows: (þ1) maximum value, (0) central value and ( 1) minimum value. The experimental data were adjusted to a second order polynomial model and expressed by following equation:
Y ¼ B0þ Xk i¼1 BiXiþ Xk i¼1 BiiX2iþ Xk i>jk BijXiXj
B0 (constant coefficient); Bi, Bii, Bij (regression coefficients for
inter-cepting, linear, quadratic and interaction terms, respectively); xi and xj (independent variables); k (number of optimized factors).
2.6.3.2. Validation of model. In order to draw conclusions from the
validation of the model, the Minitab software provides the optimal conditions of the three factors (pH, NaCl, PB) from the three responses designed. The optimums responses obtained were used to test solubility, FC and EAI. Finally, the experimental optimums of each obtained response were verified by comparing them with the predicted values.
After optimization and validation of the experimental design, a compromise solution was obtained by using the desirability function. The desirability is an important function when multiple response opti-mization was carried out because it’s not possible to optimize each one in separate way. For that, the overall solution must be included in optimal region leading to a certain degree of compliance with the pro-posed criteria for each variable of the system; namely, a compromise solution must be found. Desirability (d) always takes values between 0 and 1, where D ¼ 0 for an undesirable response, and d ¼ 1 represents a completely desirable value (Candioti, De Zan, Camara, & Goicoechea, 2014). The stability of the functional properties studied (FC and EAI) after 15, 30, 45 and 60 min and other functional properties (MGC and HC) were tested at the optimal conditions obtained by desirability.
2.7. Stabilisation of foaming and emulsifying properties
To study the kinetic of the foaming and emulsifying activities depending on the time (15, 30, 45 and 60 min), the PHPC solution was prepared with the optimum of pH, NaCl and PB concentrations. The stability is expressed as a percentage of remaining of these two prop-erties (Boye et al., 2010; Shahidi et al., 1995).
2.8. Minimum gelling concentration (MGC)
The method of O’Kane, Vereijken, Gruppen, and Van Boekel (2005)
was used to determine the MGC with a slight modification. A volume of 5 ml of PHPC solution was prepared at the concentrations of 4–18% (w/v) and then heated in water bath at 95 �C for 10 min (in sealed tubes
to avoid evaporation). After cooling, the tubes were placed at 4 �C for
12 h and then inverted. The MGC is the smallest concentration from which the contents of the inverted tube do not flow.
2.9. Heat coagulability (HC)
For Heat Coagulability (HC), the solubility method described above was used, the suspension of PHPC under optimal conditions was vor-texed and the proteins of the supernatant were measured by the Lowry method. An aliquot of the supernatant was heated in a water bath at 100 �C for 30 min. After cooling and centrifugation at 3000 rpm for
15 min, a filtration was carried out on Whatman No. 2 filter paper, and concentration of proteins in the filtrate were again determined by the same method (Voutsinas, Nakai, & Harwalkar, 1983). The HC of the sample was calculated from the following equation:
% Heat Coagulability ¼ Ps – Pf / Ps � 100 where:
Ps ¼ % protein in supernatant Pf ¼ % protein in filtrate
3. Results and discussion 3.1. Proximate composition
As shown in Table 3, the extraction yield of PHPC was 36.66 � 0.7%, of which approximately 69.33 � 0.3% are proteins. Among the impu-rities, we found sugars representing 2 � 0.2%, which can be justified by the presence of glycoproteins also reported by Kadri et al. (2015) and minerals (ash) found in the proportion of 4.9%. However, the lipids were found only in trace form, which confirms the good delipidation of the powder before extraction. The moisture test revealed a level of 2.4 � 0.2% which is comparable to lyophilized extract dried by other methods such as Bambara concentrate in which the moisture content is of the order of 4% (Adeleke, Adiamo, & Fawale, 2018).
3.2. Water and oil holding capacities (WHC/OHC) and surface hydrophobicity
3.2.1. Water and oil holding capacities (WHC/OHC)
The Water and oil holding capacities of PHPC were evaluated and the results are represented in Table 4. The amount of water and oil that binds BPB depends on the polar and non-polar, ionized or deionized groups of proteins (Ghribi et al., 2015) and these properties mean that these proteins can be used as an additive to improve food quality (Tontul, Kasimoglu, Asik, Atbakan, & Topuz, 2018).
In our study, the WHC of PHPC was found at 3.89 g water/g PHPC (Table 4). This is in agreement with the WHC range of products with water retention capacity (1.49–4.71) (Kaur & Singh, 2007). This ca-pacity can be explained by the large particle size of the extract as well as
Table 1
Solubility, emulsifying activity index and foaming capacity of PHPC on distilled water.
Functional properties
Solubility 27.02 � 0.52
EAI 20.89 � 0.24
Foaming capacity 61.66 � 0.66
the capacity of the sugar and fibers found in the concentrate as impu-rities which are known for this capacity (Zhao et al., 2012). The capacity of this extract is greater than that of most protein extracts reported by the bibliography, for example, WHC chickpea protein concentrates were found at 3.65 for freeze-dried extract and in agreement with that found for rapeseed protein isolate (3.85 g water/g extract) (Yoshie-Stark, Wada, Schott, & W€asche, 2006). Therefore, this extract can be used as an additive for viscous foods (Aletor, Oshodi, & Ipinmoroti, 2002).
The oil retention capacity was found in 3.54 g oil/g extract (Table 4), This is in the range of literature values (1.1–4.1) (Kaur et al., 2007). This good capacity can be explained by the hydrophobic properties of PHPC and the non-polarity of the side chains of its amino acids. This extract can therefore be used as an additive to confer an organoleptic quality to a fatty food such as dairy products (Ghribi et al., 2015).
3.2.2. Surface hydrophobicity (SH)
The SH informs us about the surface-active properties of the extract.
Table 4 shows that SH of PHPC studied by binding to the BPB has been found in order of 87.09 � 0.78%. It is higher than that found by Tontul et al. (2018) (60.98%), this means that our PHPC can have promising surface-active properties.
3.3. Optimization by RSM 3.3.1. Model analysis
Combination of the three studied factors (pH, concentration of NaCl and PB molarity) and the value of the corresponding response obtained in different experiments were presented in Table 2. It indicated that solubility was ranged from 21.18 to 87.04, the EAI from 18.84 to 34.48, while FC varied from 16.66 to 123.33. The values of the experimental results are consistent with the predicted values for the three responses.
3.3.2. Analysis of response surface
RSM based on BBD was applied to disclose optimal levels for the studied parameters (pH, NaCl concentration and PB molarity). Surface response models were the best method which illustrates the effects of independent variables and their interactions on the solubility of PHPC, their emulsifying activity and their foaming capacity. Experimental data were fitted to second order polynomial model.
Table 2
Box–Behnken design matrix and experimental and predicted data.
Run pattern
Run
1 pattern 0 Variables pH (X1) C NaCl (X2) PB M(X3) Solubility Pred Formula solubility EAI Pred Formula EAI FC Pred Formula FC
2 0 7 0 0 28 33.9310905 21.37 21.9767438 61.66 60.40375 3 þ0 2 0.275 0 44.11 49.4575682 24.177 24.515224 91.66 91.6725 4 0þ 12 0.275 0 26.14 24.5587616 18.731 19.3399277 50 62.485 5 0 7 0.55 0 21.4 13.3703086 23.84 22.1893426 16.66 2.08875 6 þ 0 2 0 0.05 87.04 77.4362757 26.6 25.4061574 123.33 122.91375 7 000 12 0 0.05 81.6 77.4337243 27.71 26.7413426 106.66 102.03125 8 000 7 0.275 0.05 27.54 29.5491319 19.13 19.018366 41.66 41.66 9 000 7 0.275 0.05 29.12 29.5491319 18.84 19.018366 41.66 41.66 10 þ0 7 0.275 0.05 29.52 29.5491319 19.79 19.018366 41.66 41.66 11 þþ0 2 0.55 0.05 43.08 46.7025309 34.48 35.4261389 58.33 64.56875 12 0 þ 12 0.55 0.05 57.4 67.5474691 24.14 25.3563611 93.33 93.74625 13 0þ 7 0 0.1 36.11 43.9489095 20.27 21.8257562 31.66 39.57125 14 þ0þ 2 0.275 0.1 21.18 24.406169 28.74 27.6611376 75 62.505 15 0þþ 12 0.275 0.1 73.85 70.1473624 24.91 24.1018413 100 99.9875
C NaCl: concentration of NaCl; PBM: Phosphate buffer molarity; EAI: emulsifying activity index; FC: foaming capacity. The codded values were (þ): maximum value, (0): central value and ( ): minimum value.
Table 3
Proximate chemical composition of PHPC. Rate (%) yield 36.66 � 0.7 Ash 4.9 � 0.3 moisture 2.4 � 0.2 proteins 69.33 � 0.3 carbohydrates 2 � 0.02 fats –
Data are the mean � SD of three analyses. Table 4
Water and oil holding capacities (WHC/OHC) and surface hydrophobicity of PHPC.
Parameters
Water holding capacity (g of water/g of PHPC) 3.89 � 0.06 Oil holding capacity (g of oil/g of PHPC) 3.54 � 0.02
Surface hydrophobicity (%) 87.09 � 0.78
Data are the mean � SD of three analyses.
Table 5
Analyze of variance (ANOVA) for the experimental results obtained by solubility.
Source DF Adj SS Adj MS F- Value P-Value
Model 7 0,018057 0,002580 27,04 0,0002 Linear 3 0,002770 0,000923 9,68 0,0075 X1 1 0,000662 0,000662 6,93 0,0344 X2 1 0,001539 0,001539 16,13 0,0053 X3 1 0,000570 0,000570 5,98 0,0440 Square 3 0,009962 0,003321 34,81 0,0001 X1X1 1 0,005900 0,005900 61,84 0,0006 X2X2 1 0,001645 0,001645 17,24 0,0044 X3X3 1 0,002002 0,002002 20,99 0,0032 Interaction 1 0,005325 0,005325 55,82 0,0003 X1X3 1 0,000668 0,005325 55,82 0,0006 Error 7 0,000644 0,000095 Lack of fit 5 0,000024 0,000129 10,83 0,0873 Pure error 2 0,018725 0,000012 Total 14 S 0.0097674 R-sq 0.9643 R-sq (adj) 0.9287
Note: S – standard error of the regression; R-sq – regression coefficient and R-sq (adj)- adjusted regression coefficient, Adj SS: adjusted sum of square and Adj MS: Adjusted means square.
3.4. Solubility
3.4.1. Analyze of the model of solubility
In Table 5, it has been shown that for solubility, all linear parameters have been significant; X1 and X3 (p < 0.05) and X2 (p < 0.01) therefore highly significant. Their quadratic parameters are also very highly sig-nificant (p < 0.01), as well as for the quadratic parameter X1, X3. However, all other parameters are not significant (p > 0.05) and the only significant interaction parameter is the X1X3 (p < 0.01). Taking into account only the significant parameters with p < 0.05, the predictive equation has been deduced.
Solubility ¼ 0.18664 þ 0.00909 X1 – 0.01387 X2 þ 0.00844 X3 þ 0.03997 � 1 � 1 þ 0.02111 � 2 � 2 – 0.02329 � 3 � 3 þ 0.03649 � 1 � 3
Table 5 shows also, the variance analysis of the experimental results. The F value of the model was 27.04, this being said that the model is significant. The determination coefficient (R2) was 0.9643 which means
that only 3.57% of the variations could not be explained, and that 96.43% were attributed to the independent variables of solubility of PHPC.
However, the value of R2 is not always synonymous with a good
regression model, it must be comparable to the adjusted R2, which is
verified in our case as shown in Table 5 (adjusted R2 ¼0.9287). In addition, the value of lack of fit was 0.087 (whose value must be insignificant (p > 0.05) compared to the pure error). Finally, the low value of S which is the standard variation error (0.009) implies that the values obtained are close to the adjusted line. All these values and sig-nificance indicate that this model is well and truly validated and that it could work for the prediction of the solubility of PHPC.
3.4.2. Response surface of solubility
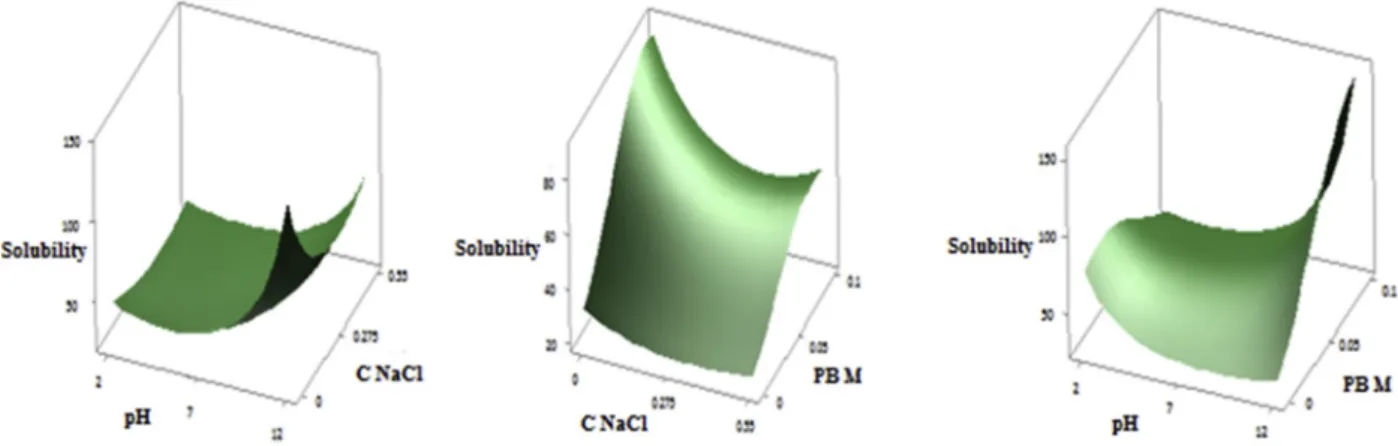
Fig. 1 (A, B, C) shows the three dimensional response surface profiles of multiple non-linear regressions of PHPC solubility.
The solubility depends mainly on pH because the linear and quadratic effect are significant and highly significant with (p < 0.001 and p < 0.05) respectively. As mentioned above, the three parameters studied (pH, NaCl and PB) are factors that significantly influence solu-bility and the interaction effect between pH and PB is also significant. A slight increasing of solubility was noted with increasing of pH value and decreasing then subsequently increasing of the NaCl concentration value. However, the solubility reaches its maximum when NaCl con-centration decreases slightly and PB M increases significantly. On the other hand, it is result from the decreasing of pH value and very sig-nificant increasing of PBM, the increasing and then decreasing of solu-bility (Fig. 1 A, B, C). This is perfectly in agreement with the results of the preliminary study. The solubility of PHPC can be improved by varying the pH values; it increases as pH approaches the extreme pH values of 2 and 12. In general, as the pH increases, solubility decreases
until it reaches the isoelectric domain, then increases. Because at pHs close to isoelectric pH, electrostatic repulsive forces favour the aggre-gation of proteins. The large volume of the aggregate and the bulk density therefore lead to the precipitation of these proteins and prevent their solubilization. However, at extreme pHs (far from the isoelectric domain) Electrostatic repellent forces help to separate positively charged proteins and increase interactions between them and the sol-vent (Mao & Hua, 2012). Protein solubility profile as a function of pH is used as an indicator of protein functionality, since functional properties are directly related to solubility (Ortiz & Wagner, 2002). Our results are similar to those found for the protein extracts from other plant matrices, as demonstrated by Hu et al. (2017) for walnut protein concentrate (Tontul et al., 2018), for chickpea protein isolate and Chao et al. (2018)
for pea isolate.
Solubility also depends strongly on NaCl concentration but with a negative effect and very significant linear and quadratic effects (p < 0.01). The preliminary study showed that the salt concentration increases the solubility of the protein extract to the concentration of about 0.280 g/l and then decreases it to the minimum at 0.55 g/l, this result is very logical and can be explained by the phenomenon of salting in and salting out found by several authors such as Deng et al. (2011) for the protein isolate of Ginkgo biloba seeds. The optimum occurred without NaCl can be explained by the fact that at this pH and this molarity in phosphate buffer, the solubility reaches its maximum and the addition of NaCl does not affect it and this is confirmed by the very high significance of these two parameters interaction. These phenomena depend also on the conformational differences characteristic of proteins (Hu et al., 2017) and effect of NaCl on the ionic strength of the medium (Inyang & Iduh, 1996). Further, salts play an important role in a protein medium on the solubility of the protein, they reduce the charge of counter ions and therefore both those of attractions and electrostatic repulses (Bau, Mohtadi-Nia, Lorient, & Debry, 1985).
It was found that the molarity in PB has also a positive influence on solubility because its linear effect is significant (p < 0.05) and its quadratic effect is highly significant. This confirms the results of the preliminary study where we found that more the molarity of the phos-phate buffer increases, more soluble the PHPC are at lower pH in the range studied. This may be due to the fact that the phosphate buffer on the stability of the protein (Pikal-Cleland, Rodríguez-Hornedo, Amidon, & Carpenter, 2000). Therefore the higher the molarity the more stable the protein is and therefore more soluble.
For this model, the optimal solubility conditions are: pH: 10.88; NaCl: 0; PB: 0.078. The protein extract was solubilized under these conditions and the actual solubility obtained was 87.13% � 0.14 against a predicted value of 87.113% whose difference is not significant (p < 0.05). This solubility value is much better than the solubility ob-tained by dispersing these proteins in distilled water which was 27.02 � 0.52 (Table 1).
3.5. Emulsifying activity index
3.5.1. Analyze of the model of emulsifying activity index
For the emulsifying activity index, it has been shown that all linear parameters, their quadratic and their interactions were very highly significant (p < 0.001). The final predictive equation was obtained as follows:
(EAI^λ-1)/(λ � g^(λ-1)) ¼ 4.058–2.961 X1 þ 2.903 X2 þ 2.395
X3 þ 4.845 � 1 � 1þ4.969 � 2 � 2 – 4.316 � 1 � 2 þ 2.495 � 2 � 3 (λ ¼ 3; g ¼ 23,8189 is the geometric mean of EAI).
Table 6 shows the variance analysis of the experimental results of EAI. The F value of the model was 53.18, this being said that the model is significant. The determination coefficient (R2) was 0.9815 which means
that only 1.85% of the variations could not be explained, and that 98.15% were attributed to the independent variables of emulsifying activity index of PHPC and the value of adjusted R2 (0.9631) is quite
close to R2.
In addition, the value of lack of fit was 0.06 which is not significant. Finally, the standard variation error was 1,09919. All these values and significance indicate that this model is well and truly validated and that it could work for the prediction of the emulsifying activity of PHPC.
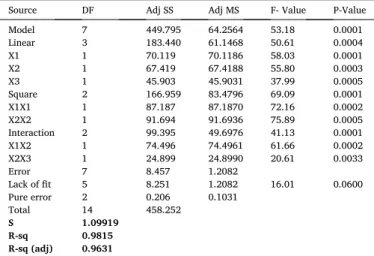
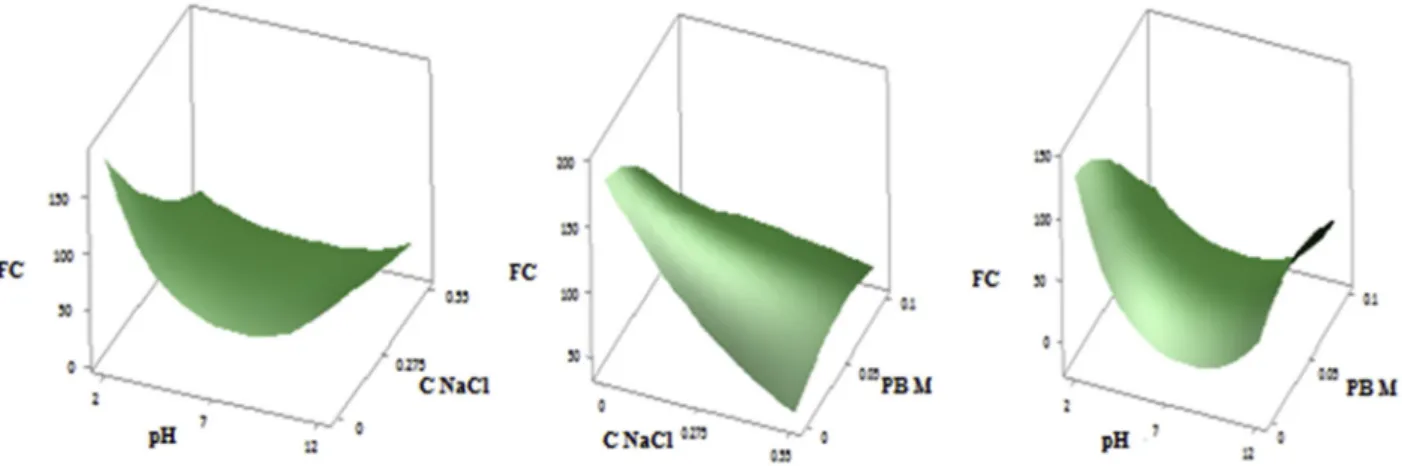
3.5.2. Response surface of emulsifying activity index
Fig. 2 (A, B, C) shows the three dimensional response surface profiles of multiple non-linear regressions of emulsifying activity index of PHPC. The parameters pH, NaCl and PB have significant effects (p < 0.05) on emulsifying activity, and the interaction effects between pH and PB, pH and NaCl as well as PB and NaCl are also significant (p < 0.05). For this activity, the EAI is maximal when NaCl concentration increases signif-icantly and pH decreases and then increases. While the EAI increases slightly despite the significant increasing of PBM and NaCl concentra-tion. Finally, the EAI increases very significantly when pH decreases significantly and PBM increases significantly (Fig. 2 A, B, C). Such as solubility, the emulsifying activity is also pH dependent because the linear and quadratic effects are very highly significant (p < 0.001) and it affects it in the same way as solubility (high activities at extreme pH and lower activities at neutral pH levels), as demonstrated by several authors such as Hu et al. (2017), Inyang, et al. (1996) and Tontul et al. (2018). The pH has also greatly influenced the emulsifying activity, this activity depends on the hydrophilic-lipophilic balance (Wu, Wang, Ma, & Ren, 2009) which in turn depends on the pH. At the oil-water interface, the
lipophilic protein molecules are directed towards the lipid phase (oil) and the hydrophilic molecules towards the aqueous phase. The surface tension is thus reduced. At pH levels close to pHi (where protein solu-bility is reduced), protein adsorption is controlled by diffusion. Which is not the case at extreme pH levels (better protein solubility), the acti-vation energy barrier does not allow protein migration to give way to diffusion, so protein solubility allows for improved interactions between the oil phase and the aqueous phase (Mao et al., 2012).
Although, most authors reported a more pronounced effect at basic pHs than at Acid pHs, contrary to the results obtained, whose optimum has been found at acid pH which can be explained by the interaction effect between pH and NaCl which is very highly significant (p < 0.05). The same observation for the salt concentration, which also affects emulsifying activity with a very high significance (p < 0.001) and with a positive effect, the higher the salt concentration the higher the emulsi-fying activity increases. Our results are in agreement with those reported by other authors such as Deng et al. (2011), Hu et al. (2017) and (Inyang et al., 1996). The effect of salt on emulsifying activity could be due to its ability to form charged layers around the oil drips, which would pro-mote repulsion between the droplets dispersed in the emulsion (Hu et al., 2017). The phosphate buffer affects positively the emulsifying activity with a very high significance.
The optimal emulsifying activity conditions for this model are: pH: 2; C NaCl: 0.55 g/l; PB: 0.1 M the EAI of the protein extract has been investigated under these conditions and the actual EAI obtained was 36.82 � 0.34 against a predicted value of 36.65 whose difference is not significant. These optimal conditions have significantly improved the emulsifying activity of PHPC compared to its activity in distilled water (20.89 � 0.24) (Table 1).
3.6. Foaming capacity
3.6.1. Analyze of the model of foaming capacity
The results of the analysis of variance of the pH effect, NaCl and PB on foaming capacity are represented in Table 7.
The results show that for linear parameters, only X2 is significant (p < 0.01). For quadratic parameters, X1X1 is very highly significant and X3X3 is significant, and finally the significant interaction parameters are X1X3 and X2X3. The equation of prediction was as follows:
FC ¼ 3.7295 þ 0.0008 X1 – 0.2806 X2 þ 0.0518 X3 þ 0.8413 � 1 � 1 þ 0.0492 � 2 � 2 - 0.2327 � 3 � 3 þ 0.1538 � 1 � 2 þ 0.2234 � 1 � 3 þ 0.3137 � 2 � 3
The model of FC as shown in Table 7 is significant at F value of 19.763. The R-sq is at 0.9726 which means that only 2.74% of the variation could not be explained by the model and then 97.26% were attributed to the independent variables used. This value of R-sq is very comparable to the value of R-sq adjusted (0.9234). Finally, the value of S is also very low (0.1555). However, for this response (FC) the value of lack of fit was significant (0.012 < 0.05) but this does not prevent the validation of the design given the validity of the other R2 and adjusted
R2 parameters as well as S. Moreover, several authors have demon-strated that the significance of the value of lack of fit does not necessarily invalidate the design because it can be due to the value of the pure error which can be very small or zero due to the accuracy of the repeat measurements (Ahmad, Yusup, Bokhari, & Kamil, 2014; Bashir, Aziz, Yusoff, & Adlan, 2010; Markovi�c et al., 2018). According to the obtained results, we can say that this model can be used for prediction of the effect of pH, NaCl and PB molarity on FC.
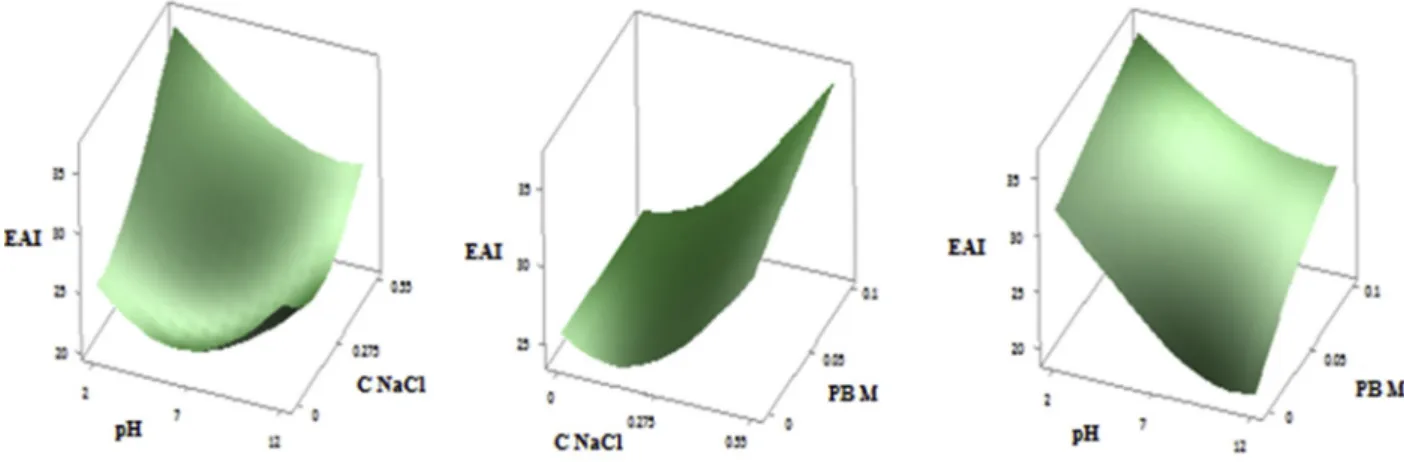
3.6.2. Response surface of foaming capacity
Fig. 2 (A, B, C) shows the three dimensional response surface profiles of multiple non-linear regressions of Foaming capacity of PHPC. The NaCl parameters have a significant effect on foaming activity, and the interaction effects between pH and PB and PB and NaCl are also
Table 6
Analyze of variance (ANOVA) for the experimental results obtained by Emul-sifying activity.
Source DF Adj SS Adj MS F- Value P-Value
Model 7 449.795 64.2564 53.18 0.0001 Linear 3 183.440 61.1468 50.61 0.0004 X1 1 70.119 70.1186 58.03 0.0001 X2 1 67.419 67.4188 55.80 0.0003 X3 1 45.903 45.9031 37.99 0.0005 Square 2 166.959 83.4796 69.09 0.0001 X1X1 1 87.187 87.1870 72.16 0.0002 X2X2 1 91.694 91.6936 75.89 0.0005 Interaction 2 99.395 49.6976 41.13 0.0001 X1X2 1 74.496 74.4961 61.66 0.0002 X2X3 1 24.899 24.8990 20.61 0.0033 Error 7 8.457 1.2082 Lack of fit 5 8.251 1.2082 16.01 0.0600 Pure error 2 0.206 0.1031 Total 14 458.252 S 1.09919 R-sq 0.9815 R-sq (adj) 0.9631
Note: S – standard error of the regression; R-sq – regression coefficient and R-sq (adj)- adjusted regression coefficient, Adj SS: adjusted sum of square and Adj MS: Adjusted means square.
significant. The foaming capacity depends also on the pH with a very highly significant quadratic effect. On the concentration of NaCl with a very highly significant linear effect, and on the phosphate buffer with a significant quadratic effect, the interaction effects are significant for the pH-PBM and NaCl-PBM parameters. The value of FC decreases after significant decreasing of pH and slightly increasing of NaCl concentra-tion. When NaCl concentration decreases very significantly and PBM increases, the FC increases slightly then quickly decreases. At last, the FC is maximal with significant decreasing of pH value and decreases with increasing of pH at the same time that PBM (Fig. 3 A, B, C). The effect of pH and NaCl on FC has also been reported by several authors (Hu et al., 2017; Inyang et al., 1996). Foaming capacity is highly related to solu-bility and Kinsella (1979) reported that only soluble proteins contribute to the formation of foams. This explains the better capacity at extreme pH (pH ¼ 2) but ionic forces could depress the foams by reducing the coulombic forces of the polypeptides of protein molecules (Altschul & Wilcks, 1985).
The optimal FC conditions for this model are: pH: 2; NaCl: 0 g/l; PBM: 0 M the FC of the protein extract has been investigated under these conditions and the actual FC obtained was 183.55 � 2.03 against a predicted value of 182.72 with no significant differences (p < 0.05). The
foaming capacity obtained under these optimal conditions is much higher than that obtained in distilled water (61.66 � 0.66) (Table 1).
The optimal conditions were determined by maximizing desirability using the Minitab prediction profiler. In order to verify the predictive capacity of the model, the results of the maximized conditions were used for a solubility test of the PHPC, their EAI and their FC. The optimal conditions obtained were: pH 12, NaCl concentration 0.55 g/l. molarity in PB 0.1 M. The experimental values for solubility, EAI and FC were 78.07 � 0.98, 30 � 0.52, 110 � 2 respectively with composite desir-ability value of 0.77, intermediate values of desirdesir-ability between (0–1) indicate more or less desirable response (Candioti et al., 2014). These experimental results were in agreement with the predicted values cor-responding to 77.4, 30.05 and 111 respectively (no significant difference).
Fig. 2. Responses surfaces showing the effect of pH; NaCl (A), NaCl; PB (B) and pH; PB (C) on emulsifying activity (EAI) of PHPC. Table 7
Analyze of variance (ANOVA) for the experimental results obtained by foaming capacity of PHPC.
Source DF Adj SS Adj MS F- Value P-Value
Model 9 4.31315 047924 19.76 0.0023 Linear 3 0.65130 0.21710 8.95 0.0192 X1 1 0.00001 0.00001 0.00 0.9895 X2 1 0.62985 0.62985 25.97 0.0048 X3 1 0.02144 0.02144 0.88 0.3904 Square 3 2.97391 0.99130 40.87 0.0015 X1X1 1 2.97391 2.61342 107.74 0.0004 X2X2 1 0.00892 0.00892 0.37 0.5715 X3X3 1 0.19986 0.19986 8.24 0.0358 Interaction 3 0.68794 0.22931 9.45 0.0177 X1X2 1 0.09463 0.09463 3.90 0.1055 X1X3 1 0.19970 0.19970 8.23 0.0353 X2X3 1 0.39361 0.39361 16.23 0.0105 Error 5 0.12129 0.02426 Lack of fit 3 0.00000 0.04043 0.0120 Pure error 2 4.43444 0.00000 Total 14 S 0.1555747 R-sq 0.9726 R-sq (adj) 0.9234
Note: S – standard error of the regression; R-sq – regression coefficient and R-sq (adj)- adjusted regression coefficient, Adj SS: adjusted sum of square and Adj MS: Adjusted means square.
Table 8
Regression coefficient, standard error, and t-test results of response surface for solubility, EAI and FC.
Regression coefficients Standard error t- value P- value
Solubility Constant 0,18664 0,00564 33,10 0,0002 X1 0,00909 0,00345 2,63 0,0344 X2 0,01387 0,00345 4,02 0,0053 X3 0,00844 0,00345 2,44 0,0440 X1X1 0,03997 0,00508 7,86 0,0001 X2X2 0,02111 0,00508 4,15 0,0044 X3X3 0,02329 0,00508 4,58 0,0032 X1X3 0,03649 0,00488 7,47 0,0003 EAI Constant 4058 0,528 7,68 0,0001 X1 2961 0,389 7,62 0,0001 X2 2903 0,389 7,47 0,0003 X3 2395 0,389 6,16 0,0005 X1X1 4845 0,570 8,49 0,0002 X2X2 4969 0,570 8,71 0,0005 X1X2 4316 0,550 7,85 0,0002 X2X3 2495 0,550 4,54 0,0033 FC constant 3,7295 0,0899 41,48 0,0023 X1 0,0008 0,0551 0,01 0,9895 X2 0,2806 0,0551 5,10 0,0048 X3 0,0518 0,0551 0,94 0,3904 X1X1 0,8413 0,0811 10,38 0,0004 X2X2 0,0492 0,0811 0,61 0,5715 X3X3 0,2327 0,0811 2,87 0,0358 X1X2 0,1538 0,0779 1,98 0,1055 X1X3 0,2234 0,0779 2,87 0,0353 X2X3 0,3137 0,0779 4,03 0,0105
3.7. Stabilisation of foaming and emulsifying properties
The optimal desirability conditions of the three responses (solubility, EAI and FC) were used to study the stability of the emulsion and that of the foam formed. The results of stability percentages are represented in
Table 9.
A very good stability was exhibited for both the emulsion and the foam compared to that of sesame (Inyang et al., 1996). The stability of these two activities depends primarily on the solubility of the extract but also on the ionic strength of the medium.
3.8. Minimum gelling concentration (MGC)
The temperature of 95 �C was used for the study of the gelation of
Pinus halepensis Mill. proteins because for the formation of a protein gel,
a denaturation of the proteins is necessary (Srinivasan Damodaran, 1988). According to Arntfield and Murray (1981), the denaturation temperatures of oat, fababean, field pea and soybean were 112, 88, 86 and 93 �C respectively.
The MGC of PHPC under optimal conditions of functional properties was around 6% of PHPC, it’s showing the very good gelling capacity of these proteins under these conditions. The gelation phenomenon is a phenomenon much more associated with temperature. Heat treatment allows the denaturation of proteins by cleavage of the structure of the disulfide bonds and thus the deflagration of proteins or an activation of the sulfide groups buried inside the molecule. these sulfide groups can give intermolecular disulfide bonds (exchange of the disulfide season) which causes a deployment of the protein molecules followed by an aggregation and association step thus forming the gel (Bau et al., 1985), the optical and rheological properties of thermally irreversible gels are therefore obtained (Ziegler & Foegeding, 1990). The parameters that can improve gelling are the increase in time, temperature, pH and protein concentration (Coffmann & Garciaj, 1977). Sun and Arntfield (2010) reported also that the salt concentration improves significantly the gelling properties of proteins. In our study, the high pH and high salt concentration may have influenced this capacity. In addition to the solubility of its proteins which is 77.39%, the minimum concentration obtained is more interesting than that reported by most other protein extracts. O’Kane et al. (2005), Coffmann and Garciaj (1977) and (A. M.
Altschul, 1958) obtained MGC of 16% for pea protein, 10% for mung bean protein and 8% for soy protein respectively.
3.9. Heat coagulability (HC)
A relatively high HC was demonstrated by PHPC which was 24% compared to concentrate of Brassica juncea mustard seeds and Sinapis
alba (Rotimi E. Aluko, McIntosh, & Katepa-Mupondwa, 2005) and
canola isolate seeds (Rotimi E Aluko & McIntosh, 2001) as well as soybean isolate and pea isolate (Voutsinas et al., 1983) which have not shown any coabulability to heat. Our result is comparable to the HC of sunflower isolate (22.5%). Voutsinas et al. (1983); Rotimi E Aluko et al. (2001) and Rotimi E. Aluko et al. (2005) explain that HC depends mainly on the solubility as well as the surface hydrophobicity of the protein extract, which justifies the heat coagulation of our PHPC under the conditions used which solubilize them at 77.39%.
4. Conclusion
In conclusion, this study confirmed that the functional properties are strongly related to the pH of the medium, its NaCl concentration and its PB molarity. In addition, the results show that Aleppo pine seeds are a good source of protein whose functional activities have been improved by the three parameters influencing them (pH, NaCl concentration and PB molarity). These proteins can therefore be used as food ingredients and the variation in pH, NaCl concentration and PB molarity can be employed as an effective processing method to improve the use of pro-teins as functional ingredients in food product formulations.
Declaration of competing interest
We wish to confirm that there are no known conflicts of interest associated with this publication and there has been no significant financial support for this work that could have influenced its outcome.
Acknowledgements
Authors are thankful to the members of the Faculty of Natural Sci-ences and Life and Earth SciSci-ences, University of Bouira, Algeria.
Appendix A. Supplementary data
Supplementary data to this article can be found online at https://doi. org/10.1016/j.foodhyd.2019.105416.
Fig. 3. Responses surfaces showing the effect of pH; NaCl (A), NaCl; PB (B) and pH; PB (C) on foaming capacity (FC) of PHPC. Table 9
Percentages of foam and emulsion stability of PHPC.
15 min 30 min 45 min 60min Emulsion Stability index (%) 75 � 2.3 68.5 � 1.5 53 � 2 51 � 0.8 Foam stability (%) 90 � 4.6 87 � 2.2 83 � 1.9 73 � 4.3 Data are the mean � SD of three analyses.
References
Adeleke, O. R., Adiamo, O. Q., & Fawale, O. S. (2018). Nutritional, physicochemical, and functional properties of protein concentrate and isolate of newly-developed Bambara groundnut (Vigna subterrenea L.) cultivars. Food Sciences and Nutrition, 6(1), 229–242.
Ahmad, J., Yusup, S., Bokhari, A., & Kamil, R. N. M. (2014). Study of fuel properties of rubber seed oil based biodiesel. Energy Conversion and Management, 78, 266–275. Aletor, O., Oshodi, A., & Ipinmoroti, K. (2002). Chemical composition of common leafy
vegetables and functional properties of their leaf protein concentrates. Food
Chemistry, 78(1), 63–68.
Altschul, A. M. (1958). Processed plant protein foodstuffs. Processed plant protein foodstuffs. Altschul, A., & Wilcks, H. (1985). New protein foods: Food science and Technology. Orlando,
Florida: Academic Press.
Aluko, R. E., & McIntosh, T. (2001). Polypeptide profile and functional properties of defatted meals and protein isolates of canola seeds. Journal of the Science of Food and
Agriculture, 81(4), 391–396.
Aluko, R. E., McIntosh, T., & Katepa-Mupondwa, F. (2005). Comparative study of the polypeptide profiles and functional properties of Sinapis alba and Brassica juncea seed meals and protein concentrates. Journal of the Science of Food and Agriculture, 85 (11), 1931–1937.
AOAC. (1998). Official methods of analysis (Vol. 1).
Arntfield, S. D., & Murray, E. (1981). The influence of processing parameters on food protein functionality I. Differential scanning calorimetry as an indicator of protein denaturation. Canadian Institute of Food Science and Technology Journal, 14(4), 289–294.
Ash, M., Dohlman, E., & Davis, W. (2006). Oil crops situation and outlook yearbook.
Electronic outlook report from the Economic Research Service. United States Department
of Agriculture.
Bashir, M. J., Aziz, H. A., Yusoff, M. S., & Adlan, M. N. (2010). Application of response surface methodology (RSM) for optimization of ammoniacal nitrogen removal from semi-aerobic landfill leachate using ion exchange resin. Desalination, 254(1–3), 154–161.
Bau, H., Mohtadi-Nia, D., Lorient, D., & Debry, G. (1985). Les caract�eristiques de la g�elification d’isolat prot�eique du soja. Canadian Institute of Food Science and
Technology Journal, 18(4), 274–279.
Boye, J. I., Aksay, S., Roufik, S., Rib�ereau, S., Mondor, M., Farnworth, E., et al. (2010). Comparison of the functional properties of pea, chickpea and lentil protein concentrates processed using ultrafiltration and isoelectric precipitation techniques.
Food Research International, 43(2), 537–546.
Bradford, M. M. (1976). A rapid and sensitive method for the quantitation of microgram quantities of protein utilizing the principle of protein-dye binding. Analytical
Biochemistry, 72(1–2), 248–254.
Candioti, L. V., De Zan, M. M., Camara, M. S., & Goicoechea, H. C. (2014). Experimental design and multiple response optimization. Using the desirability function in analytical methods development. Talanta, 124, 123–138.
Chao, D., Jung, S., & Aluko, R. E. (2018). Physicochemical and functional properties of high pressure-treated isolated pea protein. Innovative Food Science & Emerging
Technologies, 45, 179–185.
Cheatham, R. (2014). Protein: A plant-based look at this power macronutrient, special report. In Food product design (pp. 1–7). Phoenix, AZ, USA: Virgo Publishing LLC. Coffmann, C., & Garciaj, V. (1977). Functional properties and amino acid content of a
protein isolate from mung bean flour. International Journal of Food Science and
Technology, 12(5), 473–484.
Damodaran, S. (1988). Refolding of thermally unfolded soy proteins during the cooling regime of the gelation process: Effect on gelation. Journal of Agricultural and Food
Chemistry, 36(2), 262–269.
Damodaran, S. (2000). Aminoacidos, peptidos y proteinas. Quimica de los alimentos. Deng, Q., Wang, L., Wei, F., Xie, B., Huang, F., Huang, W., et al. (2011). Functional
properties of protein isolates, globulin and albumin extracted from Ginkgo biloba seeds. Food Chemistry, 124(4), 1458–1465.
Dubois, M., Gilles, K. A., Hamilton, J. K., Rebers, P.t., & Smith, F. (1956). Colorimetric method for determination of sugars and related substances. Analytical Chemistry, 28 (3), 350–356.
Ghribi, A. M., Gafsi, I. M., Blecker, C., Danthine, S., Attia, H., & Besbes, S. (2015). Effect of drying methods on physico-chemical and functional properties of chickpea protein concentrates. Journal of Food Engineering, 165, 179–188.
Hojilla-Evangelista, M. P., Evangelista, R. L., & Victor Wu, Y. (2009). Characterization of milkweed (Asclepias spp.) seed proteins. Industrial Crops and Products, 29(2–3), 275–280.
Hu, H., Fan, T., Zhao, X., Zhang, X., Sun, Y., & Liu, H. (2017). Influence of pH and salt concentration on functional properties of walnut protein from different extraction methods. Journal of Food Science & Technology, 54(9), 2833–2841.
Inyang, U., & Iduh, A. (1996). Influence of pH and salt concentration on protein solubility, emulsifying and foaming properties of sesame protein concentrate.
Journal of the American Oil Chemists’ Society, 73(12), 1663–1667.
Kadri, N., Khettal, B., Aid, Y., Kherfellah, S., Sobhi, W., & Barragan-Montero, V. (2015). Some physicochemical characteristics of pinus (Pinus halepensis Mill., Pinus pinea L., Pinus pinaster and Pinus canariensis) seeds from North Algeria, their lipid profiles and volatile contents. Food Chemistry, 188, 184–192.
Kaur, M., & Singh, N. (2007). Characterization of protein isolates from different Indian chickpea (Cicer arietinum L.) cultivars. Food Chemistry, 102(1), 366–374. Kinsella, J. E. (1979). Functional properties of soy proteins. Journal of the American Oil
Chemists’ Society, 56(3Part1), 242–258.
Maestre, F. T., Cortina, J., Bautista, S., & Bellot, J. (2003). Does Pinus halepensis facilitate the establishment of shrubs in Mediterranean semi-arid afforestations?
Forest Ecology and Management, 176(1–3), 147–160.
Mao, X., & Hua, Y. (2012). Composition, structure and functional properties of protein concentrates and isolates produced from walnut (Juglans regia L.). International
Journal of Molecular Sciences, 13(2), 1561–1581.
Markovi�c, M. S., Radosavljevi�c, D. B., Pavi�cevi�c, V. P., Risti�c, M. S., Milojevi�c, S.�Z., Bo�skovi�c-Vragolovi�c, N. M., et al. (2018). Influence of common juniper berries pretreatment on the essential oil yield, chemical composition and extraction kinetics of classical and microwave-assisted hydrodistillation. Industrial Crops and Products,
122, 402–413.
Moure, A., Sineiro, J., & Domı́nguez, H. (2001). Extraction and functionality of membrane-concentrated protein from defatted Rosa rubiginosa seeds. Food
Chemistry, 74(3), 327–339.
Mune, M. A. M., & Sogi, D. S. (2016). Emulsifying and foaming properties of protein concentrates prepared from cowpea and Bambara bean using different drying methods. International Journal of Food Properties, 19(2), 371–384.
O’Kane, F. E., Vereijken, J. M., Gruppen, H., & Van Boekel, M. A. (2005). Gelation behavior of protein isolates extracted from 5 cultivars of Pisum sativum L. Journal of
Food Science, 70(2), C132–C137.
Ogunwolu, S. O., Henshaw, F. O., Mock, H.-P., Santros, A., & Awonorin, S. O. (2009). Functional properties of protein concentrates and isolates produced from cashew (Anacardium occidentale L.) nut. Food Chemistry, 115(3), 852–858.
Ortiz, S. E. M., & Wagner, J. R. (2002). Hydrolysates of native and modified soy protein isolates: Structural characteristics, solubility and foaming properties. Food Research
International, 35(6), 511–518.
Peterson, G. L. (1977). A simplification of the protein assay method of Lowry et al. which is more generally applicable. Analytical Biochemistry, 83(2), 346–356.
Rodrigues, I. M., Coelho, J. F. J., & Carvalho, M. G. V. S. (2012). Isolation and valorisation of vegetable proteins from oilseed plants: Methods, limitations and potential. Journal of Food Engineering, 109(3), 337–346.
Schiller, G. (2014). Therapeutic use of Aleppo pine (pinus halepensis Mill.). In Z. Yaniv, & N. Dudai (Eds.), Medicinal and aromatic plants of the middle-east (pp. 215–224). Dordrecht: Springer Netherlands.
Shahidi, F., Han, X.-Q., & Synowiecki, J. (1995). Production and characteristics of protein hydrolysates from capelin (Mallotus villosus). Food Chemistry, 53(3), 285–293.
Soria-Hern�andez, C., Serna-Saldívar, S., & Chuck-Hern�andez, C. (2015). Physicochemical and functional properties of vegetable and cereal proteins as potential sources of novel food ingredients. Food Technology and Biotechnology, 53(3), 269. Sun, X. D., & Arntfield, S. D. (2010). Gelation properties of salt-extracted pea protein
induced by heat treatment. Food Research International, 43(2), 509–515. Tan, E. S., Ying-Yuan, N., & Gan, C. Y. (2014). A comparative study of physicochemical
characteristics and functionalities of pinto bean protein isolate (PBPI) against the soybean protein isolate (SPI) after the extraction optimisation. Food Chemistry, 152, 447–455.
Tontul, I., Kasimoglu, Z., Asik, S., Atbakan, T., & Topuz, A. (2018). Functional properties of chickpea protein isolates dried by refractance window drying. International
Journal of Biological Macromolecules, 109, 1253–1259.
Voutsinas, L., Nakai, S., & Harwalkar, V. (1983). Relationships between protein hydrophobicity and thermal functional properties of food proteins. Canadian Institute
of Food Science and Technology Journal, 16(3), 185–190.
Wu, H., Wang, Q., Ma, T., & Ren, J. (2009). Comparative studies on the functional properties of various protein concentrate preparations of peanut protein. Food
Research International, 42(3), 343–348.
Yoshie-Stark, Y., Wada, Y., Schott, M., & W€asche, A. (2006). Functional and bioactive properties of rapeseed protein concentrates and sensory analysis of food application with rapeseed protein concentrates. LWT-Food Science and Technology, 39(5), 503–512.
Zhao, Q., Xiong, H., Selomulya, C., Chen, X. D., Huang, S., Ruan, X., et al. (2012). Effects of spray drying and freeze drying on the properties of protein isolate from rice dreg protein. Food and Bioprocess Technology, 6(7), 1759–1769.
Ziegler, G. R., & Foegeding, E. A. (1990). The gelation of proteins. In Advances in food and