HAL Id: hal-00642922
https://hal.archives-ouvertes.fr/hal-00642922
Submitted on 17 Nov 2020
HAL is a multi-disciplinary open access
archive for the deposit and dissemination of
sci-entific research documents, whether they are
pub-lished or not. The documents may come from
teaching and research institutions in France or
abroad, or from public or private research centers.
L’archive ouverte pluridisciplinaire HAL, est
destinée au dépôt et à la diffusion de documents
scientifiques de niveau recherche, publiés ou non,
émanant des établissements d’enseignement et de
recherche français ou étrangers, des laboratoires
publics ou privés.
Temperatures and Winds in the Martian Mesosphere
from CO2 Clouds Observations and GCM Simulations
F. González-Galindo, Anni Määttänen, A. Spiga, François Forget
To cite this version:
F. González-Galindo, Anni Määttänen, A. Spiga, François Forget. Temperatures and Winds in the
Martian Mesosphere from CO2 Clouds Observations and GCM Simulations. Fourth International
Workshop on the Mars Atmosphere: Modelling and Observations, Feb 2011, Paris, France.
pp.406-408. �hal-00642922�
TEMPERATURES AND WINDS IN THE MARTIAN MESOSPHERE FROM
CO2 CLOUDS OBSERVATIONS AND GCM SIMULATIONS.
F. Gonz´alez-Galindo, Instituto de Astrof´ısica de Andaluc´ıa, CSIC, Granada, Spain (ggalindo@iaa.es), A. M¨a¨att¨anen, Laboratoire ATmosph`eres, Milieux, Observations Spatiales (LATMOS), UVSQ; Guyancourt, France, A. Spiga, F. Forget, Laboratoire de M´et´eorologie Dynamique, IPSL, Paris, France.
Introduction
The presence of mesospheric CO2 clouds in the Mar-tian mesosphere has been recently revealed by different instruments: TES and MOC on board Mars Global Sur-veyor (Clancy et al., 2004, 2007), SPICAM (Montmessin et al., 2006), OMEGA (Montmessin et al., 2007; M¨a¨a-tt¨anen et al., 2010) and HRSC (Scholten et al., 2010) on board Mars Express, and THEMIS (McConnochie et al., 2010), on board Mars Odyssey. These observa-tions have unveiled two different populaobserva-tions of clouds: equatorial clouds around the aphelion season and mid-latitude clouds during autumn, mainly in the Northern hemisphere. In general, clouds tend to appear in re-stricted latitudinal and longitudinal corridors, and they have been observed at higher altitudes during the night (around 100 km from the surface) than during the day (between 60 and 80 km of altitude). Given that a neces-sary condition for the formation of these clouds is that temperatures have to be below the condensation temper-ature of CO2, the presence of these clouds is an indicator of low temperatures in the Martian mesosphere, and as a consequence the distribution of mesospheric clouds can be seen as a distribution of cold mesospheric ar-eas. In addition, some of the observations of the clouds have allowed for the determination of their zonal speed, that should be similar to the zonal wind speed. So, these clouds offer very valuable information about an atmospheric region characterized by the scarcity of ob-servational data.
In this work we use a ground-to-exosphere Gen-eral Circulation Model, the LMD-MGCM (Forget et al., 1999; Gonz´alez-Galindo et al., 2009), to study the tem-peratures and winds in the Martian mesosphere and com-pare with the information provided by the observations of mesospheric clouds. This will allow to validate the behavior of the model in the mesosphere and, more im-portant, to gain insight into the physical processes that are behind the distribution of these clouds.
Mesospheric temperatures
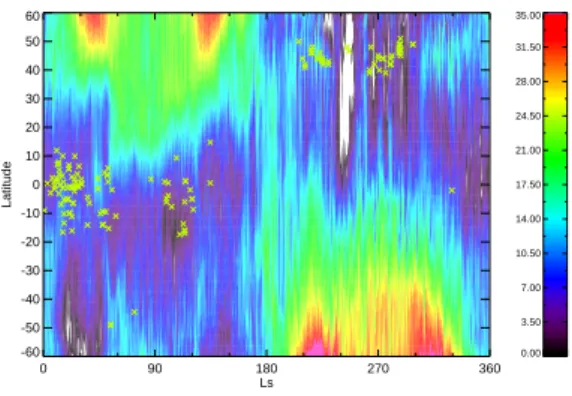
Fig. 1 shows the distribution of the areas of cold meso-spheric temperatures predicted by the LMD-MGCM during daytime as a function of season and latitude. Minimum temperatures are predicted by the model close to the equator before and after aphelion and in
mid-0 90 180 270 360 Ls -60 -50 -40 -30 -20 -10 0 10 20 30 40 50 60 Latitude 0.00 3.50 7.00 10.50 14.00 17.50 21.00 24.50 28.00 31.50 35.00
Figure 1: Difference between the minimum mesospheric tem-perature predicted by the LMD-MGCM and the condensation
temperature of CO2, as a function of latitude and season. The
location of the observed mesospheric clouds is indicated by the green crosses
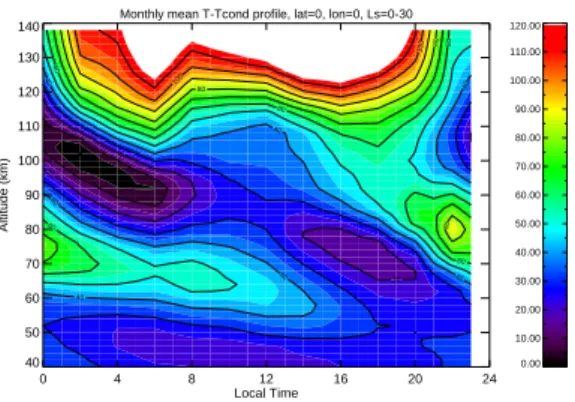
latitudes of both hemispheres during autumn, in reason-ably good agreement with the observed distribution of the clouds. However, the model only predicts temper-atures below condensation in the mid-latitudes during autumn. We think that small scale processes not in-cluded in the GCM, such as the propagation of gravity waves to the upper atmosphere, can produce perturba-tions and produce excursions below condensation, if the average temperatures predicted by the GCM are just few Kelvins above condensation. During the nighttime (fig-ure not shown) the model predicts temperat(fig-ure below condensation at almost all latitudes and seasons, while only relatively few nighttime clouds have been observed. We have found that the model predicts correctly the altitude, latitude, longitude and local time of the equato-rial clouds. Minimum temperatures are predicted by the model at about 80 km during the day and 100 km during the night, in good agreement with the observations (fig. 2). This altitude variation is due to the vertical propaga-tion of the diurnal thermal tide. The intensity of the diur-nal thermal tide is the strongest at these seasons around the equator, producing the latitudinal confinement of the equatorial clouds. The areas of minimum temperature are predicted at two longitudinal regions between 150W and 40W and between 20W and 20E, which corresponds with the longitudes where mesospheric clouds have been
LMD-MGCM and mesospheric CO2 clouds
Monthly mean T-Tcond profile, lat=0, lon=0, Ls=0-30
0 4 8 12 16 20 24 Local Time 40 50 60 70 80 90 100 110 120 130 140 Altitude (km) 20 20 40 40 40 40 40 40 40 60 60 60 60 60 80 80 80 100 100 0.00 10.00 20.00 30.00 40.00 50.00 60.00 70.00 80.00 90.00 100.00 110.00 120.00
Figure 2: Difference between the predicted atmospheric
tem-perature and the condensation temtem-perature of CO2as a
func-tion of altitude and local time. Average over Ls=0-30 seasons, lat=0
observed. We think this longitudinal confinement is due to the effects of non-migrating tides, created by the in-teraction of the solar illumination with the topography, and that propagate up to the upper atmosphere.
For the mid-latitude clouds, their latitudinal and lon-gitudinal location are also well predicted by the model. However, minimum temperatures are predicted at alti-tudes of about 90 km and at the beginning of the morn-ing, while the clouds have been observed at altitudes between 45 and 70 km and in the afternoon. It has to be noted, though, that the model predicts a secondary minimum of temperature at the altitude and local time where the clouds have been observed, although that sec-ondary minimum is not strong enough to allow for CO2 condensation. These differences might be due to an in-correct prediction of the structure of the diurnal thermal tide at this particular time of the year.
Mesospheric winds
Given the scarcity of measurements of winds in the Mar-tian mesosphere, this dataset is very useful to constrain the dynamics predicted by General Circulation Mod-els. M¨a¨att¨anen et al. (2010) showed that the meso-spheric zonal winds predicted by the LMD-MGCM for the Ls=0-30 season were in good agreement with the ob-servations. We extend here that study to other seasons. In general, we find that the model predicts correctly the wind magnitude for the different seasons. Predicted winds are eastward for the Ls=210-240 and the Ls=270-300 seasons, and westward for the Ls=30-60 and Ls=90-120 season, as observed, and the magnitude of the winds is generally in rather good agreement with the observa-tions. The model predicts a strong day-to-day variability of wind profiles inside each season, although in some cases this variability is not enough to explain the
dif-ferences between wind intensities measured by different instruments, in particular for the Ls=30-60 season. The longitudinal variability of the wind seems to be also correctly predicted by the model.
References
Clancy, R.T., Wolff, M., Whitney, M. and Cantor, B., 2004, The distribution of high altitude (70 km) ice clouds in the Mars atmosphere from MGS TES and MOC LIMB observations. Bull. Amer. Astron. Society, 36, pp. 1128
Clancy, R.T., Wolff, M., Whitney, M., Cantor, B. and Smith, M.D., 2007, Mars equatorial mesospheric clouds: Global occurrence and physical properties from Mars Global Surveyor Thermal Emission Spectrometer and Mars Orbiter Camera limb observations, J. Geophys. Res., 112, E04004, doi:10.1029/2006JE002805 Forget, F., Hourdin, F., Fournier, R., Hourdin, C., Ta-lagrand, O., Collins, M., Lewis, S.R., Read., P.L. and Huot, J.-P., 1999, Improved general circulation models of the Martian atmosphere from the surface to about 80 km, J. Geophys. Res., 104:24155-24176.
Gonz´alez-Galindo, F., Forget, F., Lopez-Valverde, M.A., Angelats I Coll, M. and Millour, E., 2009, A ground-to-exosphere Martian general circulation model: 1. Sea-sonal, diurnal and solar cycle variation of ther-mospheric temperatures, J. Geophys. Res., 114:4001,
doi:10.1029/2008JE003246
M¨a¨att¨anen, A., Montmessin, F., Gondet, B., Scholten, F., Hoffman, H., Gonzalez-Galindo, F., Spiga, A., Forget, F., Hauber, E., Neukum, G., Bibring, J.-P. and Bertaux, J.-L., 2010, Mapping the mesospheric CO2 clouds on Mars: MEx/OMEGA and MEx/HRSC observations and challenges for atmospheric models, Icarus 209, 452-469, doi:10.1016/j.icarus.2010.05.017
McConnochie, T.H., Bell III, J.F., Savransky, D., Wolff, M., Toigo, A.D., Wang, H., Richardson, M.I. and Chris-tensen, P.R., 2010, THEMIS-VIS observations of clouds in the martian mesosphere: Altitudes, wind speeds and decameter-scale morphology. Icarus 210, 545-565, doi:10.1016/j.icarus.2010.07.21
Montmessin, F.,, Bertaux, J.-L., Qu´emerais, E., Ko-rablev, O., Rannou, P., Forget, F., Perrier, S., Fussen, D., Lebonnois, S., R´eb´erac, A. and Dimarellis, E., 2006, Subvisible CO2 ice clouds detected in the mesosphere of Mars, Icarus, 183:403-410,
doi:10.1016/j.icarus.2006.03.015
LMD-MGCM and mesospheric CO2 clouds Y., Drossart, P., Forget, F. and Fouchet, T., 2007,
Hy-perspectral imaging of convective CO2 ice clouds in the equatorial mesosphere of Mars, J. Geophys. Res. 112, doi:10.1029/2007JE002944
Scholten, F., Hoffmann, H., M¨a¨att¨anen, A., Montmessin,
F., Gondet, B. and Hauber, E., 2010, Concatena-tion of HRSC color and OMEGA data for the determination of 3D-parameterization of high-altitude CO2 clouds in the Martian atmosphere, Planet. Space Sci., 58:1207-1214, doi:10.1016/j.pss.2010.04.015