HAL Id: inria-00496871
https://hal.inria.fr/inria-00496871
Submitted on 1 Jul 2010
HAL is a multi-disciplinary open access
archive for the deposit and dissemination of
sci-entific research documents, whether they are
pub-lished or not. The documents may come from
teaching and research institutions in France or
abroad, or from public or private research centers.
L’archive ouverte pluridisciplinaire HAL, est
destinée au dépôt et à la diffusion de documents
scientifiques de niveau recherche, publiés ou non,
émanant des établissements d’enseignement et de
recherche français ou étrangers, des laboratoires
publics ou privés.
Evaluation of q-ball metrics for assessing the integrity of
the injured spinal cord
Julien Cohen-Adad, H. Leblond, Aurobrata Ghosh, Maxime Descoteaux,
Rachid Deriche, Habib Benali, Serge Rossignol
To cite this version:
Julien Cohen-Adad, H. Leblond, Aurobrata Ghosh, Maxime Descoteaux, Rachid Deriche, et al..
Eval-uation of q-ball metrics for assessing the integrity of the injured spinal cord. Proceedings ISMRM,
May 2009, Honolulu, United States. �inria-00496871�
Evaluation of q-ball metrics for assessing the integrity of the injured spinal cord
J. Cohen-Adad1,2, H. Leblond2, A. Ghosh3, M. Descoteaux4, R. Deriche3, H. Benali1, and S. Rossignol2
1INSERM, Univ Paris 6, Pitie Salpetriere Hospital, Paris, France, 2GRSNC, Physiology department, Univ Montreal, Montreal, QC, Canada, 3Odyssée Project Team, INRIA, Sophia Antipolis, France, 4Neurospin, NMR Lab, CEA, Gif-sur-Yvette, France
Introduction
Assessment of spinal cord integrity following injury is crucial for evaluating the potential for functional rehabilitation [1]. Previous studies showed the benefits of diffusion tensor imaging (DTI) for the non-invasive characterization of the healthy and injured spinal cord [2]. However, biases related to the incapability of DTI to represent complex diffusion profiles suggested the use of less constraining techniques. Recently, we demonstrated that q-ball imaging (QBI) is capable of partly solving fiber crossing information in the intact spinal cord [3]. In this study, we extended the application of QBI in a model of cat partial spinal cord injury and we compared various QBI quantitative metrics to the ones used in DTI. We also proposed an original QBI-based metric to quantify the homogeneity of diffusion directions.
Materials and methods
Data acquisition. MRI acquisitions were conducted in five in vivo cats, one week after a left hemilesion at thoracic 11 (T11) level. We used a Siemens 3T system with
two phased array coils. Diffusion-weighted scans were conducted using twice refocused single shot EPI (sagittal orientation, 1.5×1.5 mm2 in-plane resolution, TR/TE = 9500/109 ms, iPAT = 3, FOVφ = 50%, b-value = 1000 s/mm2, 64 directions, respiratory gating). Slice thickness was enhanced to 1 mm using superresolution methods [4]. With the same slice prescription but twice higher spatial resolution, T2-weighted turbo spin echo (TSE) and T1-weighted MPRAGE images were acquired.
Data processing. Images were corrected for susceptibility artifacts [5] and orientation distribution functions (ODF) were estimated using spherical harmonic basis
functions [6]. Using the TSE image, regions of interest (ROI) were delineated in the right and left side of the cord. Various metrics derived from DTI and ODF were estimated and averaged in each axial plane of the ROI, to study the distribution of metrics along the spinal cord.
Results
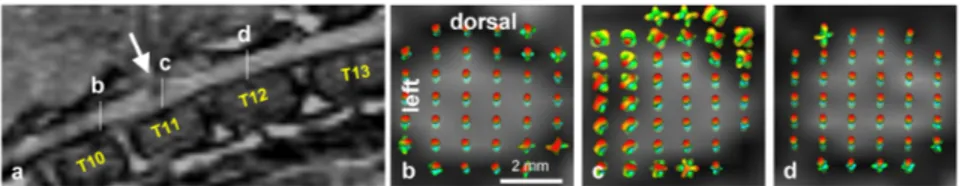
ODF exhibited a quasi-anisotropic profile within the healthy white matter, with major direction oriented rostro-caudally (Fig 1). In spinal cord injured cats however, this diffusion profile was drastically modified ipsilaterally, whereas contralateral pathways appear to remain intact and therefore anisotropic. In order to do a group analysis, metrics quantified along the cord were registered with respect to the location of each cat’s lesion (centered at 0). Results of selected metrics are shown in Fig 2 and stand for apparent diffusion coefficient (ADC), fractional anisotropy (FA), axial (λ//) and radial diffusivity (λ┴), generalized FA (GFA), number of maxima extracted from the ODF, mean square error of ODF first maxima (MSE) and T2-weighted TSE image. The MSE was computed from the Euclidean distance between one voxels’s largest diffusion probability vector and that one from its 26 closest neighbors. Note that vectors were weighted by the diffusion probability in each specific direction.
Discussion
Both FA and GFA are obvious markers of white matter abnormality, with FA being sharper within the lesion. Interestingly, GFA varied with a low frequency ipsi- and contra-laterally along the cord, possibly due to its higher sensitivity to microstucture heterogeneity (e.g., variation of axonal architecture at spinal segments). Interestingly, FA and GFA remained abnormally low ipsilaterally up to 20 mm caudal and rostral to the lesion epicenter, suggesting anomalies. Axial and radial diffusivities respectively decreased and increased within damaged tissue, confirming previous studies [7]. However, important inter-subject variability decreased the sensitivity of these two markers. MSE robustly detected the presence of a lesion with a relatively flat profile in other parts of the cord. However, MSE surprisingly increased ipsi- and contralaterally 30 mm caudal to the lesion. This variation is not seen in other metrics, and could be attributed to subtle changes in diffusion properties (e.g., increased number of afferents, secondary injuries, sprouting). Two important limitations arise from this study. The first one concerns partial volume effects and residual distortions which limited the ability of DTI and ODF metrics to detect abnormalities. The second limitation concerns the relatively high inter-subject variability, in terms of lesion extent and quality of data. Future studies should aim at finding normalization procedures to better extract markers of interest. An original contribution of this study is the introduction of the ODF-based MSE metric, that can be used to map the homogeneity of major diffusion directions, similarly to the tensor field.
References
[1] Rossignol, Philos Trans R Soc Lond B, 361:1647-71 (2006) [2] Cohen-Adad et al., Neuroimage, 40:685-697 (2008) [3] Cohen-Adad et al., Neuroimage, 42:739-749 (2008) [4] Peled and Yeshurun., Magn Reson Med, 45:29-35 (2001) [5] Voss et al., Magn Reson Imaging, 24:231-239 (2006) [6] Descoteaux et al., Magn Reson Med, 58:497-510 (2007)
[7] Budde et al., Magn Reson Med, 57:688-695 (2007) Fig1. Sagittal (a) and axial (b-d) anatomical image with overlay of ODF rostral (b), caudal (d) and centered in the lesion (c), where abnormal diffusion profile is visible at the ipsilateral side.
Fig 2. Quantitative metrics derived from DTI and ODF. Abscissa stands for the location along the cord. For each cat, measurements were registered to the lesion (dashed line) by shifting the data. Thick lines represent averaged values across cats (thin lines are standard deviations).
Acknowledgement
We thank the Canada Research Chair on the Spinal Cord to S. R., the Christopher and Dana Reeve Foundation (USA), the Fondation pour la Recherche Médicale to J.C.A. and the INRIA ARC Diffusion MRI.
DT I m e tr ic s OD F m e tr ic s An a to m ic −90 −60 −30 0 30 4 6 8 10 12 14x 10 −4 ADC Right Left −90 −60 −30 0 30 0 0.1 0.2 0.3 0.4 0.5 0.6 0.7 0.8 FA Right Left −90 −60 −30 0 30 0.8 1 1.2 1.4 1.6 1.8 2x 10 −3 Right Left −90 −60 −30 0 30 2 4 6 8 10 12x 10 −4 Right Left −90 −60 −30 0 30 600 700 800 900 1000 1100 1200 1300 TSE Right Left −90 −60 −30 0 30 −200 0 200 400 600 MSE Right Left −90 −60 −30 0 30 0.8 0.9 1 1.1 1.2 1.3 1.4 1.5 Nb maxima Right Left −90 −60 −30 0 30 0.2 0.25 0.3 0.35 0.4 GFA Right Left λ┴ λ//
position along the cord (mm) rostral
caudal