TECHNICAL ARTICLE
Using synergy of experimental and computational techniques to solve
monomer
–trimer dilemma
DubravkaŠišak Jung,1Tomica Hrenar,2,a)Ozren Jović,2Petra Kalinovičić,2and Ines Primožič2 1DECTRIS Ltd., Neuenhoferstrasse 107, 5400 Baden, Switzerland
2
Department of Chemistry, University of Zagreb, Zagreb, Croatia
(Received 29 September 2014; accepted 5 November 2014)
An example of commercially available product, 2-(methylideneamino)acetonitrile (MAAN). This paper will address problems in discerning monomer–polymer ambiguity in organic compounds. Reliable three-step analysis of organic polymers will be proposed using the synergy of computational [density functional theory (DFT)] and experimental [infrared spectroscopy (IR); X-ray powder dif-fraction (XRPD)] techniques. First, possible conformations of monomeric and trimeric MAAN were calculated using stochastic search and DFT. Second, identification of the commercial sample was performed by comparing the measured IR spectrum with those calculated for monomer and tri-mer. Third, the examination of sample purity and structural analysis were carried out using XRPD data. © 2014 International Centre for Diffraction Data. [doi:10.1017/S0885715614001225] Key words: 2-(methylideneamino)acetonitrile, X-ray powder diffraction, density functional theory
I. INTRODUCTION
2-(methylideneamino)acetonitrile (MAAN) has raised some interest in the 1970s, owing to its reactivity with amino acids and the formation of peptides (Subbaraman et al.,1975; Kawashiro et al.,1989). Reports on its chemical properties included its ability to polymerize as a (cyclic) trimer (Figure 1). Several years later, Xiang et al. (1994) had sug-gested a synthetic route in which the MAAN monomer is ob-tained by decomposition of the trimer, with a yield of 19%. Although both materials are reported to be crystalline, at the point of this study, no evidence for structural analysis of either compound was found. Material characterization, based on in-frared spectroscopy (IR), nuclear magnetic resonance (NMR), or Mass Spectrometry, was performed by various workers and deposited in several databases. Although these results are in-terpreted as the monomer MAAN, some inconsistencies were noticed (Kalinovčić,2012). This suggested that reliable monomer–trimer disambiguation cannot rely solely on a sin-gle analytical technique. (i) In case of systems with similar functional groups (such as polymers) it may be challenging to discern one from the other, using IR data. (ii) Mass spec-trometry in this case can be a useful technique, provided that a molecular ion can be obtained. However, neither of these techniques offers reliable identification of mixtures or exact molecular structure (conformation). (iii) NMR spectro-scopy, on the other hand, is more straightforward, but may be-come quite complex, depending on the symmetry of the molecule, the method used (1H, 13C-NMR), and the purity of the sample. Moreover, the molecular conformation cannot be determined. In this study, based on a MAAN sample, the problem of polymer disambiguation is addressed by combin-ing analytical techniques (IR, XRPD) with computational methods (DFT). In conclusion, some general guidelines
for a full and reliable analysis of molecular crystals are presented.
II. EXPERIMENTAL
A. Constructing an ideal molecular conformation
Given that very little was known about the molecular structures of both the monomer and trimer, the first part of the present study addresses possible conformations of these two species. For each molecule, a conformational search was carried out using a stochastic approach, implemented in the program qcc (Hrenar; Primožič et al.,2014). Minima on the energetic landscape were assigned as the most probable conformations, and these geometries were then optimized using DFT calculations. All quantum-chemical calculations were performed using the Gaussian 09 program (Frisch et al.,2013).
1. Methodology
A conformational search for monomeric MAAN com-pounds was performed via a potential energy surface (PES) scan (0–360°), obtained by varying the torsional coordinate w1using the automatic conformational generator implemented in program qcc. The step size was 10°, giving a total of 37 single-point calculations. These single-point calculations were carried out using DFT at the B3LYP/6-31G(d) level of the theory.
Data from the PES scan were arranged in a one-way array. A parallelized combinatorial optimization algorithm for the arbitrary number of ways (dimensions), implemented in pro-gram moonee (Hrenar,2014a,2014b), was used to determine local minima on the investigated PES. These minima were then re-optimized at the B3LYP/cc-pVTZ level of the theory. To ensure that the geometries obtained were indeed local minima, harmonic frequency calculations were
a)
Author to whom correspondence should be addressed. Electronic mail:
performed. The standard Gibbs energies were calculated at T = 298.15 K and p = 101 325 Pa.
The conformational search for the trimeric form of MAAN was performed using a stochastic search, conducted within the multilevel scheme that uses random generation of structures. Each randomly generated structure was optimized at the molecular mechanics level, and clustering of conformers so obtained was performed. In the next stage, clustered geom-etries were optimized using a higher level of the theory (B3LYP/3-21G), followed by additional clustering. Local mi-nima were re-optimized at the B3LYP/cc-pVTZ level, and harmonic frequency calculations were performed.
2. Results and discussion
For the monomer, the conformational space was found to comprise three conformers (Figures 2and3). Conformer 1 has Cs symmetry, whereas conformers 2 and 3 (C1 symmetry group) represent an enantiomeric pair. The relative Gibbs en-ergy of conformers 2 and 3 is found to be 6.41 kJ mol−1 high-er than for conformhigh-er 1. According to the Boltzmann distribution, the ratio of conformers at the room temperature is 93:7 in favor of conformer 1.
For trimeric MAAN, out of 137 local minima found at the molecular mechanics level, DFT re-optimization and cluster-ing revealed that the lowest energy conformer exhibits two neighboring cyanomethyl groups in equatorial positions, whereas the third one was in an axial position on the six-membered ring (Figure 4).
B. IR analysis of a commercial sample
A commercially available sample, purchased under
the name MAAN, was analyzed. Its IR spectrum
(4000–400 cm−1) was measured using the KBr pellet tech-nique on a Bruker Equinox 55 spectrometer [Figure 5(a)]. Investigation of the spectra obtained revealed that the vibra-tional band at 1650 cm−1 is either not present or is very weak. This suggested that the sample does not contain a C = N group, that is, the molecule in question is not a MAAN monomer. In order to confirm this, DFT calculations for the lowest energy conformers of the monomer (93:7) and trimer were performed. Anharmonic wavenumbers were calculated using the second-order vibrational perturbational theory. Comparison of the calculated and measured spectra confirmed that the molecule in question is most likely a trimer [Figure 5(b)]. However, it was still not clear (i) if the sample is a mixture, and (ii) if the molecular structure of the trimer ob-tained from DFT calculations corresponds to the one in the crystal (solid-state sample).
C. XRPD analysis of a commercial sample
Question (i) about the purity of the commercial sample arose from its ability to polymerize (tendency of C = N bonds to react), and from the fact that one of the possible syn-thetic routes involves conversion of the trimer to a monomer. Question (ii) about the exact trimer configuration in the solid state originated from the fact that the ideal molecular confor-mation obtained by the DFT analysis was calculated for a sin-gle molecule, rather than a crystal. These two issues were addressed by XRPD analysis.
Figure 2. (Colour online) One-dimensional PES scan spanned by torsional coordinatew1and calculated using the B3LYP/6-31G(d) method.
Figure 1. Two-dimensional molecular diagrams for (a) monomeric and (b) trimeric MAAN.
Figure 3. (Colour online) Monomeric MAAN: (a) minimal energy conformers with symmetry Cs, and (b) enantiomeric pair of high-energy
conformers with symmetry C1.
Figure 4. (Colour online) Lowest-energy conformer of trimeric MAAN (two orientations).
1. Data collection and structure determination
A ground sample was measured on a Stoe STADI MP dif-fractometer, in Stoe’s application laboratory in Darmstadt (Table I). The XRPD pattern was indexed using the CMPR program package (Toby,2005), revealing a monoclinic cell. The systematic absences were indicative of P21/n symmetry. In order to avoid model bias, the powder chargeflipping algo-rithm was used (Baerlocher et al.,2007) for structure determi-nation. As this attempt failed, a direct-space approach had to be used. Success for these methods relies on the accuracy of the starting model: this is particularly important for cyclic molecules, as major changes in ring conformation are usually not accepted in direct-space optimization (Černý and Favre-Nicolin, 2004). Hence in this case, information ob-tained from IR/DFT data was crucial, as the stochastic search resulted in 137 possible conformers of trimeric MAAN. Therefore, the lowest energy conformer of the trimer was
optimized using the simulated annealing algorithm with parallel tempering in program FOX (Favre-Nicolin and Černý, 2002). Given that the molecular geometry was be-lieved to be close to the correct one, direct-space optimization was carried out using soft geometrical restraints. Rietveld re-finement of the resulting structure was performed by the XRS suite of programs (Baerlocher and Hepp,1982), using geometric restraints from the DFT model. In order to allow maximum flexibility of the molecular geometry, throughout the refinement procedure these geometric restraints were kept, but the weight factor was progressively decreased. Finally, positions of hydrogen atoms were calculated by the program Mercury (Macrae et al., 2006). For this final model, the scale was adjusted, but the positions of hydrogen atoms were not refined. The details of the refinement are pre-sented inTable IIandFigure 6.
2. Results and discussion
The crystal structure is governed by the interactions be-tween the hydrogens of the methylene groups and nitrogens in the cyano groups or in the ring. Such an arrangement of in-teractions results in tubular assemblies, where molecules are stacked on top of each other along the c-axis [Figure 7(a)].
Figure 5. (Colour online) IR spectra for trimeric MAAN (a) measured and (b) calculated.
TABLE I. Details of the XRPD measurement of MAAN commercial sample.
Instrument Stoe STADI MP
I (mA), U (kV) 40, 40
Sample 0.3 mm glass capillary
Source CuKα1
Exposure time variable
2θ range (°)/exposure time (s) 0–21.935/1440 18–37.935/2880 35–54.935/4320 53–72.935/5760 72–91.935/7200
Step size (°) 0.1
Detector MYTHEN, Silicon microstrip detector
No. measured points 6129
dminused (Å) 1.07
Temperature (°C) 28
Monochromator Ge 111
TABLE II. Details of Rietveld refinement for the MAAN trimer crystal structure. Chemical formula C9N9H12 a (Å) 15.1876(9) b (Å) 10.182 49(8) c(Å) 6.9466(4) β (°) 90.9(3) Space group P21/n No. of reflections 625 No. of parameters 45 No. of observations 5211
No. of soft restraints 33
RF 0.104
Rwp 0.176
Rexp 0.059
Figure 6. (Colour online) Last cycle of the Rietveld refinement: measured pattern (black), calculated (red), and difference curve (blue).
As expected, the absence of classical (strong) hydrogen bonds in the crystal resulted in minor geometrical distortions of the ideal molecular structure from that obtained from DFT calculation [Figure 6(b)].
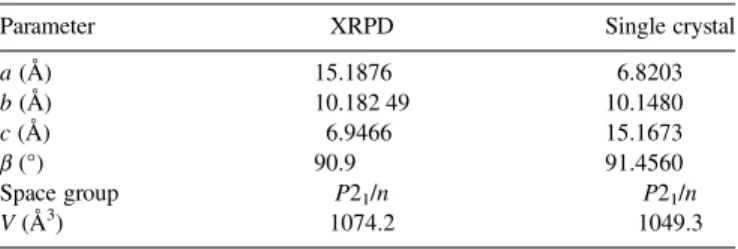
After this work was presented at EPDIC, it became appar-ent that the structure of trimeric MAAN was already solved from single-crystal data. Results were published in Russian (Bushmarinov et al., 2013). Structure 2, reported in this paper, was compared to the structure obtained from XRPD data (Table IIIandFigure 8). In particular, the lengths of all the three axes obtained from XRPD data were found to be lon-ger than the corresponding axes obtained from single-crystal data. This difference is most likely caused by different temper-atures at which samples were measured: single-crystal data were collected at 100 K, and the XRPD measurement was car-ried out at room temperature. Moreover, the expansion caused by long irradiation (14 h in the laboratory diffractometer) can-not be excluded. Although XRPD patterns were calculated for both the structures, they could not be compared in a
straightforward manner, because of the differences in peak po-sitions. Instead, molecular structures obtained from the XRPD and single-crystal data were compared, and were found to be in good agreement (Figure 8).
III. CONCLUSION
The study of MAAN addressed the following: (i) prob-lems in the identification of monomer/trimer species in organ-ic compounds (commercial sample) and (ii) the strategy for resolving this ambiguity. As the analysis of such samples using a single technique was found to be neither complete nor reliable, this work suggests an approach where two exper-imental analytical techniques (IR, XRPD) and DFT calcula-tions are combined. Such a combination of methods and techniques resulted in a full characterization: purity of the sample, identification of the polymer in question, and its crystal and molecular structures.
ACKNOWLEDGEMENTS
We thank the author, Dr. Bushmarinov, for providing the English version of the paper, re-published after the Russian ver-sion, and for scientific discussions on molecular interactions. XRPD data used in this work were measured at STOE Application Laboratory in Darmstadt, Germany. The authors thank the entire STOE team, especially Dr. Thomas Hartmann for excellent technical support and scientific discussions.
Baerlocher, C. and Hepp, A. (1982). XRS-82 (ETH, Zürich, Switzerland). Baerlocher, Ch., McCusker, L. B., and Palatinus, L. (2007). “Charge flipping
combined with histogram matching to solve complex crystal structures from powder diffraction data,” Z. Kristallogr. 222, 47–53.
Bushmarinov, I. S., Golovanov, D. G., and Lyssenko, K. A. (2013). “Stereoelectronic interactions in fragment N-C-CN from high resolution X-ray diffraction data and quantum chemical computations,” Russ. Chem. Bull. Int. Ed. 62(8), 1720–1725. (Izvestiya Akademii Nauk. Seriya Khimicheskaya, 8, 1720–25, 2013).
Černý, R. and Favre-Nicolin, V. (2004). “A better FOX: using flexible mod-eling and maximum likelihood to improve direct-space ab initio structure determination from powder diffraction,” J. Appl. Crystallogr. 219, 847–856.
Favre-Nicolin, V. and Černý, R. (2002). “FOX-free objects for crystallogra-phy: a modular approach to ab initio structure determination from powder diffraction data,” J. Appl. Crystallogr. 35(6), 734–743.
Frisch, M. J., Trucks, G. W., Schlegel, H. B., Scuseria, G. E., Robb, M. A., Cheeseman, J. R., Scalmani, G., Barone, V., Mennucci, B., Petersson, G. A., Nakatsuji, H., Caricato, M., Li, X., Hratchian, H. P., Izmaylov, A. F., Bloino, J., Zheng, G., Sonnenberg, J. L., Hada, M., Ehara, M., Figure 7. (Colour online) (a) Crystal structure viewed along the c-axis (b) comparison of molecular structure (blue) to the molecular structure obtained from DFT calculations (red).
Figure 8. Comparison of molecular structure (red) to the molecular structure obtained from single-crystal data (blue).
TABLE III. Comparison between the structures obtained from the XRPD and single-crystal data.
Parameter XRPD Single crystal
a (Å) 15.1876 6.8203 b (Å) 10.182 49 10.1480 c (Å) 6.9466 15.1673 β (°) 90.9 91.4560 Space group P21/n P21/n V (Å3) 1074.2 1049.3
Toyota, K., Fukuda, R., Hasegawa, J., Ishida, M., Nakajima, T., Honda, Y., Kitao, O., Nakai, H., Vreven, T., Montgomery, J. A., Peralta, J. E., Ogliaro, F., Bearpark, M., Heyd, J. J., Brothers, E., Kudin, K. N., Staroverov, V. N., Keith, T., Kobayashi, R., Normand, J., Raghavachari, K., Rendell, A., Burant, J. C., Iyengar, S. S., Tomasi, J., Cossi, M., Rega, N., Millam, J. M., Klene, M., Knox, J. E., Cross, J. B., Bakken, V., Adamo, C., Jaramillo, J., Gomperts, R., Stratmann, R. E., Yazyev, O., Austin, A. J., Cammi, R., Pomelli, C., Ochterski, J. W., Martin, R. L., Morokuma, K., Zakrzewski, V. G., Voth, G. A., Salvador, P., Dannenberg, J. J., Dapprich, S., Daniels, A. D., Farkas, O., Foresman, J. B., Ortiz, J. V., Cioslowski, J., and Fox, D. J. (2013). Gaussian, Inc., Wallingford CT, Gaussian 09, Revision D.01.
Hrenar, T. (2014a). qcc, Quantum Chemistry Code, rev. 0.68.
Hrenar, T. (2014b). moonee, Code for Manipulation and Analysis of Multi-and Univariate Data, rev. 0.6826.
Kalinovčić, P. (2012). “Vibrational analysis of 2-(methylideneamino)acetoni-trile,” Diploma thesis, University of Zagreb, Croatia
Kawashiro, K., Nishiguchi, K., and Nara, T. (1989). “On the reaction of methyle-neaminoacetonitrile in aqueous-media,” Orig. Life Evol. Biosph. 19, 133–142. Macrae, C. F., Edgington, P. R., McCabe, P., Pidcock, E., Shields, G. P., Taylor, R., Towler, M., and van de Streek, J. (2006). “Mercury,” J. Appl. Crystallogr.39, 453–459.
Primožič, I., Hrenar, T., Baumann, K., Krišto, L., Križić, I., and Tomić, S. (2014). “Mechanochemical and Conformational Study of N-heterocyclic Carbonyl-Oxime Transformations,” Croat. Chem. Acta 87, 155–162. Subbaraman, A. S., Kazi, Z. A., Choughuley, A. S. U., and Chadha, M. S.
(1975). “Methyleneaminoacetonitrile - possible role in chemical evolu-tion-ii,” Orig. Life 6, 537–539.
Toby, B. H. (2005). “CMPR–powder diffraction toolkit,” J. Appl. Crystallogr. 38, 1040–1041.
Xiang, Y. -B., Drenkard, S., Baumann, K., Hickey, D., and Eschenmoser, A. (1994). “Chemie von α-Aminonirilen. 12. Mitteilung. Sondierungen über termische Umwandlungen vonα-Aminonirilen,” Helv. Chim. Acta 77, 2209–2250.