MUSCULOSKELETAL
MRI of the temporo-mandibular joint: which sequence is best
suited to assess the cortical bone of the mandibular condyle?
A cadaveric study using micro-CT as the standard of
reference
Christoph A. Karlo&Raphael Patcas&Thomas Kau&
Helmut Watzal&Luca Signorelli&Lukas Müller&
Oliver Ullrich&Hans-Ulrich Luder&
Christian J. Kellenberger
Received: 20 October 2011 / Revised: 5 December 2011 / Accepted: 21 December 2011 / Published online: 10 February 2012 # European Society of Radiology 2012
Abstract
Objective To determine the best suited sagittal MRI se-quence out of a standard temporo-mandibular joint (TMJ) imaging protocol for the assessment of the cortical bone of the mandibular condyles of cadaveric specimens using micro-CT as the standard of reference.
Methods Sixteen TMJs in 8 human cadaveric heads (mean age, 81 years) were examined by MRI. Upon all sagittal sequences, two observers measured the cortical bone thick-ness (CBT) of the anterior, superior and posterior portions of
the mandibular condyles (i.e. objective analysis), and assessed for the presence of cortical bone thinning, erosions or surface irregularities as well as subcortical bone cysts and anterior osteophytes (i.e. subjective analysis). Micro-CT of the condyles was performed to serve as the standard of reference for statistical analysis.
Results Inter-observer agreements for objective (r00.83-0.99, P<0.01) and subjective (κ00.67-0.88) analyses were very good. Mean CBT measurements were most accurate, and cortical bone thinning, erosions, surface irregularities and subcortical bone cysts were best depicted on the 3D fast spoiled gradient echo recalled sequence (3D FSPGR). Conclusion The most reliable MRI sequence to assess the cortical bone of the mandibular condyles on sagittal imaging planes is the 3D FSPGR sequence.
Key Points
• MRI may be used to assess the cortical bone of the TMJ. • Depiction of cortical bone is best on 3D FSPGR sequences. • MRI can assess treatment response in patients with TMJ
abnormalities.
Keywords Mandibular condyle . MRI . Micro-CT . TMJ . JIA
Introduction
Magnetic resonance imaging (MRI) of the temporo-mandibular joint (TMJ) is considered the diagnostic imag-ing technique of choice for the initial workup and follow-up of patients with TMJ abnormalities. These include internal derangements (i.e. deformation or displacement of the C. A. Karlo (*)
Department of Diagnostic and Interventional Radiology, University Hospital Zurich,
Rämistrasse 100, 8091, Zurich, Switzerland e-mail: [email protected]
C. A. Karlo
:
T. Kau:
H. Watzal:
C. J. Kellenberger Department of Diagnostic Imaging,University Children’s Hospital Zurich, Zurich, Switzerland
R. Patcas
:
L. Signorelli:
L. MüllerClinic for Orthodontics and Pediatric Dentistry, Center of Dental Medicine, University of Zurich,
Zurich, Switzerland O. Ullrich
Institute of Anatomy, Faculty of Medicine, University of Zurich, Zurich, Switzerland
H.-U. Luder
Section of Orofacial Structures and Development, Center of Dental Medicine, University of Zurich, Zurich, Switzerland
articular disc), inflammatory conditions (i.e. TMJ arthritis)
and degenerative changes (i.e. TMJ arthrosis) [1,2].
The main strengths of MRI are the detailed illustration of soft tissue abnormalities as well as the reliable depiction of bone marrow oedema, undoubtedly an important biomarker for disease progression and treatment response especially in patients suffering from TMJ arthritis [3–8]. As opposed to bone marrow oedema representing an indicator for early bone involvement, flattening of the condylar head, osseous erosions, subchondral bone cysts and anterior osteophytes represent frequent findings in patients with advanced TMJ disease [2].
Although MRI has the ability to illustrate these findings, their true (i.e. in vivo) extent may be uncertain [9]. Based on the close observation of the cortical bone structures of paediatric TMJs in more than 100 MRI examinations per-formed at our institution per year, the hypothesis arose that the cortical bone structure of the mandibular condyle may present itself differently when different sagittal MRI sequen-ces are used. The reasons for these different appearansequen-ces are probably chemical shift and susceptibility artefacts occur-ring at the bordeoccur-ring regions between cortical bone and the adjacent soft tissue. These artefacts usually manifest as a loss of signal at bone–tissue interfaces owing to a de-phasing of signals. They usually produce an expanding low signal just beyond the periphery of cortical bone [10–12].
Therefore the purpose of this study was to determine the most suitable sagittal MRI sequence out of our standard TMJ protocol for the evaluation of the cortical bone of the mandibular condyles.
Materials and methods Subjects
Eight intact human cadaveric heads (5 female, 3 male; mean age, 81 years; age range, 65–95 years) were supplied by the Anatomical Institute of the local university in accordance with state and federal regulations (voluntary body donation programme on the basis of informed consent), the Convention on Human Rights and Medicine [13] and the recommendation of the National Academy of Medical Science [14]. Perfusion was carried out within 4 days of decease with a fixation solution consisting of two parts alcohol (70%), one part glyc-erine and 2% almudor (i.e. containing: 8.1% formaldehyde, 10% glyoxal and 3.7% glutaraldehyde).
Image data acquisition
All MRI examinations of all heads (n08) were carried out on a commercially available 1.5-T MRI unit (Signa HDx,
General Electric, Milwaukee, WI, USA) using a commer-cially available, two-channel phased array surface coil ded-icated to TMJ imaging (DUALTMJ coil). All examinations were performed in closed mouth position. All sagittal sequences were planned to be acquired parallel to the man-dibular rami, separately for each side (i.e. left and right). The MRI protocol included the following sagittal sequences: a T1-weighted 2D fast spoiled gradient recalled echo se-quence (T1-2D-FSPGR), an intermediate-weighted proton density fast spin echo sequence (PD-FSE), a T2-weighted fast spin echo sequence (T2-FSE), a T1-weighted 3D fast spoiled gradient recalled echo sequence (T1-3D-FSPGR) and a T1-weighted fast spin echo sequence (T1-FSE). For
the complete MRI protocol, please refer to Table 1. The
mean total examination time was 40 min per head.
In preparation for the micro-CT (μCT) examinations, a member of the Anatomical Institute resected and cleaned all mandibles. Subsequently the mandibular condyles and ar-ticular discs were separated from the rami at the level of the mandibular notch (i.e. at the incisura mandibulae). Care was taken not to injure the mandibular condyle during resection.
AllμCT examinations of the condyles (n016) were
per-formed using a commercially availableμCT unit (Specimen
microCT μCT 40, Scanco Medical, Brüttisellen,
Switzer-land) with all imaging parameters kept identical during all
examinations (tube voltage, 70 kV, tube current 114 μA;
isotropic resolution, 18μm).
One radiologist not involved in further data analysis
prepared allμCT data by reconstructing multi-planar
refor-matted (MPR) images in sagittal imaging planes aligned parallel to the mandibular ramus (i.e. corresponding to the alignment of the imaging planes of the sagittal MRI sequen-ces) at a reconstruction slice thickness of 1 mm and a reconstruction increment of 0.6 mm. Subsequently all reconstructed DICOM data were archived into the hospital’s PACS (picture archive and communication system) for stor-age and further imstor-age analysis.
Cortical bone thickness measurements
The thickness of the cortical bone (CBT) of the anterior, superior and posterior portions of the mandibular condyles was measured on all sagittal MRI sequences at the level of the centre of the mandibular condyle in a blinded fashion by two radiologists experienced in musculoskeletal radiology. All measurements were carried out using a calibrated
mea-surement tool that was part of the hospital’s PACS and
allowed for sub-millimetre measurements. A third radiolo-gist who was not involved in MRI measurements performed the corresponding CBT measurements on the sagittal MPR
images of the μCT data, which served as the standard of
Subjective evaluation of the cortical bone
In a separate analysis session, the same radiologists also assessed the anterior, superior and posterior portions of the mandibular condyles (n016) on the sagittal MRI sequences for cortical bone thinning, cortical bone erosions, irregular-ities of the cortical bone surface, subcortical bone cysts and the presence of an anterior osteophyte in a blinded fashion. The third radiologist not involved in MRI analysis assessed
theμCT data sets for the same findings to define the
stan-dard of reference for statistical analysis. See Fig. 1 for
micro-CT imaging examples.
Statistical analysis
All quantitative variables are described as mean ± standard deviation. The data were descriptively reviewed and
statis-tically analysed using Kolmogorov-Smirnov’s test for
nor-mality. P values <0.05 were considered statistically significant. All statistical analyses were performed using commercially available software (SPSS, release 17.0, Chi-cago, IL, USA).
Interobserver agreements regarding the presence of cor-tical bone thinning, corcor-tical bone erosions, irregularities of the cortical bone surface, subcortical bone cysts and the presence of an anterior osteophyte were analysed using Cohen’s kappa (κ) statistics and interpreted as follows: A κ-value greater than 0.81 corresponded to excellent agree-ment, 0.61–0.80 to very good interobserver agreeagree-ment, 0.41–0.60 to good interobserver agreement and 0.21–0.40 to moderate interobserver agreement. Interobserver agree-ments concerning all continuous variables (i.e. measure-ments of cortical bone thickness) were calculated using interclass correlation coefficients (ICC).
Diagnostic accuracy, sensitivity, specificity, positive pre-dictive value and negative prepre-dictive value regarding the assessment of cortical bone thinning, cortical bone erosions, cortical bone surface irregularities and subcortical bone cysts were assessed separately by both observers from chi-squared tests of contingency, and the 95% confidence inter-vals were calculated. The Wilcoxon signed ranks test was performed to test for statistically significant differences in cortical bone thickness measurements between the sagittal
MRI sequence and the μCT-based measurements, which
served as the standard of reference. Table 1 MRI protocol used for imaging of the temporo-mandibular joints
Axial T2-FRFSE Coronal T2-FRFSE Sagittal T1-2D-FSPGR Sagittal PD-FSE Sagittal T2-FSE Sagittal T1-3D-FSPGR Sagittal T1-FSE Coronal T1-SE Time to repetition (TR, ms) 3,000 3,000 370 3,200 6,820 11.6 640 500
Time to echo (TE, ms) 102 102 4.2 24 85 4.1 10.7 11
Flip angle (°) 90 90 80 90 90 20 90 90
Matrix (frequency × phase, pixels) 384×320 384×320 384×224 256×224 256×224 256×192 256×192 256×192
Slice thickness (mm) 3 3 2 2 2 2 2 2
Spacing (mm) 11.6 4.1 2 2 2 1 2 2
Field of view (FOV, cm2) 22 22 12 12 12 10 12 16
Band width (Hertz) 41.67 41.67 31.25 17.86 20.83 15.63 20.83 19.23
NEX (number of excitations) 4 4 3 3 4 3 3 3
Echo train length 21 21 – 8 16 – 3 –
FRFSE fast relaxation fast spin echo, FSPGR fast spoiled gradient recalled echo, FSE fast spin echo, SE spin echo
Fig. 1 Micro-CT imaging examples illustrating a cortical bone thin-ning of the superior portion of the mandibular condyle, b cortical erosion of the superior portion, c cortical surface irregularities of the
anterior portion, d a large subcortical bone cyst and e an anterior osteophyte
T able 2 Cortical bone thickness of the anterior , superior and posterior portions of the mandibular condyles as measured on all sagittal MRI sequences (mean of both readers, in mm) and on the micro-CT images Specimen T1-2D-FSPGR PD-FSE T2-FSE T1-3D-FSPGR T1-FSE Micro CT ANT SUP POST ANT SUP POST ANT SUP POST ANT SUP POST ANT SUP POST ANT SUP POST 1 0.74 0.52 0.33 0.94 0.66 0.35 0.66 0.66 0.66 0.70 0.39 0.45 0.66 0.67 0.64 0.78 0.51 0.50 2 0.74 0.52 0.34 0.94 0.47 0.67 0.66 0.68 0.66 0.70 0.38 0.66 0.66 0.49 0.47 0.68 0.32 0.56 3 0.75 0.33 0.48 0.66 0.66 0.48 0.94 0.94 0.48 0.82 0.54 0.48 0.94 0.66 0.55 0.89 0.44 0.42 4 0.66 0.33 0.33 0.94 0.66 0.66 0.94 0.64 0.66 0.70 0.44 0.29 0.94 0.66 0.67 0.70 0.35 0.40 5 0.70 0.58 0.52 0.95 0.57 0.66 0.66 0.70 0.66 1.02 0.61 0.39 0.96 0.70 0.66 0.92 0.59 0.37 6 0.70 0.52 0.33 0.94 0.49 0.47 0.68 0.66 0.66 0.78 0.39 0.36 0.94 0.50 0.68 0.71 0.31 0.24 7 0.66 0.52 0.33 0.68 0.56 0.50 0.68 0.66 0.66 0.70 0.42 0.28 0.94 0.66 0.66 0.64 0.49 0.24 8 0.54 0.35 0.33 0.66 0.60 0.47 0.66 0.60 0.66 0.70 0.47 0.28 0.66 0.56 0.49 0.66 0.48 0.25 9 0.66 0.99 0.34 0.94 1.05 0.66 0.94 0.93 0.66 1.03 1.24 0.53 0.94 1.07 0.66 0.94 0.96 0.47 10 0.86 0.85 0.52 1.06 0.94 0.94 0.94 1.05 0.66 0.98 1.15 0.55 1.05 0.95 0.66 0.91 0.90 0.48 1 1 0.97 0.52 0.47 0.94 0.66 0.66 1.05 0.66 0.67 1.19 0.44 0.56 1.03 0.66 0.45 0.96 0.46 0.36 12 0.70 0.52 0.47 0.94 0.66 0.67 0.94 0.65 0.66 0.81 0.30 0.62 0.94 0.66 0.66 0.85 0.33 0.47 13 0.74 0.50 0.33 0.66 0.47 0.42 0.66 0.66 0.66 0.88 0.83 0.28 0.53 0.67 0.47 0.80 0.72 0.26 14 0.97 0.52 0.50 1.06 0.66 0.47 1.06 0.66 0.66 0.87 0.28 0.20 1.05 0.66 0.45 0.86 0.29 0.17 15 0.66 0.52 0.52 0.94 0.94 1.06 0.66 1.05 1.05 0.81 0.70 0.73 0.66 0.66 1.05 0.73 0.63 0.63 16 0.52 0.52 0.52 0.66 0.94 0.66 0.66 0.94 0.66 0.62 0.44 0.44 0.66 0.66 0.66 0.49 0.45 0.42 Mean 0.72 0.54 0.42 0.87 0.69 0.61 0.80 0.76 0.67 0.83 0.56 0.44 0.85 0.68 0.62 0.78 0.51 0.39 ANT anterior ,SUP superior ,POST posterior
Results
Imaging findings
The cortical bone of a total of 16 mandibular condyles divided into anterior, superior and posterior portions was investigated (total number of sites048). Imaging findings included cortical thinning (n016), cortical erosions (n06), cortical surface irregularities (n024), subcortical bone cysts (n03) and an anterior osteophyte (n04).
Inter-observer agreements
Inter-observer agreements for performing all cortical bone thickness measurements were excellent (r00.83–0.99, P< 0.01). Thus the mean of both observers’ measurements was calculated and used for further statistical analyses.
Inter-observer agreements for the detection of cortical bone thinning, cortical bone erosions, cortical bone surface irregularities and subcortical bone cysts ranged from very good to excellent for all locations (i.e. anterior, superior and
posterior;κ00.67–0.85) and all MRI sequences (i.e.
T1-2D-FSPGR, T2-FSE, T1-3D-T1-2D-FSPGR, PD-FS and T1-FSE:κ0
0.74–0.88). Inter-observer agreement for the detection of an anterior osteophyte was excellent for all MRI sequences (κ01.0).
Objective analysis
All descriptive results for cortical bone thickness
measure-ments are summarised in Table2. Compared with the
μCT-based measurements, statistically significant differences were found for all cortical bone thickness measurements performed upon the T2-FSE, the PD-FSE and the T1-2D-FSPGR sequences (i.e. anterior, superior and posterior
portions) as well as the anterior and posterior cortical bone thickness measurements performed upon the T1-FSE (each P<0.05). No statistically significant differences were found for all T1-3D-FSPGR-based measurements (i.e. anterior [P00.14], superior [P00.60] and posterior [P00.22]) and for the superior T1-FSE-based measurements (P00.16)
when compared with theμCT-based measurements.
Subjective analysis
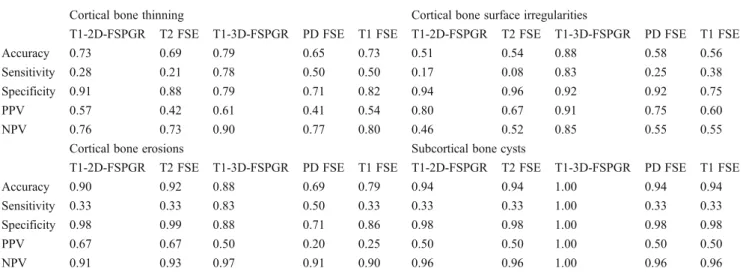
Accuracy, sensitivity, specificity, and positive and negative predictive values for the depiction of cortical thinning, cor-tical erosions, corcor-tical surface irregularities and subcorcor-tical
bone cysts are illustrated in Table 3. When compared with
theμCT-based evaluation, the T1-3D-FSPGR sequence was
the most reliable in the assessment of cortical thinning, cortical erosions, cortical surface irregularities and subcor-tical bone cysts for both readers. The depiction of an ante-rior osteophyte was perfect upon all sequences for both
readers. For imaging examples please refer to Figs.2and3.
Discussion
It was the purpose of this study to determine the most suitable sagittal MRI sequence for the evaluation of the cortical bone of the mandibular condyles. Our results strongly support the T1-weighted 3D fast spoiled gradient recalled echo sequence (i.e. T1-3D-FSPGR) to be the best suited MRI sequence for this task. This sequence may be added to any MRI protocol of the TMJ increasing the total examination time by approximately 6 min.
We discovered significant differences among the evalu-ated MRI sequences regarding objective and subjective cor-tical bone assessments. These differences could be attributed
Table 3 Results from subjective analysis (mean of both readers)
Cortical bone thinning Cortical bone surface irregularities
T1-2D-FSPGR T2 FSE T1-3D-FSPGR PD FSE T1 FSE T1-2D-FSPGR T2 FSE T1-3D-FSPGR PD FSE T1 FSE
Accuracy 0.73 0.69 0.79 0.65 0.73 0.51 0.54 0.88 0.58 0.56
Sensitivity 0.28 0.21 0.78 0.50 0.50 0.17 0.08 0.83 0.25 0.38
Specificity 0.91 0.88 0.79 0.71 0.82 0.94 0.96 0.92 0.92 0.75
PPV 0.57 0.42 0.61 0.41 0.54 0.80 0.67 0.91 0.75 0.60
NPV 0.76 0.73 0.90 0.77 0.80 0.46 0.52 0.85 0.55 0.55
Cortical bone erosions Subcortical bone cysts
T1-2D-FSPGR T2 FSE T1-3D-FSPGR PD FSE T1 FSE T1-2D-FSPGR T2 FSE T1-3D-FSPGR PD FSE T1 FSE
Accuracy 0.90 0.92 0.88 0.69 0.79 0.94 0.94 1.00 0.94 0.94
Sensitivity 0.33 0.33 0.83 0.50 0.33 0.33 0.33 1.00 0.33 0.33
Specificity 0.98 0.99 0.88 0.71 0.86 0.98 0.98 1.00 0.98 0.98
PPV 0.67 0.67 0.50 0.20 0.25 0.50 0.50 1.00 0.50 0.50
to previously described and well-known chemical shift and susceptibility artefacts occurring at the bordering regions between cortical bone and cartilage, fluid or soft-tissue
structures of the TMJ [10–12, 15–19]. The resulting
over-or underestimation, however, may lead to misinterpretation of the cortical bone surface and structure. Therefore, TMJ imaging protocols should be designed carefully to avoid such errors.
Over the last few years, the demand for cortical bone imaging using MRI has increased. As opposed to com-puted tomography (CT), which has been considered the imaging technique of choice for the depiction of osseous pathological features so far, MRI operates without apply-ing ionisapply-ing radiation to the patients. Continuous advan-ces in technology (i.e. higher magnetic field strengths, more efficient software) and the ongoing effort of the musculoskeletal research community have elevated MRI to become the new imaging method of choice for the assessment of cortical bone, especially for serial follow-up studies in young patients. Various study grofollow-ups have contributed to cortical bone imaging recently [20–22]. Louis et al. have demonstrated the power of high-resolution T1-weighted 3.0-T MRI in quantifying the cortical bone cross-sectional area at the level of the tibia in a comparison with quantitative CT [20]. Stehling et al. reported the delineation of the cortical bone of the
mandibular condyle to be significantly better on images derived from a 3.0-T MRI system rather than a 1.5-T MRI system [22].
When performing MRI of the TMJ it is essential to evaluate the structure, thickness and shape of the cortical bone of the mandibular condyle. In patients with TMJ arthritis, especially in young patients and children suffering from juvenile idio-pathic arthritis (JIA), the assessment of these cortical bone structures becomes even more important because cortical bone thinning, flattening of the mandibular condyle, the de-velopment of subchondral cysts and the presence of anterior osteophytes are regarded as biomarkers for MRI monitoring
of the activity and possible progression of JIA [5,7,8].
Abramowicz et al. reported various pathological findings of the mandibular condyle such as erosions, articular surface flattening, subchondral sclerosis and osteophytes [4]. In particular the assessment of subchondral sclerosis may be challenged in this content because false-positive results may be acquired due to chemical shift artefacts. However, Abra-mowicz et al. evaluated the mandibular condyles upon T1-weighted and intermediate proton-density-T1-weighted MR sequences. We were able to show significant differences in cortical bone thickness of the mandibular condyle between those two sequences, thus yielding a potential source of error for the assessment of subchondral sclerosis and corti-cal bone structure.
Fig. 2 a 2D fast spoiled gradient recalled echo (2D FSPGR), b intermediate-weighted proton density fast spin echo (PD-FSE), c T2-weighted fast spin echo (T2-FSE), d T1-T2-weighted 3D fast spoiled gradient recalled echo (T1-3D-FSPGR) and e T1-weighted fast spin
echo sequences (T1-FSE). The cortical surface irregularities of the superior portion confirmed by f micro CT are depicted by the T1-3D-FSPGR sequence only and seem to be absent on all other sequences
Fig. 3 Imaging example illustrating the ability of the T1-3D-FSPGR sequence to depict a subcortical bone cysts, b osseous erosions, c
cortical bone surface irregularities and d the presence of an anterior osteophyte and cortical bone thinning of the superior portion
In a very recent publication on dynamic contrast-enhanced MRI of the TMJ, Tasali et al. described condylar sclerosis as one of their MRI findings [15]. However, no further details were provided on the definition of sclerosis and how it was assessed during image analysis. Because of the variable presentation of cortical bone on different sagit-tal MRI sequences, false-positive findings may become difficult to avoid.
Our study has some limitations. First, the number of evaluated specimens is low (n016). However, for the cho-sen approach relying on cadaveric material this was the maximum number of specimens that could be obtained. Second, we limited our evaluation to the sagittal imaging plane. For the declared objective of our study, we consid-ered the restriction appropriate as the sagittal imaging planes are the most important imaging planes in the MRI assess-ment of the TMJ.
In conclusion, our study showed that the T1-weighted 3D FSPGR sequence was the most suitable MRI method for the objective and subjective assessments of the cortical bone of the mandibular condyle.
Acknowledgements The authors would like to thank L. Völlmer, M. Studhalter, B. Werner and A. Jezler for their technical and logistical assistance.
References
1. Magnusson T, Egermark I, Carlsson GE (2000) A longitudinal epidemiologic study of signs and symptoms of temporomandibular disorders from 15 to 35 years of age. J Orofac Pain 14:310–319 2. Moen K, Hellem S, Geitung JT, Skartveit L (2010) A practical
approach to interpretation of MRI of the temporomandibular joint. Acta Radiol 51:1021–1027
3. Cannizzaro E, Schroeder S, Muller LM, Kellenberger CJ, Saurenmann RK (2011) Temporomandibular joint involvement in children with juvenile idiopathic arthritis. J Rheumatol 38:510–515
4. Abramowicz S, Cheon JE, Kim S, Bacic J, Lee EY (2011) Mag-netic resonance imaging of temporomandibular joints in children with arthritis. J Oral Maxillofac Surg 69:2321–2328
5. Müller L, Kellenberger CJ, Cannizzaro E et al (2009) Early diag-nosis of temporomandibular joint involvement in juvenile idio-pathic arthritis: a pilot study comparing clinical examination and ultrasound to magnetic resonance imaging. Rheumatology (Ox-ford) 48:680–685
6. Lewis EL, Dolwick MF, Abramowicz S, Reeder SL (2008) Con-temporary imaging of the temporomandibular joint. Dent Clin North Am 52:875–890
7. Boyesen P, Haavardsholm EA, van der Heijde D et al (2011) Prediction of MRI erosive progression: a comparison of modern imaging modalities in early rheumatoid arthritis patients. Ann Rheum Dis 70:176–179
8. Lee EY, Sundel RP, Kim S, Zurakowski D, Kleinman PK (2008) MRI findings of juvenile psoriatic arthritis. Skeletal Radiol 37:987–996
9. McGibbon CA, Bencardino J, Yeh ED, Palmer WE (2003) Accu-racy of cartilage and subchondral bone spatial thickness distribu-tion from MRI. J Magn Reson Imaging 17:703–715
10. Reichert IL, Benjamin M, Gatehouse PD et al (2004) Magnetic resonance imaging of periosteum with ultrashort TE pulse sequen-ces. J Magn Reson Imaging 19:99–107
11. Phan CM, Matsuura M, Bauer JS et al (2006) Trabecular bone structure of the calcaneus: comparison of MR imaging at 3.0 and 1.5 T with micro-CT as the standard of reference. Radiology 239:488–496
12. McGibbon CA, Dupuy DE, Palmer WE, Krebs DE (1998) Carti-lage and subchondral bone thickness distribution with MR imag-ing. Acad Radiol 5:20–25
13. European Union (2002) Additional protocol to the convention on human rights and biomedicine, on transplantation of organs and tissues of human origin. ETS 186, Article 16–18
14. Swiss Academy of Medical Science (2008) Verwendung von Lei-chen und LeiLei-chenteilen in der medizinisLei-chen Forschung sowie Aus-, Weiter- und Fortbildung. Medical–Ethical Guidelines and Recommendations, pp 1–11
16. McGibbon CA (2003) Inter-rater and intra-rater reliability of sub-chondral bone and cartilage thickness measurement from MRI. Magn Reson Imaging 21:707–714
17. McGibbon CA, Bencardino J, Palmer WE (2003) Subchondral bone and cartilage thickness from MRI: effects of chemical-shift artifact. MAGMA 16:1–9
18. Peh WC, Chan JH (2001) Artifacts in musculoskeletal magnetic resonance imaging: identification and correction. Skeletal Radiol 30:179–191
19. Zand KR, Reinhold C, Haider MA, Nakai A, Rohoman L, Maheshwari S (2007) Artifacts and pitfalls in MR imaging of the pelvis. J Magn Reson Imaging 26:480–497
20. Louis O, Cattrysse E, Scafoglieri A, Luypaert R, Clarys JP, de Mey J (2010) Accuracy of peripheral quantitative computed tomogra-phy and magnetic resonance imaging in assessing cortical bone cross-sectional area: a cadaver study. J Comput Assist Tomogr 34:469–472
21. Issever AS, Link TM, Newitt D, Munoz T, Majumdar S (2010) Interrelationships between 3-T-MRI-derived cortical and trabecular bone structure parameters and quantitative-computed-tomography-derived bone mineral density. Magn Reson Imaging 28:1299–1305 22. Stehling C, Vieth V, Bachmann R et al (2007) High-resolution magnetic resonance imaging of the temporomandibular joint: im-age quality at 1.5 and 3.0 Tesla in volunteers. Invest Radiol 42:428–434
15. Tasali N, Cubuk R, Aricak M et al (2011) Temporomandibular joint (TMJ) pain revisited with dynamic contrast-enhanced mag-netic resonance imaging (DCE-MRI). Eur J Radiol. doi:10.1016/j. ejrad.2011.01.044