Decrease in the prevalence of paediatric adiposity in
Switzerland from 2002 to 2007
Isabelle Aeberli
1,2,*, Rachel S Ammann
1, Marisa Knabenhans
1, Luciano Molinari
3and
Michael B Zimmermann
1,41Human Nutrition Laboratory, Institute of Food Science and Nutrition, ETH Zurich, LFV D11, Schmelzbergstrasse 7, CH-8092 Zurich, Switzerland:2Clinic for Endocrinology and Diabetes, University Hospital Zurich, Zurich, Switzerland:3Child Development Center, University Children’s Hospital, Zurich, Switzerland:4Division of Human Nutrition, Wageningen University, Wageningen, The Netherlands
Submitted 3 December 2008: Accepted 11 August 2009: First published online 22 September 2009 Abstract
Objective: A national study in Switzerland in 2002 suggested nearly one in five schoolchildren was overweight. Since then, many programmes have been intro-duced in an attempt to control the problem. The aim of the present study was to determine the prevalence of childhood overweight in Switzerland five years later. Design: In both studies a cross-sectional, three-stage, probability-proportional-to-size cluster sampling of schools throughout Switzerland was used to obtain a representative sample of approximately 2500 children aged 6–13 years. Height and weight were measured and BMI calculated. The BMI references from the Centers for Disease Control and Prevention were used to determine the pre-valences of underweight (,5th percentile), overweight ($85th and ,95th per-centile) and obesity ($95th perper-centile).
Results: In 2007 the prevalences of underweight, overweight and obesity in boys were 3?5 %, 11?3 % and 5?4 %, respectively; in girls they were 2?6 %, 9?9 % and 3?2 %. Compared with 2002, there was a significant decrease in the prevalence of overweight in girls and of obesity in both genders. In contrast to 2002, where there were no differences, in 2007 the prevalence of paediatric obesity was sig-nificantly higher in communities with a population .100 000 compared with smaller communities (P , 0?05).
Conclusions: In summary, over the past 5 years, the prevalence of adiposity has decreased in Swiss children. These findings suggest that increased awareness combined with mainly school-based programmes aimed at physical activity and healthy nutrition may have helped to control this public health problem. Future monitoring in Switzerland will determine if these findings are sustained.
Keywords Overweight Underweight Switzerland Childhood obesity prevalence
Over the past few decades, childhood overweight has emerged as an important public health problem world-wide(1–3). In the USA the prevalence of obesity (BMI $ 95th percentile) in 6- to 11-year-old children has increased from 4?2 % in the 1960s to 18?8 % in 2004(3,4). Although in most European countries the prevalences are somewhat lower, there have also been dramatic increases over the past few decades(1). Recently, however, several countries including France, Italy and Sweden have reported a stabilization or a decrease in the prevalence of childhood overweight(5–9).
In 2002, the first nationally representative study deter-mining the prevalence of childhood overweight and obesity in Switzerland reported that almost 20 % of primary-school children were overweight and of those over 6 % were obese(10). Compared with regional data from the 1960s and the 1980s, these numbers represented more than a fivefold increase for the overall overweight prevalence(10).
Since the publication of these data, awareness of the problem in Switzerland has increased and different pro-grammes and initiatives have been launched in order to combat childhood overweight. Therefore the aim of the present follow-up study was to monitor the development of the childhood overweight prevalence and to determine whether the situation has changed over the examined period of 5 years. In addition, the prevalence of under-weight was assessed for both time points in order to see whether a change in the prevalence of overweight also affects the rate of underweight.
Subjects and methods Subjects
For both 2002 and 2007, a probability-proportional-to-size cluster sampling based on current census data was used to
obtain a representative national sample of 2500 Swiss chil-dren aged 6–13 years. This sample size represents about one in 250 children in this age group in Switzerland (Swiss Federal Department of Statistics, personal communication). The country was divided into five regions: south (Italian language), north-east (German language), north-west (German language), central east (German language) and west (French language). Furthermore, all communities were grouped into strata by population size: ,10 000, between 10 000 and 100 000, and .100 000 inhabitants. By stratified random selection, sixty schools were identified across Switzerland; the stratification scheme has been described in more detail previously(10). After acceptance of participation of the schools, three or four classes (depending on class sizes) were randomly selected from each school and all students from those classrooms were invited to participate. The average number of participants per school was forty-five students in 2002 and thirty-eight students in 2007, but it varied according to class sizes and response rate. The data from the study conducted in 2002 have been published elsewhere(10,11).
Ethical approval for both studies was obtained from the Swiss Federal Institute of Technology, Zurich, Switzer-land. Written informed consent was obtained from all parents or guardians of the participating children and oral assent was obtained from the children.
Methods
Before the measurements, which took place over the entire school day, the subjects removed their shoes or slippers as well as pullovers, emptied their pockets and wore only light indoor clothing. Height and weight were measured using standard anthropometric techniques(12). Body weight was measured to the nearest 0?1 kg using a digital scale (BF 18; Breuer, Ulm, Germany) calibrated with standard weights. Height was measured to the nearest 0?1 cm using a portable stadiometer (Seca 214; Seca Medizinische Waagen und Messsysteme, Hamburg, Germany). BMI was calcu-lated as weight divided by the square of height (kg/m2). All measurements were done by the same two trained inves-tigators at each time point; however, the invesinves-tigators were not the same in 2002 and 2007.
All heads of the schools participating in the study were given a questionnaire to fill out asking about measures taken with regard to increasing physical activity and/or improving nutrition during the past 5 years.
Statistical analysis
To define underweight, overweight and obesity, the 5th, 85th and 95th BMI-for-age reference percentiles of the Centers for Disease Control and Prevention were used(13); these have previously been validated in Swiss primary-school children(11). Statistical analysis was performed using SPLUS R 8?0 Enterprise Developer (Insightful
Cor-poration, Seattle, WA, USA), SPSS for Windows version
16 (SPSS Inc., Chicago, IL, USA) as well as Microsoft R
Excel 2003 (Microsoft Corp., Redmond, WA, USA) soft-ware packages. The x2 test was used to check for sig-nificant differences between prevalences at the two time points and the z test to check for significant differences between means in 2002 and 2007. The level of sig-nificance was set at 0?05.
To analyse for geographic differences, the five clusters that had been used for the sampling (described in detail above) were applied. For demographic differences, the strata by population size (also explained above) were used.
Results
Basic characteristics of the subjects in both study groups are displayed in Table 1. In the 2002 study, fifty-seven schools accepted to participate in the study; in these schools, 3414 children and their parents were invited to take part in the measurements and 2672 accepted. At the day of measurement sixty-four were absent, which resulted in an overall participation rate of 76?4 %. After excluding subjects with incomplete data as well as a small number of children aged below 6 or above 13 years, a total of 2431 subjects remained, which consisted of 1196 boys (mean age 9?8 (SE0?05) years) and 1235 girls (mean
age 9?8 (SE0?05) years).
In 2007, at the sixty schools which accepted to parti-cipate in the study, 3188 children and their parents were invited to take part in the examinations. Of these, 2395 accepted to participate, but eighty-five were absent at the day of measurement. The overall response rate was 72?5 %. After excluding eighty-eight subjects who were either below 6 years of age or above 13 years of age, 2222 children remained. The final sample consisted of 1083 boys (mean age 10?0 (SE0?05) years) and 1139 girls (mean
age 10?0 (SE 0?05) years).
Detailed results on the prevalences of overweight and obesity in 2002 have been published elsewhere(10,11). The prevalences of underweight (,5th percentile), overweight ($85th and ,95th percentile) and obesity
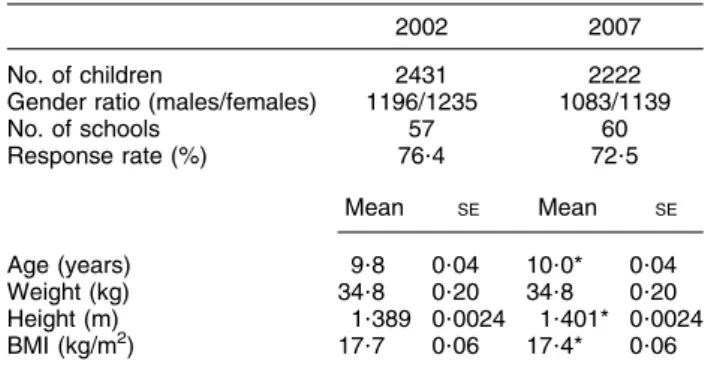
Table 1 Basic characteristics of the national samples of Swiss children in 2002 and 2007
2002 2007
No. of children 2431 2222
Gender ratio (males/females) 1196/1235 1083/1139
No. of schools 57 60 Response rate (%) 76?4 72?5 Mean SE Mean SE Age (years) 9?8 0?04 10?0* 0?04 Weight (kg) 34?8 0?20 34?8 0?20 Height (m) 1?389 0?0024 1?401* 0?0024 BMI (kg/m2) 17?7 0?06 17?4* 0?06
($95th percentile) by age in 2007 are given in Table 2. The prevalences of underweight, overweight and obesity did not differ significantly between the different age groups. There was no significant gender difference for underweight and overweight children, but the prevalence of obese boys was significantly higher than the pre-valence of obese girls (P , 0?05).
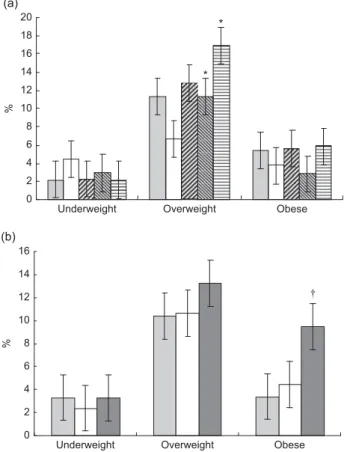
The geographic and demographic differences in underweight, overweight and obesity in 2007 are dis-played in Fig. 1. In the study from 2002, no significant geographic or demographic differences had been observed(10). In 2007, however, the prevalence of over-weight was highest in the southern region, but the dif-ference reached significance only compared with the central eastern region (P 5 0?03). The prevalence of overweight was significantly higher in the north-western region compared with the central eastern region (P 5 0?03). The geographic differences in the prevalences of underweight or obesity were not significant. The pre-valences of both overweight and obesity were higher in communities with a population above 100 000 compared with the two smaller categories, but only the difference for obesity prevalence was statistically significant (P , 0?05).
The prevalences of underweight, overweight and obesity for both time points are displayed in Table 3. The prevalence of underweight has not changed significantly over the 5 years, but the prevalences of overweight and obesity have decreased. For boys, the decrease in over-weight was not significant (P 5 0?37), but for girls it was (P , 0?01). For obesity, the decrease was significant in both boys (P 5 0?049) and girls (P , 0?01).
About 60 % of the schools responded to the ques-tionnaire about measures being taken to reduce over-weight and obesity. Of these, 83 % said they had initiated a programme emphasizing physical activity and 75 % said they had taken action to encourage healthy eating. The actions taken varied widely; from very basic information
(such as advising children to walk or cycle to school and bring healthy snacks to school) to more extensive projects lasting weeks or the entire school year.
Table 2 The prevalence of underweight, overweight and obesity in a national sample of Swiss children in the year 2007 by age, using the CDC BMI reference criteria
BMI (kg/m2) Underweight Overweight Obese
Age Mean SE % SE % SE % SE 6 years (n 57) 15?9 0?18 1?8 1?7 17?5 5?04 0 7 years (n 319) 16?3 0?12 3?4 1?02 11?3 1?77 6?3 1?36 8 years (n 324) 16?5 0?11 2?5 0?86 12?0 1?81 2?2 0?81 9 years (n 378) 17?2 0?13 2?6 0?83 11?9 1?67 4?5 1?07 10 years (n 387) 17?6 0?14 2?8 0?84 8?8 1?44 4?9 1?10 11 years (n 355) 18?2 0?15 5?1 1?16 11?8 1?71 4?2 1?07 12 years (n 402) 18?6 0?14 2?2 0?74 8?0 1?35 4?0 0?98 All (n 2222) 17?4 0?06 3?06 0?37 11?0 0?66 4?2 0?40 Boys (n 1083) 17?5 0?08 3?51 0?56 11?5 0?98 5?26 0?68 Girls (n 1139) 17?4 0?08 2?63 0?47 10?0 0?89 3?25* 0?53
CDC, Centers for Disease Control and Prevention.
CDC BMI reference criteria(13): underweight, BMI-for-age ,5th percentile; overweight, BMI-for-age $85th and ,95th percentile; obese, BMI-for-age $95th percentile.
None of the prevalences were significantly different between the age groups as assessed by the x2 test. *Mean value was significantly different from that of boys: P , 0?05.
(a) 0 2 4 6 8 10 12 14 16 18 20 Underweight Overweight % (b) 0 2 4 6 8 10 12 14 16
Underweight Overweight Obese
%
*
*
Obese
Fig. 1 (a) Geographic ( , west; , central east; , north-west;
, north-east; , south) and (b) demographic ( , ,10 000
inhabitants; , 10 000–100 000 inhabitants; , .100 000
inhabi-tants) differences in the prevalences of underweight, overweight and obesity in a national sample of 6- to 13-year-old children (n 2222) in Switzerland in 2007, with standard errors represented by vertical bars. *Prevalence was significantly different from that in
the central eastern region (P , 0?05); †prevalence was
Discussion
Compared with the national study conducted in the year 2002(10,11), the present data from 2007 show a decrease in the prevalence of overweight and obesity in both boys and girls. Even though the difference is significant in all but overweight boys, we have to be careful with the interpretation. The procedure for the selection of the schools asked to participate in the study was the same as for the 2002 study, only using more recent census data provided by the Federal Statistical Office. Further, it was ensured in both studies that the sampling scheme was followed very closely. In 2007 it was possible to recruit the appropriate number of schools from each cluster and stratum, while in 2002 three schools were missing. However, those three missing schools were all in different regions and did not represent the same demographic stratum either. Thus, the two samples should be com-parable. Although the mean age of the children studied in 2007 was statistically significantly greater than the children studied in 2002, the mean difference was small (0?2 years) and is unlikely to be relevant for the outcomes of the study, particularly because the prevalences were calculated based on age-specific cut-off points. This dif-ference is likely due to the fact that the sampling period was slightly longer in 2007 compared with 2002. The response rate of the children in 2007 was 73 %, slightly below the response rate of 2002 (76 %). These 3 % would most probably not influence the result greatly if the children who declined participation were equally dis-tributed over the whole range of body weight; whether this is the case is difficult to judge. Public awareness of the problem of childhood obesity has increased over the past 5 years and this may have caused more parents to consent for their children to participate or, alternatively, may have led some to exclude their overweight children to avoid stigmatization.
Up to 2003, all European countries where data were available had shown increasing prevalences of childhood overweight(1). However, recent reports from several European countries(5–9)and the USA(14)show that childhood
obesity prevalences may be levelling off or decreasing slightly over the past few years. In two studies in French children – one sample between 6 and 15 years of age, the other between 7 and 9 years – a stabilization of childhood overweight was observed between 1998 and 2006 and 2000 and 2007, respectively, with a higher prevalence remaining in disadvantaged groups(5,9). Simi-lar trends of stabilization were found in a study analys-ing data between 1999 and 2003 in 10-year-old children in Stockholm County, Sweden(7); while in Go¨teborg, Sweden, similar to our study, the prevalence of over-weight decreased in 10-year-old girls and was stable in 10-year-old boys between 2000–1 and 2004–5(6).
Compared with 2002, in 2007 we found significant differences in the rates of childhood obesity when com-paring communities with populations below and above 100 000 inhabitants. In general, comparing the answers received from the schools with regard to measures taken to combat overweight or obesity, we could not discern differences between those from different sized commu-nities. However, it is possible that programmes to increase physical activity have had a bigger impact in more rural areas where children likely have more opportunity to move and play outside, compared with the bigger cities. None of the recent studies reporting a stabilization or decrease in the prevalence of childhood obesity(5–9,14) have analysed their data for demographic changes. The French and one of the Swedish studies(5,7,9)reported that lower socio-economic groups showed a higher over-weight prevalence and the US study(14) reported ethnic differences in adiposity. However, we do not have information on either socio-economic or ethnic differ-ences in our sample.
The reported change in paediatric obesity is likely due to an increasing awareness of the public health importance of this topic over the past few years. As a result, a whole range of programmes and projects has been designed and conducted to counteract the alarming increase shown. Although most programmes were rather small and either school- or community-based and not conducted nationwide, it may well be that the accumulation Table 3 Prevalence of underweight, overweight and obesity in children in Switzerland in the national studies from 2002
and 2007 by sex using the CDC BMI reference criteria
Underweight Overweight Obese Overweight 1 obesity
% SE % SE % SE % SE 2002 Boys 3?0 0?49 12?5 0?96 7?4 0?80 19?9 1?19 Girls 2?7 0?46 13?2 0?96 5?7 0?71 18?9 1?12 2007 Boys 3?5 0?56 11?5 0?98 5?3* 0?68 16?8 1?12 Girls 2?6 0?46 10?0* 0?89 3?3* 0?53 13?3* 0?98
CDC, Centers for Disease Control and Prevention.
CDC BMI reference criteria(13): underweight, BMI-for-age ,5th percentile; overweight, BMI-for-age $85th and ,95th percentile; obese, BMI-for-age $95th percentile; overweight 1 obesity, all children with BMI-for-age $85th percentile.
of all these programmes has resulted in an overall decrease or at least a stabilization of the prevalence of overweight and obesity in children in Switzerland.
It would go beyond the aim of the present paper to review all the programmes and projects that have been conducted in Switzerland in the past few years; however, a short overview of a selection is given hereafter. First, there are several different clinics as well as other orga-nizations that offer in- or outpatient treatment pro-grammes for obese children and adolescents. Moreover, an important player in the field of overweight prevention and intervention in Switzerland is Suisse Balance, a nationwide initiative financed through the Federal Office of Public Health and the foundation ‘Gesundheitsfo ¨rder-ung Schweiz’, which on its part is sponsored by the cantons of Switzerland as well as different insurance companies. Suisse Balance supports projects and initia-tives to promote a healthy lifestyle, more physical activity and well-balanced nutrition. Several projects concentrat-ing on nutrition and physical activity in children have already been launched and some even completed (www.suissebalance.ch). A wide variety of other, mostly smaller programmes and projects is ongoing. A variety of such projects can be found on the website of the ‘Schweizerische Netzwerk gesundheitsfo¨rdernder Schulen’ (http://www.gesunde-schulen.ch/html/projektbrowser.html). Judging from the questionnaires returned from the par-ticipating schools, where over 80 % reported emphasizing physical activity and 75 % healthy eating, the motivation of the schools to do something seems to be rather high. However, as those were all small programmes not con-ducted under scientific supervision, almost none of them have been validated with respect to their actual impact on the children’s weight. We cannot therefore prove any causal effect of these programmes on the decrease in overweight and obesity shown. Further, as the aim of many of the programmes was to change the children’s behaviour over the long term in a way that promotes physical activity and/ or teaches the children about a healthy diet, it is even more difficult to evaluate the effect in numbers over a rather short time period. In France, the stabilization of the prevalence of childhood obesity observed in 2006 and 2007, respectively, followed the launch of a Nutrition and Health National Programme established by the government(5,9); however, even there it is not possible to prove a causal relationship between this programme and the stabilization. Similar to Switzerland, no national or regional programme aiming at a reduction in childhood obesity preceded the stabiliza-tion of the situastabiliza-tion in Sweden, but the increased public awareness of the problem since publication of earlier results is mentioned as a possible factor(6).
Another potentially important factor to control child-hood obesity, besides the action being taken by schools and communities, is the relatively strict regulation of Swiss television advertising to children and adolescents. The Swiss Radio and Television Law has included regulations
for the protection of children and adolescents from advertising since 1991. However, in the beginning those regulations were not very specific. Since 1997, any advertisement which plays on the credulity of children or the lack of experience of adolescents is prohibited. Since the beginning of 2007, it is now no longer allowed to interrupt children’s television programmes by commer-cials. However, these regulations are not likely to be responsible for the current improvement in the childhood overweight prevalence unless it is assumed that the changes made in 1997 only showed their effects more than 5 years later. But even in general programming, no more than 15 % of daily airtime can be used for adver-tisements. This limits children’s exposure to advertising for energy-dense foods, which in the USA has been shown to be a risk factor for weight gain(15).
Thus, considerable action has been taken in order to combat overweight and obesity in Swiss schoolchildren; this may have contributed to our findings of a lower prevalence. Our findings suggest the increasing pre-valence of childhood overweight and obesity in Switzer-land until 2002 may be coming under control, although nearly one in six children remains overweight or obese. Thus, treatment programmes should continue to focus on severely obese children and try to reach as many of them as possible, while prevention programmes should focus on the general population. Monitoring and evaluation of the programmes introduced in Switzerland should help to determine which approaches are most effective. How-ever, it seems to be essential to combine healthy eating with increased physical activity in enjoyable ways so that children continue to follow them in their daily routines after they finish school.
Acknowledgements
The study was financed by the Swiss Federal Office of Public Health. None of the authors had personal or financial conflict of interests regarding the current paper. Each of the authors contributed to the study design and data analysis. Data collection was done by I.A., R.S.A. and M.K. The first draft of the paper was written by I.A. and edited by the other authors. The authors would like to thank the teachers and children at the participating schools for their cooperation.
References
1. Branca F, Nikogosian H & Lobstein TJ (2007) The Challenge
of Obesity in the WHO European Region and the Strategies for Response. Copenhagen: WHO Regional Office for Europe.
2. Carroquino MJ (2007) Prevalence of Excess Body
Weight and Obesity in Children and Adolescents. ENHIS Fact Sheet no. 23. Copenhagen: WHO Regional Office for Europe.
3. Ogden CL, Carroll MD, Curtin LR, McDowell MA, Tabak CJ & Flegal KM (2006) Prevalence of overweight and obesity in the United States, 1999–2004. JAMA 295, 1549–1555.
4. Ogden CL, Flegal KM, Carroll MD & Johnson CL (2002)
Prevalence and trends in overweight among US children and adolescents, 1999–2000. JAMA 288, 1728–1732.
5. Peneau S, Salanave B, Maillard-Teyssier L et al. (2009)
Prevalence of overweight in 6- to 15-year-old children in central/western France from 1996 to 2006: trends toward stabilization. Int J Obes (Lond) 33, 401–407.
6. Sjoberg A, Lissner L, Albertsson-Wikland K & Marild S
(2008) Recent anthropometric trends among Swedish school children: evidence for decreasing prevalence of overweight in girls. Acta Paediatr 97, 118–123.
7. Sundblom E, Petzold M, Rasmussen F, Callmer E & Lissner L
(2008) Childhood overweight and obesity prevalences levelling off in Stockholm but socioeconomic differences persist. Int J Obes (Lond) 32, 1525–1530.
8. Lazzeri G, Rossi S, Pammolli A, Pilato V, Pozzi T & Giacchi
MV (2008) Underweight and overweight among children and adolescents in Tuscany (Italy). Prevalence and short-term trends. J Prev Med Hyg 49, 13–21.
9. Salanave B, Peneau S, Rolland-Cachera MF, Hercberg S &
Castetbon K (2009) Stabilization of overweight prevalence in French children between 2000 and 2007. Int J Pediatr Obes 4, 66–72.
10. Zimmermann MB, Gubeli C, Puntener C & Molinari L
(2004) Overweight and obesity in 6–12 year old children in Switzerland. Swiss Med Wkly 134, 523–528.
11. Zimmermann MB, Gubeli C, Puntener C & Molinari L
(2004) Detection of overweight and obesity in a national sample of 6–12-y-old Swiss children: accuracy and validity of reference values for body mass index from the US Centers for Disease Control and Prevention and the International Obesity Task Force. Am J Clin Nutr 79, 838–843.
12. World Health Organization (1995) Physical Status: The Use
and Interpretation of Anthropometry. Report of a WHO Expert Committee. WHO Technical Report Series no. 854. Geneva: WHO.
13. Ogden CL, Kuczmarski RJ, Flegal KM, Mei Z, Guo S, Wei R,
Grummer-Strawn LM, Curtin LR, Roche AF & Johnson CL (2002) Centers for Disease Control and Prevention 2000 growth charts for the United States: improvements to the 1977 National Center for Health Statistics version. Pedia-trics 109, 45–60.
14. Ogden CL, Carroll MD & Flegal KM (2008) High body mass
index for age among US children and adolescents, 2003–2006. JAMA 299, 2401–2405.
15. Coon KA & Tucker KL (2002) Television and children’s
consumption patterns. A review of the literature. Minerva Pediatr 54, 423–436.