Advance Access publication 27 March 2009
Introduction
Digital, computer-based three-dimensional (3D) study models are an alternative to plaster models. Users of digital models can retrieve and store their records electronically, reducing the chance of loss or damage and reducing storage space. A virtual 3D set of models can be manipulated in all planes of space, sectioned in any plane and measured along any plane. The virtual images can be sent worldwide for instant referral or consultation as needed, for Internet study groups or research purposes. Because computer-based 3D study models are a component of the digital orthodontic record, they contribute to a paperless offi ce. Digital models have been shown to be a valid tool for undertaking simple diagnostic measurements such as tooth size, arch width, overjet, overbite, arch length, and Bolton ratio ( Tomassetti et al. , 2001 ; Santoro et al. , 2003 ; Zilberman et al. , 2003 ; Quimby et al. , 2004 ; Stevens et al. , 2006 ). For direct measurements, the above authors did not fi nd clinically signifi cant differences between measurements made on digital or plaster models. Statistical differences were found for tooth width by Santoro et al. (2003) and Zilberman et al. (2003) . Shrinkage of alginate and diffi culties in identifying landmarks of a 3D image on a two-dimensional (2D) screen are mentioned explanations. One of the greatest sources of random error is the diffi culty in identifying landmarks ( Houston, 1983 ). Zilberman et al. (2003) stated that this is a particular concern for digital models because a 3D structure is viewed as a 2D image and identifying landmarks becomes more diffi cult. Quimby et al. (2004) and Stevens et al. (2006) found no statistical differences between measure ments made on plaster or digital models.
Index of Complexity, Outcome and Need scored on plaster and
digital models
A. C. Veenema * , C. Katsaros *** , S. C. Boxum ** , E. M. Bronkhorst * and
A. M. Kuijpers-Jagtman *
* Departments of Orthodontics and Oral Biology and Community and Restorative Dentistry, Radboud University Nijmegen Medical Centre, ** Department of Orthodontics, University Medical Centre Groningen, The Netherlands and *** Department of Orthodontics and Dentofacial Orthopedics, University of Bern, Switzerland
SUMMARY The aim of this study was to compare standard plaster models with their digital counterparts for the applicability of the Index of Complexity, Outcome, and Need (ICON). Generated study models of
30 randomly selected patients: 30 pre- (T 0 ) and 30 post- (T 1 ) treatment. Two examiners, calibrated in the
ICON, scored the digital and plaster models. The overall ICON scores were evaluated for reliability and reproducibility using kappa statistics and reliability coeffi cients.
The values for reliability of the total and weighted ICON scores were generally high for the T 0 sample
(range 0.83 – 0.95) but less high for the T 1 sample (range 0.55 – 0.85). Differences in total ICON score between
plaster and digital models resulted in mostly statistically insignifi cant values ( P values ranging from 0.07
to 0.19), except for observer 1 in the T 1 sample. No statistically different values were found for the total
ICON score on either plaster or digital models.
ICON scores performed on computer-based models appear to be as accurate and reliable as ICON scores on plaster models.
Besides direct measurements, other methods are used to quantify malocclusion and treatment results, such as occlusal indices.
Numerous indices have been developed since the 1960s either to rank or score the severity of malocclusion relative to a pre-conceived orthodontic ideal, or in terms of treatment need ( Draker, 1960 ; Salzmann, 1968 ; Summers, 1971 ; Linder-Aronson, 1974 ; Lundström, 1977 ; Brook and Shaw, 1989 ; Buchanan, 1991 ; Shaw et al. , 1991 ; Richmond et al. , 1992 ; Casko et al. , 1998 ; Daniels and Richmond, 2000 ). Examples of these indices are the Dental Aesthetic Index (DAI), the Peer Assessment Rating (PAR) Index, the Index of Orthodontic Treatment Need (IOTN), American Board of Orthodontics Objective grading system (ABO-OGS), and the Index of Complexity Outcome, and Need (ICON). From the various indices only two, PAR and ABO-OGS, have been compared for digital and plaster study models. For the PAR Index, two studies did not fi nd signifi cant differences ( Mayers et al. , 2005 ; Stevens et al. , 2006 ). For the ABO-OGS, statistically signifi cant differences were found ( Costalos et al. , 2005 ; Okunami et al. , 2007 ) for the components ‘ alignment ’ and ‘ buccolingual inclination ’ ( Costalos et al. , 2005 ) and ‘ occlusal contacts and relationships ’ ( Okunami et al. , 2007 ). According to those authors, possible explanations for these differences might be the diffi culty in identifying the same landmarks on plaster and digital models, a need for adequate calibration to achieve repeatability in both methods and a difference in angulation of the models while measurements were taken. Although some fi ndings showed statistical differences, clinically the differences were too small to be noticed during
Table 2 Protocol for occlusal trait scoring (reproduced from Daniels C, Richmond S 2000. The development of the Index of Complextity, Outcome and Need (ICON). Journal of Orthodontics 27:149–162, with kind permission of Maney Publishing) .
Score 0 1 2 3 4 5
Aesthetic 1 – 10 as judged using IOTN-AC Upper arch
crowding
Score only the highest trait either spacing or crowding
Less than 2 mm 2.1 – 5 mm 5.1 to 9 mm 9.1 to 13 mm 13.1 to 17 mm >17 mm or impacted teeth
Upper arch spacing Up to 2 mm 2.1 – 5 mm 5.1 to 9 mm >9 mm
Crossbite Transverse relationship
of cusp to cusp or worseNo crossbite Crossbite present
Incisor overbite Lower incisor coverage Up to 1/3 tooth 1/3 – 2/3 coverage 2/3 up to full
coverage Full coverage Sagittal relationship
of the buccal segment
Left and right added
together Cusp to embrasure relationship only, Class I, II or III
Any cusp relation up to but not including cusp to cusp
Cusp to cusp
relationship
the grading process. Although these indices are widely used, they are not validated for determining treatment need and do not take aesthetics into consideration.
The ICON is an index of treatment need, severity of malocclusion, and treatment outcome and as such offers signifi cant advantages over other indices of treatment need ( Daniels and Richmond, 2000 ; Louwerse et al. , 2006 ;
Onyeaso and BeGole, 2007 ). A single set of weightings is used to score four separate facets of orthodontic care. The ICON weightings are based on the opinion of an international panel of 97 orthodontists from nine countries ( Richmond and Daniels, 1998a , b ). The aesthetic component (AC; Brook and Shaw, 1989 ) of the IOTN, crossbite, upper arch crowding or spacing, overbite or open bite, and buccal segment antero-posterior relationship are used to determine treatment need, treatment outcome, complexity, and degree of improvement ( Daniels and Richmond, 2000 ). The ICON shows good overall agreement with the DAI, PAR, and ABO-OGS ( Onyeaso and BeGole, 2007 ). Fox et al. (2002) found
signifi cant correlations between the IOTN and ICON with respect to need and PAR and ICON with respect to outcome.
A review of the literature did not identify any studies that investigated the clinical applicability of the ICON on digital models. Therefore, the aim of this study was to determine the reliability and reproducibility of ICON scores derived from digital study models compared with scores from plaster models of the same patients. This was carried out by comparing the values scored on plaster models with those scored on digital models and comparing the reproducibility of scoring on digital models with that on plaster models.
Material and methods
Sample
Pre- (T 0 ) and post- (T 1 ) treatment dental casts of 30 patients
were randomly selected from the patient archive of the Department of Orthodontics and Oral Biology, Radboud University Nijmegen Medical Centre. Random numbers were
generated by the computer. The study sample met the following inclusion criteria: (1) permanent dentition, (2) apparently normal crown morphology (casts showing gross abnormalities were excluded), and (3) no features that would alter the natural mesiodistal or buccolingual crown diameter, such as restorations, caries, attrition, or fracture. The dental casts represented a spectrum of malocclusion types and severity before treatment. Patients with clefts and other craniofacial deformities were excluded. Five subjects had a Class I molar occlusion at T 0 , 19
were Class II division 1, fi ve Class II division 2, and one Class III. Five dental casts displayed a crossbite or scissor bite and fi ve showed an anterior open bite. Five patients were treated with extractions. The distribution of the Dental Health Component (DHC) grades of the IOTN is shown in Table 1 .
To process digital models, the models were sent to Orthoproof®, Nieuwegein, The Netherlands. The plaster casts were scanned with a Flash CT scanner (Hytec Inc, Los Alamos, Oklahoma, USA). The same plaster casts were returned and used for direct measurements. The corresponding digital models were returned via electronic mail within 48 hours. The fi le size of one set of digital models is approximately 10 Mb.
Measurements
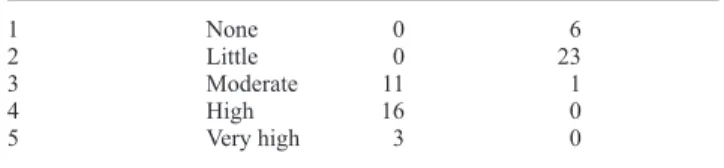
The measurements used were those described in computing the ICON, as shown in Table 2 ( Daniels and Richmond, 2000 ). The components and the scoring range of the ICON are shown in Table 3 . Two observers (SCB and MAB ), Table 1 Distribution of the Dental Health Component (DHC) grades of the Index of Orthodontic Treatment Need (IOTN) of the sample (total n = 60).
IOTN DHC grade Treatment need N pre-treatment N post-treatment
1 None 0 6
2 Little 0 23
3 Moderate 11 1
4 High 16 0
calibrated in the use for the ICON, scored the models. The casts were displayed in a fi xed order on tables. There was no time limit. After 1 week the digital models were scored. The digital models were viewed by using the proprietary software (Digimodel®, version 2.2.1, Nieuwegein, The Netherlands). The digital models were displayed on screen with four views of one set of the dental casts of one patient ( Figure 1 ). A 15.4 inch LCD laptop screen with a resolution of 1280 × 800 pixels with 32 bit colour was used. The observer could manipulate the position of the models in view. For ease and accuracy of measurements, the images were enlarged on screen as required with the magnifying feature. Overbite was assessed by making the maxilla transparent. Posterior displacement from ideal interdigitation was determined with a view perpendicular to the posterior quadrant.
The second scoring of the digital models was carried out 2 weeks after the fi rst scoring and 1 week thereafter the second scoring of the plaster models was undertaken.
Reliability was considered as the extent to which a measurement was repeatable under identical conditions for the new diagnostic test (digital models) and the gold standard (plaster).
Statistical analysis
The various components of the ICON have different scales. Some components result in ordinal data (e.g. crossbite), while other components are recorded on a metric scale. For the metric variables (AC, incisor overbite, and sagittal relationship of the buccal segment, total score, and weighted score), the observer performance is expressed in the reliability index (calculated by Pearson correlation coeffi cient) and the results of a paired t -test ( P value and mean difference). For the ordinal components (upper arch crowding/spacing and crossbite), kappa values were calculated to analyse observer agreement. Statistical analysis was performed with the Statistical Package for Social Sciences version 12 (SPSS Inc., Chicago, Illinois, USA). Statistical signifi cance was set at a P < 0.05.
Results
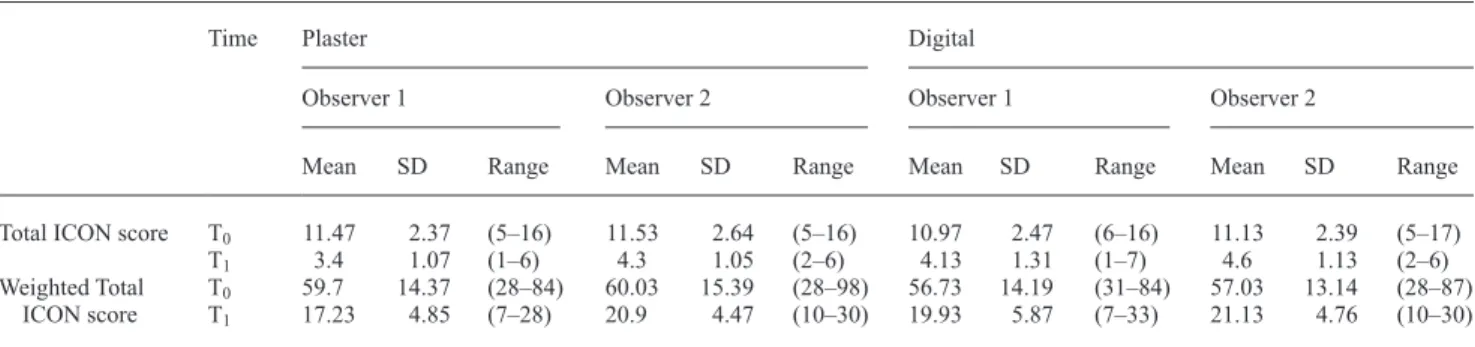
Descriptive analysis of the total and weighted total scores for the samples at T 0 and T 1 are shown in Table 4 and statistical
comparison between digital and plaster models in Table 5 . Table 3 Components of the Index of Complexity, Outcome, and Need (ICON) with their scoring range and weights.
ICON components Scoring range Weight
Aesthetic Component of the Index of Orthodontic Treatment Need
1 – 10 7
Upper arch crowding/spacing 0 – 5 5
Crossbite 0 – 1 5
Incisor overbite 0 – 4 4
Sagittal relationship of the buccal segment
0 – 2 3
Figure 1 Digital model used in the study (Digimodel®).
Differences in total ICON score between the plaster and digital models resulted in mostly statistically insignifi cant values ( P values ranging from 0.07 to 0.19), except for observer 1 in the T 1 sample. Paired t -tests showed that the
total ICON score between plaster and digital models for observer 1 differed, with a plaster score being on average 0.73 points lower than the score on digital models ( P < 0.01). This difference was found for the components, sagittal relationship of the buccal segment ( P < 0.01), and crossbite (kappa = 0).
Signifi cant differences between the digital and plaster models in the weighted ICON scores were found. Observer 1 showed a difference ( P = 0.01) in the T 1 sample. This difference
was also seen in the total ICON score for that sample. Observer 2 showed a difference in the weighted total score for both the T 0 and T 1 sample ( P = 0.03 and P < 0.01, respectively).
Table 5 Index of Complexity, Outcome, and Need (ICON) scores of plaster versus digital models compared for both observers.
ICON component Pre-treatment (T 0 ) Post-treatment (T 1 )
Pearson correlation
coeffi cient
P value Diff Kappa Pearson correlation coeffi cient
P value Diff Kappa
Observer 1 Aesthetic component 0.68 0.29 0.30 0.43 0.13 − 0.17
U-arch crowding/spacing 0.75 1
Crossbite 0.86 0
Incisor overbite 0.99 0.33 0.03 0.70 0.33 − 0.03
Sagittal buccal segment 0.66 0.79 0.03 0.61 <0.01 − 0.63
Total ICON 0.64 0.19 0.5 0.60 0.01 − 0.73
Weighted total ICON 0.62 0.20 3 0.56 0.01 − 2.70
Observer 2 Aesthetic component 0.89 0.01 0.47 0.57 0.06 0.17
U-arch crowding/spacing 0.64 1
Crossbite 0.9 1
Incisor overbite * * * * * * * *
Sagittal buccal segment 0.85 0.66 − 0.03 0.71 <0.01 − 0.47
Total ICON 0.89 0.08 0.4 0.68 0.07 − 0.30
Weighted total ICON 0.89 0.03 3 0.63 <0.01 − 3.67
Diff, mean difference plaster minus digital.
* No values possible due to complete agreement between the values for plaster and digital models.
A difference was found for the components sagittal relationship of the buccal segment ( P < 0.01) and AC ( P = 0.01).
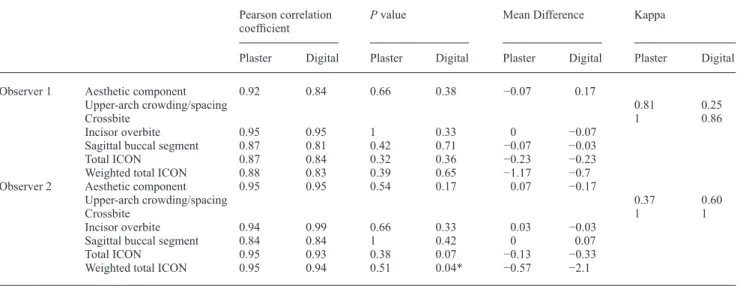
Intraobserver reproducibility for the plaster and digital models are shown in Tables 6 and 7 . The values for reliability of the total and weighted total ICON scores were generally high for the T 0 sample (range 0.83 – 0.95) but lower for the
T 1 sample (range 0.55 – 0.85). No statistical differences were
found for the total ICON score on either plaster or digital models. Intraobserver differences in repeated weighted total ICON scoring of digital models resulted in statistically signifi cant values for observer 2 ( P = 0.04) for the T 0
sample. This difference was mainly due to the AC.
Discussion
The present study assessed the reliability and reproducibility of ICON scores derived from 3D digital study models using plaster models as the gold standard. The number of models to be compared (both for T 0 and T 1 ) had to be large enough to
achieve suffi cient power. For metric variables, the standard
error (SE) in the difference of two variables with approximately the same standard deviation (SD) can be calculated as:
SE= ( / )2 N ×SD. By setting N at 30, the standard error of the mean is close to a factor of 4 smaller than the SD. This implies that differences between observers, or between digital and plaster models, would reach statistical signifi cance at a level of 0.5 SD or more. For those cases where the kappa statistic was used, the power depends both on the expected and the observed level of agreement, so the power calculation is more arbitrary. Setting the expected level of agreement at 0.25 (as can be seen in an equally distributed four-point scale or approximately in a skewed distributed fi ve-point scale), then a level of agreement of 0.75 would result in a kappa of 0.67. Obviously, the same N as for metric variables has to be used. Setting N at 30 with these levels of agreement gives a SE for the kappa value of 0.11. This was considered to be suffi ciently precise.
Two samples were used: 30 pre- (T 0 ) and 30 post- (T 1 )
treatment models. Whereas the T 0 sample contained a variety
of malocclusions, the T 1 sample was more homogeneous.
Table 4 Descriptive statistics for the pre- (T 0 ) and post- (T 1 ) treatment sample. Mean, standard deviation (SD), and (range) are given in
Index of Complexity, Outcome, and Need (ICON) points .
Time Plaster Digital
Observer 1 Observer 2 Observer 1 Observer 2
Mean SD Range Mean SD Range Mean SD Range Mean SD Range
Total ICON score T 0 11.47 2.37 (5 – 16) 11.53 2.64 (5 – 16) 10.97 2.47 (6 – 16) 11.13 2.39 (5 – 17)
T 1 3.4 1.07 (1 – 6) 4.3 1.05 (2 – 6) 4.13 1.31 (1 – 7) 4.6 1.13 (2 – 6)
Weighted Total ICON score
T 0 59.7 14.37 (28 – 84) 60.03 15.39 (28 – 98) 56.73 14.19 (31 – 84) 57.03 13.14 (28 – 87)
Therefore, the pre- and post-treatment samples were analysed separately. Low intrasample variation in the T 1 sample, which
is inherent post-treatment ( Table 4 ), is an important factor for the statistical differences found in total and weighted total score for the comparison between plaster and digital models ( Table 5 ). A much lower interobserver agreement in decisions of treatment acceptability and lower predictive accuracy for treatment outcome for the ICON compared with treatment need have been reported previously ( Richmond and Daniels, 1998b ). The difference for weighted total score (3 points) in the T 0 sample
for observer 2 does not appear to be clinically relevant, the SD in this sample being 15.39 points. The digital models analysed by observer 2 in the T 0 sample ( Table 6 ) had a weighted total
score difference of 2.1, which is very small. The different components of the ICON show low kappa values for the ordinal components. This is because kappa can drop dramatically based
on the prevalence of the variable involved ( Altman, 1991 ). The components, upper arch crowding/spacing and crossbite, show this phenomenon. Stevens et al. (2006) reported diffi culties in observing crossbites. The posterior teeth can falsely appear in crossbite on screen or they will seem to have a positive overjet in the posterior segment when they do not. With the cross-section function of the program, this can be checked.
The AC gave a statistically different value for observer 2 ( Table 5 ). This difference (0.47) is very small and it should be stressed that in the calibrating process, the AC of the ICON proved diffi cult to learn. Indeed, studies assessing the IOTN-AC demonstrated moderate validity ( Richmond et al. , 1995 ; Beglin et al. , 2001 ). When the plaster and digital models were compared in the present study, differences were found for the sagittal relationship of the buccal segment (range 0.47 – 0.63). A slight rotation of the digital model around the vertical Table 6 Intraobserver reproducibility for the pre-treatment models .
Pearson correlation
coeffi cient P value Mean Difference Kappa
Plaster Digital Plaster Digital Plaster Digital Plaster Digital
Observer 1 Aesthetic component 0.92 0.84 0.66 0.38 − 0.07 0.17
Upper-arch crowding/spacing 0.81 0.25
Crossbite 1 0.86
Incisor overbite 0.95 0.95 1 0.33 0 − 0.07
Sagittal buccal segment 0.87 0.81 0.42 0.71 − 0.07 − 0.03
Total ICON 0.87 0.84 0.32 0.36 − 0.23 − 0.23
Weighted total ICON 0.88 0.83 0.39 0.65 − 1.17 − 0.7
Observer 2 Aesthetic component 0.95 0.95 0.54 0.17 0.07 − 0.17
Upper-arch crowding/spacing 0.37 0.60
Crossbite 1 1
Incisor overbite 0.94 0.99 0.66 0.33 0.03 − 0.03
Sagittal buccal segment 0.84 0.84 1 0.42 0 0.07
Total ICON 0.95 0.93 0.38 0.07 − 0.13 − 0.33
Weighted total ICON 0.95 0.94 0.51 0.04* − 0.57 − 2.1
*Signifi cant at P < 0.05.
Table 7 Intraobserver reproducibility for the post-treatment models.
Pearson correlation
coeffi cient P value Difference Kappa
Plaster Digital Plaster Digital Plaster Digital Plaster Digital
Observer 1 Aesthetic component 0.43 0.26 0.54 1 0.07 0
Upper-arch crowding/spacing 1 1
Crossbite 0.78 1
Incisor overbite 0.42 0.80 0.04 0.33 − 0.13 − 0.03
Sagittal buccal segment 0.85 0.81 0.26 0.38 − 0.1 − 0.1
Total ICON 0.79 0.68 0.38 0.46 − 0.13 − 0.13
Weighted total ICON 0.67 0.55 0.81 0.63 − 0.2 − 0.04
Observer 2 Aesthetic component 0.51 0.83 0.42 0.08 0.07 − 0.1
Upper-arch crowding/spacing 0 1
Crossbite 0 1
Incisor overbite — — 0.33 0.33 − 0.03 − 0.03
Sagittal buccal segment 0.90 0.77 0.10 0.29 − 0.13 0.13
Total ICON 0.85 0.75 0.13 1 − 0.17 0
axis affected assessment of molar and canine relationships and this could explain these differences. Other studies ( Mayers et al. , 2005 ; Rheude et al. , 2005 ; Stevens et al. , 2006 ) also found a slightly lower reliability for digital models for buccal occlusion. However, overall, the differences between plaster and digital models do not seem to be clinically important.
In all studies so far undertaken, statistical differences might be found, but they do not seem to be clinically relevant. It is likely that these small differences do not have an infl uence on diagnosis and treatment planning, as confi rmed by the studies of Rheude et al. (2005) and Whetten et al. (2006) who showed that digital models are a valid alternative to conventional plaster models in treatment planning.
Conclusion
Despite some minor differences between ICON scores on plaster and digital models, it can be concluded that ICON scoring can be performed reliably on digital models.
Address for correspondence
Professor A. M. Kuijpers-Jagtman
Department of Orthodontics and Oral Biology Radboud University Nijmegen Medical Centre P.O. Box 9101
NL–6500 HB Nijmegen The Netherlands
E-mail: [email protected]
Acknowledgement
Special thanks to Manon A. Borsje, University Medical Centre Groningen, for her assistance in this research .
References
Altman D G 1991 Practical statistics for medical research . Chapman & Hall , London
Beglin F M , Firestone A R , Vig K W , Beck F M , Kuthy R A , Wade D 2001 A comparison of the reliability and validity of 3 occlusal indexes of orthodontic treatment need . American Journal of Orthodontics and Dentofacial Orthopedics 120 : 240 – 246
Brook P H , Shaw W C 1989 The development of an index of orthodontic treatment priority . European Journal of Orthodontics 11 : 309 – 320 Buchanan I B 1991 The evaluation and initial testing of an index to assess
orthodontic treatment standards: the PAR index . Thesis , University of Manchester
Casko J , Vaden J , Kokich V , Damone J , James R , Cangialosi T 1998 Objective grading system for dental casts and panoramic radiographs . American Journal of Orthodontics and Dentofacial Orthopedics 114 : 589 – 599 Costalos P A , Sarraf K , Cangialosi T J , Efstratiadis S 2005 Evaluation of
the accuracy of digital model analysis for the American Board of Orthodontics objective grading system for dental casts . American Journal of Orthodontics and Dentofacial Orthopedics 128 : 624 – 629 Daniels C , Richmond S 2000 The development of the Index of Complexity,
Outcome and Need (ICON) . Journal of Orthodontics 27 : 149 – 162 Draker H L 1960 Handicapping labio-lingual deviations: a proposed index for
public health purposes . American Journal of Orthodontics 46 : 295 – 315 Fox N A , Daniels C , Gilgrass T 2002 A comparison of the Index of
Complexity Outcome and Need (ICON) with the peer assessment rating
(PAR) and the Index of Orthodontic Treatment Need (IOTN) . British Dental Journal 193 : 225 – 230
Houston W J B 1983 The analysis of errors in orthodontic measurements . American Journal of Orthodontics 83 : 382 – 390
Linder-Aronson S 1974 Orthodontics in the Swedish public dental health system . Transactions of the European Orthodontic Society, pp. 233 – 240 Louwerse T J , Aartman I H A , Kramer G J C , Prahl-Andersen B 2006 The reliability and validity of the Index of Complexity, Outcome and Need for determining treatment need in Dutch orthodontic practice . European Journal of Orthodontics 28 : 58 – 64
Lundström A 1977 Need for treatment in cases of malocclusion . Transactions of the European Orthodontic Society, pp. 111 – 123 Mayers M , Firestone A R , Rashid R , Vig K W L 2005 Comparison of Peer
Assessment Rating (PAR) Index scores of plaster and computer-based digital models . American Journal of Orthodontics and Dentofacial Orthopedics 128 : 431 – 434
Okunami T R , Kusnoto B , BeGole E , Evans C A , Sadowsky C , Shahrbanoo F 2007 Assessing the American Board of Orthodontics Objective Grading System: digital vs plaster dental casts . American Journal of Orthodontics and Dentofacial Orthopedics 131 : 51 – 56
Onyeaso C O , BeGole E 2007 Relationship between Index of Complexity, Outcome and Need, Dental Aesthetic Index, Peer Assessment Rating Index, and American Board of Orthodontics Objective Grading System . American Journal of Orthodontics and Dentofacial Orthopedics 131 : 248 – 252 Quimby M , Vig K , Rashid R , Firestone A , Mayers M 2004 The accuracy
and reliability of measurements made on computer-based digital models . Angle Orthodontist 74 : 298 – 303
Rheude B , Sadowsky P L , Ferriera A , Jacobson A 2005 An evaluation of the use of digital study models in orthodontic diagnosis and treatment planning . Angle Orthodontist 75 : 300 – 304
Richmond S , Daniels C P 1998a International comparisons of professional assessments in orthodontics: part 1 — treatment need . American Journal of Orthodontics and Dentofacial Orthopedics 113 : 180 – 185
Richmond S , Daniels C P 1998b International comparisons of professional assessments in orthodontics: part 2 — treatment outcome . American Journal of Orthodontics and Dentofacial Orthopedics 113 : 324 – 328 Richmond S et al. 1992 The development of the PAR index (Peer
Assessment Rating): reliability and validity . European Journal of Orthodontics 14 : 125 – 139
Richmond S et al. 1995 Calibration of dentists in the use of occlusal indices . Community Dentistry and Oral Epidemiology 23 : 173 – 176 Salzmann J A 1968 Handicapping malocclusion assessment to establish
treatment priority . American Journal or Orthodontics 54 : 749 – 765 Santoro M , Galkin S , Teredesai M , Nicolay O , Cangialosi T 2003 Comparison
of measurements made on digital and plaster models . American Journal of Orthodontics and Dentofacial Orthopedics 124 : 101 – 105
Shaw W C , Richmond S , O’Brien K D , Brook P , Stephens C D 1991 Quality control in orthodontics: indices of treatment need and treatment standards . British Dental Journal 170 : 107 – 112
Stevens R , Flores-Mir C , Nebbe B , Raboud D W , Heo G , Major P W 2006 Validity, reliability, and reproducibility of plaster vs digital study models: comparison of Peer Assessment Rating and Bolton analysis and their constituent measurements . American Journal of Orthodontics and Dentofacial Orthopedics 129 : 794 – 803
Summers C J 1971 The occlusal index: a system for identifying and scoring occlusal disorders . American Journal of Orthodontics 59 : 552 – 567 Tomassetti J , Taloumis L , Denny J , Fisher J 2001 A comparison of 3
computerized Bolton tooth-size analysis with a commonly used method . Angle Orthodontist 71 : 351 – 357
Whetten J L , Williamson P C , Heo G , Varnhagen C , Major P W 2006 Variations in orthodontic treatment planning decisions of Class II patients between virtual 3-dimensional models and traditional plaster study models . American Journal of Orthodontics and Dentofacial Orthopedics 130 : 485 – 491 Zilberman O , Huggare J , Parikakis K 2003 Evaluation of the validity of
tooth size and arch width measurements using conventional and three-dimensional virtual orthodontic models . Angle Orthodontist 73 : 301 – 306