REVIEWS OF INFECTIOUS DISEASES • VOL. 4, SUPPLEMENT • NOVEMBER-DECEMBER 1982
© 1982 by The University of Chicago. All rights reserved. 0162-0886/82/0406-0017$02.00
Comparative Multiple-Dose Pharmacokinetics of Cefotaxime, Moxalactam,
and Ceftazidime
Ruedi Luthy, Jiirg Blaser, Antonio Bonetti, Hanspeter Simmen, Richard Wise, and Walter Siegenthaler
The present study was conducted to compare the pharmacokinetics of three different doses of cefo-taxime, moxalactam, and ceftazidime and to evaluate the influence of probenecid on the phar-macokinetic behavior of these three third-genera-tion cephalosporins.
Patients and Methods
Six male volunteers received in a crossover fashion doses of 0.5, 1.0, and 2.0 g of each drug by infu-sion over a 5-min interval. Doses of 1.0 g were re-peated after administration of probenecid. For each dose, 17 blood samples per volunteer were drawn for documentation of the distribution and elimination phase of the cephalosporin. The uri-nary excretion was determined from five quantita-tive urine collections made over the 24-hr period after administration of the test drug. Serum and urine concentrations were assayed by an agar dif-fusion method. The assay strain for cefotaxime was resistant to its desacetyl metabolite. The average coefficient of variation for interassay precision was 4.6070 ± 0.9070. Serum samples for the 0.5- and 2.0-g doses of cefotaxime and moxa-lactam also were analyzed by a method of high-pressure liquid chromatography (HPLC) that pro-vided information on the behavior of the desacetyl metabolite of cefotaxime and the two naturally oc-curring epimers of moxalactam [1, 2]. The phar-macokinetic parameters of a two-compartment open model were adapted to the experimental data with a nonlinear fitting program. For all statistical This paper is an extended abstract of a paper published in Antimicrobial Agents and Chemotherapy20:567-575, 1981.
Informed consent according to institutional policies was ob-tained from each study participant.
This study was supported in part by grants from Lilly Re-search Laboratories and Glaxo Group ReRe-search, Ltd.
Please address requests for reprints to Dr. R. Luthy, Divi-sion of Infectious Diseases, Department of Medicine, Universi-ty of Zurich, CH-8091 Zurich, Switzerland.
S581
From the Division of Infectious Diseases, Department of Medicine, University of Zurich, Zurich, Switzerland; and the Department of Medical Microbiology, Dudley Road Hospital, Birmingham, England
evaluations the Wilcoxon matched pairs signed rank test was used. Probabilities of 2a~ 0.05 were considered significant.
Results and Discussion
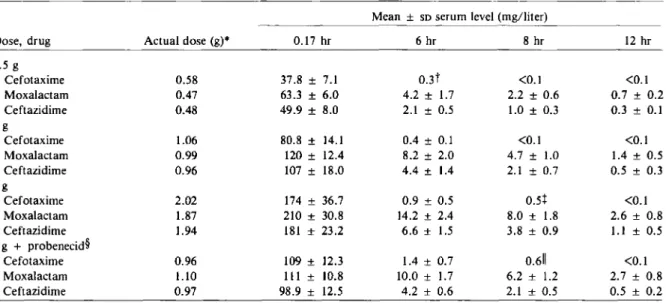
The mean serum concentrations of cefotaxime, moxalactam, and ceftazidime at 10 min and 6, 8, and 12 hr are presented in table 1.Serum concen-trations of moxalactam exceeded those of cef-tazidime at all times and were distinctly higher than those of cefotaxime. At 8 and 12 hr the mean concentrations of cefotaxime were consistently <0.5 mg/liter, whereas those of ceftazidime and moxalactam were rv5-10 times higher. For facilitation of the comparison between the various doses and drugs, the area under the serum concen-tration-vs.-time curve (AVC) was normalized by dividing by the individual dose. Compared with the value for cefotaxime, the normalizedAVCfor moxalactam was three to four times higher and that for ceftazidime, two to three times higher. Probenecid increased the AVC for the 1.0-g dose of cefotaxime about twofold but did not affect those for moxalactam and ceftazidime significant-ly. Linear regression analysis of the dose (x [in g]) vs. normalizedAVC(y [in mg x hr/liter]) yielded a slope for cefotaxime(y
=
13.14x+
45.12) that was significantly different from zero (P< 0.001), a result that indicated a nonlinear increment in AVC for increasing doses. In contrast, slopes for moxalactam(y= -
19.36x+
240.09) and ceftazi-dime (y=
-14.59x+
168.51) did not differ sig-nificantly from zero.The pharmacokinetic parameters of cefotaxime, moxalactam, and ceftazidime are summarized in table 2. Significant differences between the three compounds in the total volume of distribution were observed for the 0.5-g dose but not for the 1.0- and 2.0-g doses. Intraindividual comparisons of the elimination t'h values, total body clearance rate, and renal clearance rate demonstrated
S582 Luthy et al.
Table 1. Mean serum concentrations of drug after infusions over a 5-min interval of cefotaxime, moxalactam, and ceftazidime in six male volunteers.
Mean ± SDserum level (mg/liter)
Dose, drug Actual dose (g)* 0.17 hr 6 hr 8 hr 12 hr
0.5 g Cefotaxime 0.58 37.8 ± 7.1 0.3t <0.1 <0.1 Moxalactam 0.47 63.3 ± 6.0 4.2 ± 1.7 2.2 ± 0.6 0.7 ± 0.2 Ceftazidime 0.48 49.9 ± 8.0 2.1 ± 0.5 1.0 ± 0.3 0.3 ± 0.1 1 g Cefotaxime 1.06 80.8 ± 14.1 0.4 ± 0.1 <0.1 <0.1 Moxalactam 0.99 120 ± 12.4 8.2 ± 2.0 4.7 ± 1.0 1.4 ± 0.5 Ceftazidime 0.96 107 ± 18.0 4.4 ± 1.4 2.1 ± 0.7 0.5 ± 0.3 2g Cefotaxime 2.02 174 ± 36.7 0.9 ± 0.5 0.5+ <0.1 Moxalactam 1.87 210 ± 30.8 14.2 ± 2.4 8.0 ± 1.8 2.6 ± 0.8 Ceftazidime 1.94 181 ± 23.2 6.6 ± 1.5 3.8 ± 0.9 1.1 ± 0.5 1 g+ probenecid'[ Cefotaxime 0.96 109± 12.3 1.4 ± 0.7 0.611 <0.1 Moxalactam 1.10 111± 10.8 10.0 ± 1.7 6.2 ± 1.2 2.7 ± 0.8 Ceftazidime 0.97 98.9 ± 12.5 4.2 ± 0.6 2.1 ± 0.5 0.5 ± 0.2
* Mean value of the doses administered to the six volunteers.
t TheSDfor three volunteers was 0.1; that for the other three was <0.1.
+ TheSDfor three volunteers was 0.4; that for the other three was <0.1.
§Probenecid was administered at a dosage of 0.5 g every 6 hr on the day before testing and 1.0 g at 30 min before administration
of the test drug.
IITheSDfor five volunteers was 0.4; that for the remaining volunteer was <0.1.
significant differences between these antibiotics. The t1;2 values, calculated from the 0.5-, 1.0-, and
2.0-g doses, averaged 2.34, 1.95, and 1.16 hr for moxalactam, ceftazidime, and cefotaxime, respec-tively. The 24-hr urinary recovery was highest for moxalactam (75% ± 4070), followed by ceftazi-dime (68070 ± 11 %) and cefotaxime (53% ± 6%). The total body and renal clearance rates of cefo-taxime decreased significantly with an increase in the dose. In contrast to the findings for moxalac-tam and ceftazidime, the ratio of renal clearance rate to creatinine clearance rate for cefotaxime in-dicated considerable tubular secretion of the drug.
The influence of probenecid on serum concen-tration, t1;2, AUe, volume of distribution, and clearance rate was most obvious with cefotaxime. Saturation of tubular secretion led to serum con-centrations with the 1.0-g dose of cefotaxime that at 2 hr already were higher than those achieved with the 2.0-g dose. The renal clearance rate of this drug decreased by almost 50% and the AUe doubled when probenecid was administered. This finding is in contrast to the findings for moxalac-tam and ceftazidime, where the marginal influence of this agent is of no practical significance.
The level of the desacetyl metabolite of cefotax-ime, determined by HPLe, peaked 45 min after administration. The average levels of the metabo-lite were 2.7 ± 1.0 and 9.8 ± 1.8 mg/liter for the 0.5- and 2.0-g dose, respectively, and the half lives for these doses were approximately twice those of cefotaxime (1.9 ± 0.7 hr and 1.4 ± 0.4 hr, respec-tively). After the 0.5-g dose the AUe for the desacetyl metabolite was 31% ± 12% of the AUe for cefotaxime. For the 2.0-g dose this proportion decreased to 18% ± 2070, a result suggesting that desacetylation may not follow first-order kinetics.
Freshly prepared solutions of moxalactam con-tain two epimers, designated R(-) and S(-), in approximately equal amounts. The serum protein binding of the R(-) epimer averages 53%; that of the S(-) epimer is rv67% [3]. The antimicrobial activity of the former epimer is approximately double that of S(-) [1].
Analysis of the two epimers revealed that their pharmacokinetic behaviors are different. At 10 min after iv administration, the ratio of the R(-) to the S(-) epimer was 0.84; it decreased rapidly to 0.5 at 5 hr-i.e., there was twice as much of the S(-) epimer as of the R(-) epimer. At this time
Table 2. Summary of the pharmacokinetic parameters of cefotaxime, moxalactam, and ceftazidime. Urinary k1 2 k 2\ excretion CIR Clcr Ratio Drug, dose (g) VI (liter/kg) V D (liter/kg) (x 1O-4/hr) (x 1O-4/hr) t Y2 (hr) Cis (mil min) (070) (mllmin) (mllmin) CIR/Clcr Cefotaxime 0.5 0.17 ± 0.04 0.29 ± 0.05 2.30 ± 1.10 3.05 ± 1.12 1.10 ± 0.38 391 ± 97 58 ± 12 217 ± 31 129 ± 18 1.69 ± 0.11 1.0 0.14 ± 0.03 0.24 ± 0.04 2.10 ± 0.72 2.98 ± 0.85 1.08 ± 0.27 326 ± 48 47 ± 7.9 154 ± 38 132 ± 16 1.16 ± 0.22 2.0 0.15 ± 0.02 0.21 ± 0.04 1.00 ± 0.43 2.13 ± 0.73 1.31 ± 0.32 267 ± 49 56 ± 18 145 ± 48 141 ± 18 1.03 ± 0.29 1.0 + probenecid" 0.10 ± 0.01 0.18 ± 0.02 3.40 ± 0.82 3.97 ± 0.55 1.15 ± 0.03 169 ± 16 51 ± 3.6 85 ± 8.8 124 ± 10 0.69 ± 0.10 Moxalactam 0.5 0.09 ± 0.01 0.18 ± 0.01 2.45 ± 0.60 2.63 ± 0.73 2.35 ± 0.32 77.8 ± 9.4 79 ± 4.8 61.7 ± 9.0 135 ± 18 0.46 ± 0.06 1.0 0.10 ± 0.01 0.19 ± 0.01 3.35 ± 1.18 3.47 ± 1.03 2.25 ± 0.21 81.2 ± 10.6 71 ± 7.3 58.0 ± 9.2 140 ± 17 0.41 ± 0.05 2.0 0.12 ± 0.02 0.23 ± 0.03 2.33 ± 0.97 2.48 ± 0.47 2.42 ± 0.13 94.4 ± 15.7 73 ± 5.2 69.4 ± 14.6 141 ± 10 0.49 ± 0.08 1.0 + probenecid" 0.13 ± 0.02 0.24 ± 0.02 2.38 ± 0.67 2.53 ± 0.47 2.79 ± 0.24 83.2 ± 9.6 67 ± 6.9 55.7 ± 11.6 130 ± 16 0.43 ± 0.10 Ceftazidime 0.5 0.14 ± 0.01 0.22 ± 0.02 1.05 ± 0.18 1.97 ± 0.33 2.01 ± 0.16 144 ± 16 66 ± 2.8 75.1 ± 11.6 131 ± 24 0.58 ± 0.09 1.0 0.13 ± 0.02 0.21 ± 0.02 1.48 ± 0.53 2.18 ± 0.33 1.87 ± 0.15 116 ± 18 75 ± 3.3 87.6 ± 16.1 143 ± 24 0.61 ± 0.05 2.0 0.14 ± 0.01 0.25 ± 0.02 1.78 ± 0.65 2.37 ± 0.65 1.96 ± 0.18 133 ± 20 60 ± 9.1 81.1 ± 17.6 121 ± 12 0.67 ± 0.12 1.0 + probenecid" 0.13 ± 0.01 0.21 ± 0.01 1.32 ± 0.20 2.23 ± 0.35 1.97 ± 0.17 114 ± 13 68 ± 4.2 78.6 ± 9.4 133 ± 44 0.64 ± 0.19 NOTE. A two-compartment model was used, and the volume of distribution of the central compartment (VI), the total volume of distribution (V D), the rate constants of transfer between the two compartments (k 1 2 and k2 1 ) , the terminal tY2, the total body clearance rate (Cis), the percentage of the administered dose excreted in urine, the renal clearance rate (ClR), and the creatinine clearance rate (Clcr) were calculated. The values for cefotaxime were derived by fitting the model to the data for the first 6 hr only, where-as those for moxalactam and ceftazidime were derived by fitting the model to all of the data. The data are mean ± SD values for six male volunteers. • Probenecid was administered at a dosage of 0.5 g every 6 hr on the day before testing and 1.0 g at 30 min before administration of the test drug.
S584
the antimicrobial activity, as determined by the agar diffusion assay, was reduced by one-fourth when compared with the concentration measured by HPLC analysis.
No adverse effects were recorded throughout the study. Chemistry profiles, blood cell counts, urinalysis results, and creatinine clearance rates remained within normal limits.
The present study demonstrated that significant differences exist in the pharmacokinetic behavior
of cefotaxime, moxalactam, and ceftazidime.
From this standpoint, it appears reasonable to conclude that moxalactam and possibly
cef-Luthy et01.
tazidime could be administered twice a day and cefotaxime, three or even four times a day.
References
1. Wise, R., Wills, P. J.,Bedford, K. A. Epimers of moxalac-tam: in vitro comparison of activity and stability. An-timicrob. Agents Chemother. 20:30-32, 1981.
2. Wise, R., Wright, N., Wills, P. J. Pharmacology of cefo-taxime and its desacetyl metabolite in renal and hepatic disease. Antimicrob. Agents Chern other. 19:526-531, 1981.
3. Yamada, H., Ichihashi, T., Hirano, K., Kinoshita, H. Plas-ma protein binding and urinary excretion of R (-) and S (-) epimers of an arylmalonylamino l-oxacephem.I. In humans. [letter]. J. Pharm. Sci. 70:112-113, 1981.