ITS CHARACTERISTICS AND PROBLEMS
by
GONZALO MALDONADO LOPEZ LIRA
Ingeniero Civil, Universidad Iberoamericana (1973)
*ubmitted in partial fulfillment of the requirements for the degree of Master of Science in Civil Engineering
at the
M4assachusetts Institute of Technology August 1976
Signature of Author ...
Department of Civil Engineering, August 2, 1976
Certified by...
Thesis Supervisor
Accepted by... Chairman,
ABSTRACT
THE CONSTRUCTION INDUSTRY IN MEXICO ITS CHARACTERISTICS AND PROQLEMS
by
GONZALO MALDONADO LOPEZ LIRA
Submitted to the Department of Civil Engineering on August 2, 1976 in partial fulfillment for the Degree of Master of Science in Civil Engineering.
The construction industry represents one of the principle means of promoting the economic development of nations. The study of the actions that have been carried out to promote the development of this industry, the problems
that have occurred on the execution of these actions, and their consequences on the Mexican economy will facilitate the prediction of results which similar actions might have in other developing countries.
This thesis presents a global view of the construction industry in Mexico by the enalysis of economic data, as well the description of its structure and operations.
Two aspects of the industry are studied in special detail: the performance of labor within the industry and the con-sequences of the managerial actions of the global efficien-cy of this economic sector.
The consequences, that government policies relative to construction have had, are analyzed and actions are pro-posed in order to obtain a more productive operation in
the construction projects.
Thesis Supervisor: Fred Moavenzadeh
Professor of Civil Engineering
I would like to express my gratitude to Professor Fred Moavenzadeh for having accepted to supervise this
thesis and for his advice in its development.
I thank the Consejo Nacional de Ciencia .y Tecnolo-gia of Mexico for their support during my stay at M.I.T.
It could not have been possible for me to complete my graduate studies without the encouragement of my
parents. For this, I am sincerely grateful. I also wish to express my appreciation to my aunts, Misses
Taide and Luz Lopez Lira for their contribution to this thesis.
CONTENTS -
<1-TITLE
PAGE
2
ABSTRACT
ACKNOWLEDGEMENTS
TABLE OF CONTENTSLIST OF GRAPHS AND FIGURES LIST OF TABLES
1. INTRODUCTION
1.1 Scope of the Study 1.2 Objectives
2. THE MEXICAN CONSTRUCTION INDUSTRY 2.1 General Description
2.1.1 Construction market 2.1.2 Methods of operation
2.2 Significance in the National Economy 2.3 Particular characteristics of the Mexican
construction industry
2.3.1 Cycles and seasonal changes 2.3.2 Instability
2.3.3 Rate of Erowth 2.3.4 Profitability
2.3.5 Research and development in this industry 3. CONSTRUCTION INPUTS 3.1 Capital 1 3.2 Materials 13 14 35 52
55
60 65 68 71 75 87 98 107 3.3 Equipment TAELE OF4. MANPOWER IN THE MEXICAN CONSTRUCTION -NDUSTRY 114
4.1 Supply and demand of labor 116
4.1.1 Volume and growth of the demand 117 4.1.2 Availability of unskilled workers 126
4.1.3- Shortage of skilled labor 129
4.1.4 Cost of labor 132
4.1.5 Government policies 139
-4.2 Human aspects 143
4.3 Legislation, Unions and Labor Relations 149
4.3.1 Labor Legislation 149
4.3.2 Construction Unions 152
4.3.3 Labor relations 157
4.4 Low Productivity 160
4.5 Proposals for Solution 167
4.5.1 Training 168
4.5.2 Motivation 171
4.5.3 Organization of labor 171
4.5.4 Technology 173
4.5.5 Planning 173
5. MANAGERIAL ISSUES IN THE MEXICAN CONSTRUCTION INDUSTRY 176 5.1 Goals and policies of the construction firms in 177
Mexico
5.2 Structure of the Construction Firms 181
6
5.4 Managerial systems 188
5.4.1 Estimating and bidding 189
5.4.2 Work planning and scheduling 194 5.4.3 Work monitoring and controling 196 5.4.4 Management Information Systems 198
5.5 Proposals for Solution 199
6. CONCLUSIONS 203
GRAPHS PaE
2.1 Breakdown of Public Investment in 24
Construction according to Type of Construction
2.2 Prediction of Production of the Construction 29 Industry from 196C to 1980 (Current Pesos)
2.3 Prediction of Value Added by the Construction 3C .Industry from 196C to 1980 (196C Pesos)
2.4 Mexico's Gross Domestic Prediction, 1950-74, 38 Billions of 1960 Dollars
2.5 Mexico's Gross Domestic Product, 195C-73, 39 in Millions of Current Dollars
2.6 Mexico's Gross Domestic Product, 195C-73, 40 in Millions of 196C Dollars
2.7 Monthly Construction Index (1972-1975) 57 3.1 Indices for: Labor, Building Costs and Wholesale 82
Prices in Mexico, 1954-70
4.1 Breakdown of Construction Workers according to Age 145 FIGURES
4.1 Intersectional Flow of Unskilled Labor 128 in Mexico
4 .2 Classification of Construction Workers in Mexico 147 5.1 Contteeting Procedures for Public Works -ndi, 195
LIST OF TABLES
2.1 Number of Construction Firms listed
at the National Chamber of the Construction 17 2.2 Breakdown of Construction Firms according 19
to Main activities at the end of 1969
2.3 Value Added by Construction Industry, 1950-74 25
2.4 Investment in Construction, 1950-73 27
2.5 Summary Table of Predictions of Demand 32
2.6 Breakdown of Construction Firms according to 34 Registered Capital
2.7 Mexico's Gross Domestic Product, 1960-74 37
2.8 Volumes and Indices of Mexican GDP and Value 41 Added by Branch of Activity, 195C-1974
2.'9 Gross Fixed Asset Formation in the Construction Industry 43 compared to the National Total, and Value Added by
the Industry Compared to Total GDP and Value Added by the industry as a whole (Expressed in Percent),
in some Latin Amercian Countries
2.10 Value Added: Comparison between Construction and 44 Manufacturing in a Group of Developed Countries,
Developing Countries, and Mexico, (1955-1964)
2.11 Net Fixed Asset Formation (Millions of 196C pesos) 48 2.12 Economically Active Population Employed in 50
Construction, 1950-70
2.13 Period of Employment of the Economically Active 51 Population in Mexico, 1969
2..14 Economically Active Population by Sector in Mexico 53 2.15 Creation of Employment and Productivity of 54
Labor in Construction and Manufacturing, in Developed Countries, Developing Countries and Mexico
2.16 Chronological Distribution of Public Investment, by 58 Administrative Periods
2.18 Projections of the Population in Mexico for the Period 69 1969-1972
2.19 Number of Titles in Careers directly related to the 74 Construction Industry, Registered in the General
Direction of Professions, Secretary of Public Education
3.1 Volumes in the Mexican Construction Industry (1960 prices) 78
3.2 Construction Ratios (1960 prices) 79
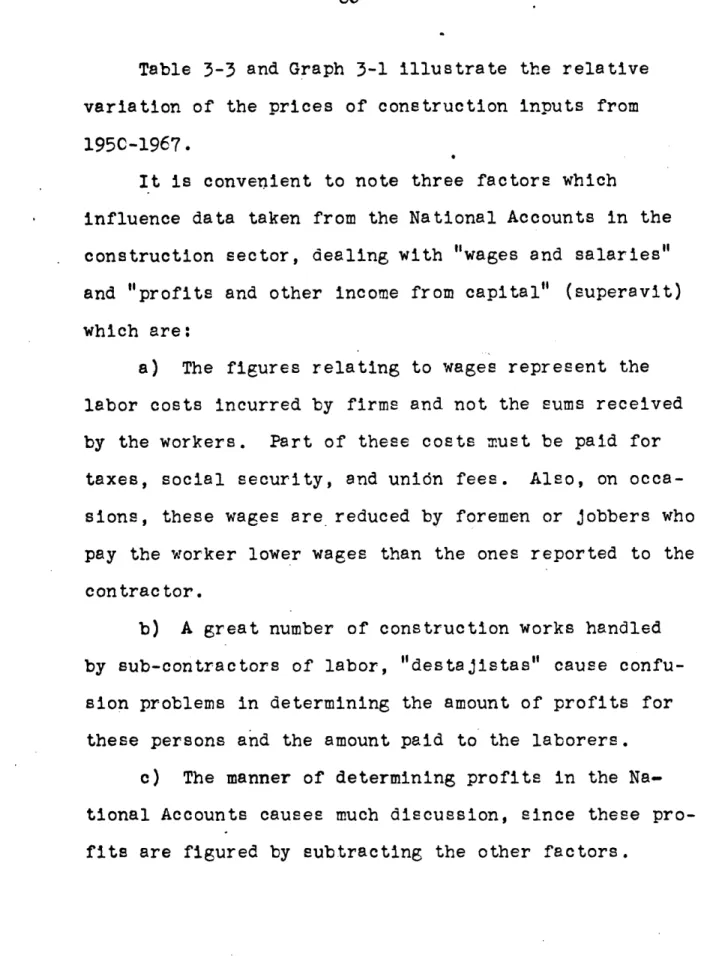
3.3 Price Trends of Inputs of the Construction Industry 81 3.4 Percentages of the Direct Cost represented by Components 84
of the production function in Housing in 1965
3.5 Breakdown of Costs by Type of Construction in 86 Mexicoduring 1973
3.6 Capital Intensity Ratios in Construction and Manufacturing 91 3.7 Materials Used in the Construction of Walls, 1960-197C 99 3.8 Output of Construction Materials, 1969-1974 102 3.9 Annual Production of Cement, Steel and Structural 104
Profiles, in Thousands of Metric Tons, 1950-1974
3.10 Summary Table of Predictions of Demand of Cement and 105 Steel Bars, 195C-198C
3.11 Price Indices of Materials and Labor 108 3.12 Indices of Prices of Materials, 1954-70 109 4.1 Economically Active Population by Sector in Mexico, 1950-7C 118 4.2 Breakdown of Economically Active population by 119
Sector in Percentages for the Years 195C,196C and 197C
4.3 Total Creation of Employment by Ty.pe of Construction 124 and Level of Technology per Million Pesos Invested in
Housing
4.4 Percentages of Direct and Indirect Employment Created 125 by Investment in Housing Construction in Mexico
10'
Pa 4.5 Underutilization of Human Resources in Main Cities 130
of Mexico, in 1969
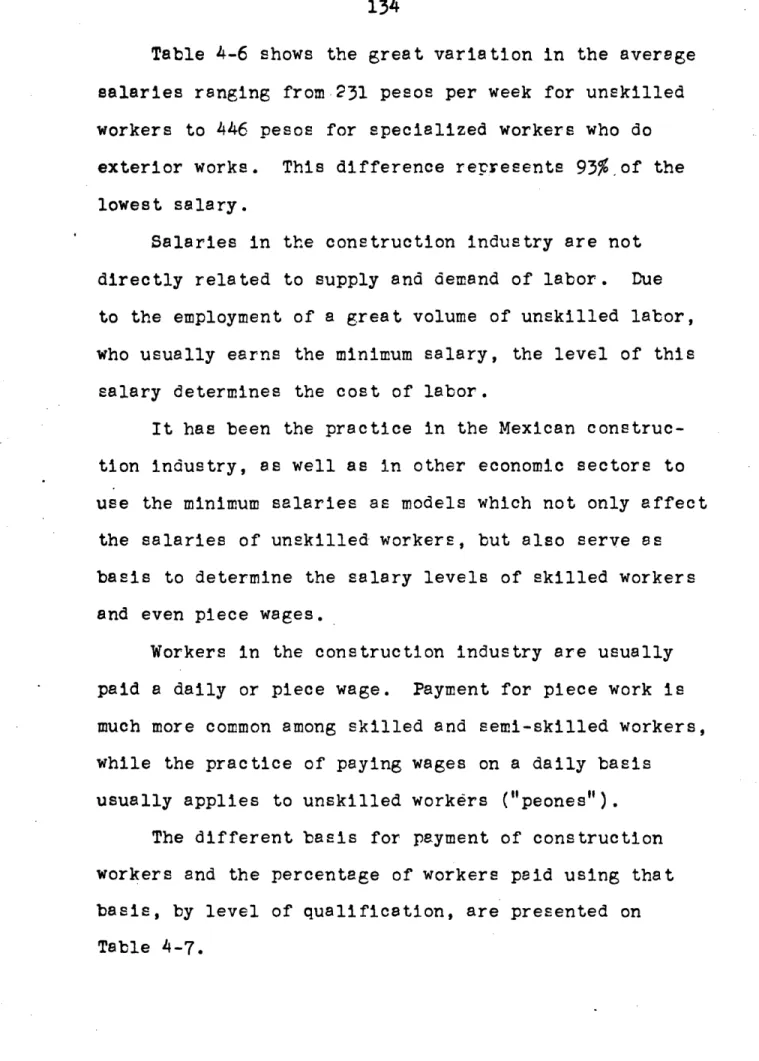
4.6 Average Weekly Income of Construction Workers 133 4.7 Basis for Remuneration of Workers, by. Skill Level 135 4.8 Percentage of the Labor Force Controlled by Unions in 156
Different Cities of Mexico
4.9 Average Salary Paid in the Construction Industry and 163 Ratio of Salaries Paid/Value Added in 196C pesos
CHAPTER 1 INTRODUCTION
The construction industry is an essential factor in the economic development of countries.
The contribution of this sector to the national product and to the creation of capital goods, as well as its participation in employment, are evidences of
its social and economic importance.
The construction industry in Mexico may serve as an example of the situation of industries whose
econ-omies are in a middle stage between that of countries undergoing development and that of those
industrial-ized.
This intermediate situation is particularly char-acterized by the rapid growth of this sector and by
tendencies of substitution of labor for capital.
In developing countries, the construction industry has the function *of incorporating, to the industrial
sector, a great volume of workers who leave the agri-cultural sector because of its low productivity. This study includes data about the manner in which the indus-try performs this duty at present, the tendencies and consequences of the intensive use of labor, as well as ideas about the means of motivating the construction
12
firms to use these techniques, and propositions guided towards the increase in productivity of this input.
The managerial performance within the constructive firms represents one of the fundamental basis for the total efficiency of the industry. The analysis of
these functions allows the identification of deficiencies that the construction industry in Mexico now has, and of actions to be performed for obtaining a better execution of these duties.
1.1 Scope of the Study
This work presents, first, a general panorama of the construction industry, an analysis of its structure and operations, as well as of the construction market, and the influence of this sector on the national econ-omy. (Chapter 2)
In Chapter 3, a special emphasis is placed on the construction inputs by examining its participation in the production function and in the tendencies of labor substitution.
Chapter 4 presents a detailed study of labor in its economic and social inputs, indicating the produc-tivity and characteristics of availability of qualified and unskilled labor.
Another point that requires immediate attention is
the lack of managerial capability in the industry. Chap-ter 5 presents a description of the impact of this de-ficiency in the construction works, as well as a series of recommendations for its solution.Finally, the main issues are summarized; also judgements about the development of the industry and obstacles that must be overcome for better future per formance are formulated. (Chapter 6)
1.2 Ob ectives
The objective of this study is to present a global view of the construction industry in Mexico, as well as to make detailed analyses, and suggest solutions for its two most important problem areas: labor and management.
For this purpose, statistical data indexes, and
economic parameters are given for an objective evaluation of the industry, together with a series of subjective
observations of the manner in which this industry operates. By using a specific case, that of Mexico, this work attempts to present the form in which the construction industry contributes effectively to the social and eco-nomic development of the countries.
CHAPTER 2
THE MEXICAN CONSTRUCTION INDUSTRY
One of the main features to be.considered in the study of the Mexican construction industry is the duality that this economic sector presents in its characteristics; some of them being like those of a developed country industry, at the same time that other characteristics are similar
to those of a country in development. The construction industry looks like that of a developing country in terms of manpower (mainly unskilled), deficit of managerial skills, instability and low productivity; but it looks like that of a fully developed country when its techno-logical achievements, growth, foreign operations, and independency of foreign "know-how" are considered. 2.1 General Description
The construction industry added 53 million pesos to the value of the Mexico's Gross Domestic Product in 1974.
1
At the current exchange rate of C.C8 dollars per peso
this represents 4.24 billion dollars. This figure is 6.53% of Mexico's GDP, which in 1974 amounted to 65 billion
current dollars.
1
The exchange rate of C.C8 dollars/peso or 12.5C pesos/ dollar has not changed since 1951.
2
The construction industry in Mexico, as in many countries, is an outstanding generator of employment, having employed during 1970 about 800,000 persons
representing the largest single industry in the country 1
in terms of manpower. This population corresponded to 4.8 percent of the Economically Active Population in Mexico, and to 22.1 percent of the number of persons
employed in the industrial sector.
In order to attain an objective view of the level of development of the country in general and of the construction industry in particular, the following
2
economic indicators must be considered:
1) Gross National Product per capita amounted to 660 U.S. dollars during 1970. This denotes that Mexico now occupies an intermediate place between the indus-trialized countries and those in the developing stage. Ih 1974, this index went up to 1090 U.S. dollars at current prices. It is necessary to point out that a great part of the increase was due to inflation.
2) Value Added per Capita by the construction industry amounted. to.:34 U-S. dollrs,. which-.orresponds
Source: Proyecciones Demograficas de la Republics Mexicana. SIC (Ref. 15).
2
1970 data has been taken as basis of the indicators because in that year, the latest population census
16
to 5.1 percent of GDP per capita of the country during the said year.
Considering that in Mexico the ratio of the Gross Fixed Capital Formation in Construction to the Value Added by that activity during the last decade has been of about 1.9, it can be estimated that the 3) Per Capita Capital Formation in construction amounted to 64.35 U.S. Dollars at the end of that year.
Since the number of persons employed in construction was 804,C00 in 1970, the 4) Value Added Per Person
employed in construction was ",130 U.S. Dollars. This index manifests the low productivity of labor in the construction industry.
The 5) Ratio of Value Added by Construction to Value Added by Manufacturing was 19.5 percent in 1970 and
increased to 21.5 percent in 1974.
Finally 6) the Number of Persons Employed in
Construction per Thousand Population was 15.85 in 1970. This index emphasizes the importance of this industry as a source of employment.
The construction firms in Mexico follow the same pattern as those in the U.S.: They are small, under-capitalized, have small staffs and are mostly single proprietorships or corporations (sociedades annimas ).
The "sociedad an6nima"(anonimus society)is regulated by
the Mexican Mercantile Legislation and formed by a minimum of 5 persons each one contributing with at least 5,00C pesos.
The number of construction firms entitled to perform public works in 1973, consisted of 4650 with a total
1
social capital amountinS to 5,200 million pesos (416 million dollars). As shown in Tablt 2-1 the number of construction firms has grown at a very rapid pace:
Table 2-1; Number of Construction Firms listed at the CNIC Year 1939 1955 1960 1965 1969 1972 1973 No. of
construc-tion firms registered
in the CNIC 90 627 e88 1843 3130 4C27 k650 Average growth.
per year 34 52 155 322 299 623
Index 14 ice 142 294 499 642 742
Source: CNIC (National Chamber of the Construction Industry) Records.
Construction firms must fulfill these requirements in order to carry out government contracts: (a) they must be registered as public contractors in the Ministry
2 of National Resources (Secretaria del Patrimonio Nacional ) and (b) they must be members of the National Chamber of the Construction Industry.
This Chamber estimates that 75 to FC percent of
the Mexican construction firms are included in its member-ship. Nevertheless, not all the members of this chamber can be considered as contractors since the chamber includes
1
Registered Stockholder's Equity (Capital Stock) Source: CNIC Records.
2
Ley de Inspeccion de Contratos y Obras Publicas. Refs. 21 and 39.
18
also a small number of firms that perform services to the construction industry, such as design, consultancy and suppliers like manufacturers of construction equipment.
In relation to the level of specialization of the Mexican construction firms, the data of breakdown of enterprises by principal field of activity indicate that
the construction sector has an intermediate level of specialization in Mexico (see Table 2-2).
Even though it is not necessary for a contractor involved only in private construction to be a member of the CNIC, the great majority of them prefer to do it in order to take advantage of the services that it offers in form of information and advice to its associates. Some of the sectors of the industry not covered by this chamber are: a) Work performed by the owners, which in some in-dustries that have maintenance and repair staffs can be of significant size; b) work executed at a subindustrial level. The latter includes work performed by jobbers (maestros) or workers that are contracted directly by the owner on a daily or weekly basis, and c) the subsistence sector and non-monetary operations.
The total investment in construction during 1973 in Mexico was estimated by the CNIC at 56.6 billion pesos (2.88 billion dollars), 87% (49.2 billion pesos)
STABLE
2-2 - Breakdown of Construction Firms to Main Activities at the end of 1969.Main Activity Number of F 1. Building Construction 474 2. Hydraulic Engineering. 768 3. Electric Engineering 238 4. Road Construction " 960 5. Design 434 6. Consultancy 164 7, General Construction 1708 1 4746 according irm,
Source: CNIC Records.
1. The sum of these figures is larger than the number of firms registered (313C) because several firms reported more than one principal field of activity.
20
1 of it executed by contractors and the rest by owners.
In the last figure, the value of the work performed out of the industry is not considered due to the fact
that there are no records of this kind of operations. In relation to the geoEraphical distribution of the construction companies, and the percentage that their registered capital represent, the construction industry could be classified as very centralized. More than 5C% of CNIC members have their official residence in the Federal District, and these firms account for more than
PC% of the total registered capital. Monterrey, Nuevo Leon and Guadalajara, Jalisco, the third and second cities in population in Mexico, respectively,,.have thei
-next largest number of CNIC member firms.
This geographic concentration is not exclusive of the construction industry, since it characterizes most of the industrial operations that, with the exception of the extractive industries, have the tendency to be estab-lished near the consumption centers. The principal
reason for the concentration of the construction industry is the structure of the Mexican government, since it centralizes most of the contracting procedures within the
federal government agencies, which are located in Mexico City.
1
Source: National Construction Industry Chamber and
Banco Nacional de Mexico Estimates (Ref. 35). Note: These figures include both value added (internal product) and intermediate consumrtion.
construction may be analyzed by describing its elements, how its demand is integrated, how this demand is met by the supply of goods and services produced by the construc-tion industry as well as the volume of output it has shown recently.
The participating elements in the construction market may be grouped as follows:
a) Financial sources
b) Construction industry supply c) Need for construction (demand)
The financial sources are constituted by: a) the domestic private sector which include banking and private enterprises, and b) foreign agencies, integrated by banks, governments, and international credit organizations, such as The Interamerican Development Bank, The World Bank; and c) the public sector made up of government agencies.
The construction industry proper includes enter-prises which provide equipment and materials, enterenter-prises which offer services to the industry itself, domestic and foreign contractors, and the labor force.
The demand for construction comes from two sources: the public sector which is the principal investor in
construction and the private sector that includes housing, commercI&al, and industrial building.
22
Although there are Mexican companies that are involved in works in foreign countries, the total volume of these operations is not yet large enough as to be compared with the national demand for construction.
The Investment in construction in Mexico has been studied in several instances in order to try to meet
future demands through planning the growth of its produc-tive capacity. In-one of these studies by the Institute
1
of Engineering, Public Investment in construction has been classified according to the following fields:
Brid6es Railroads Airports
Major Irri6ation Projects Minor Irrigation Projects
Dams
Gas Lines and oil lines Electric installations
Learning and investigation Centers
Dwellings-Urban and rural Public Utilities Centers Ocean and Shore Works
1
La demanda y la Planeaci6n de la Industria de la Construcci6n. Mexico, Instituto de Ingenieria.
The relative importance of each one of these types of construction may be identified in graph (2-1). It can be seen that the percentage of investment in the different sectors varies each time the presidential regime changes. The only expenditure area which seems to be relatively constant is the construction of roads.
1
Other sources indicate that construction of social welfare works constituted 25 percent (32 billion pesos) of the federal public investment during the period 1964 to 197-0. Of this, two billion pesos were devoted to low-income housing.
In turn, infrastructure and transportation works represented an investment of 29 billion pesos. It is estimated that housing constitutes 31 percent of the total output of the construction sector; the remaining 69 per cent devoted to civil engineering and other
2 building works.
The volume of construction has increased considerably during the last few years. This is clearly noticeable in the volume of annual gross production during the period of 1950 to 1973 at current values and at 1960 values
(see Table 2-3).
1
Secretaria de la Presidencia. Inversi6n Publica Federal 1965-1970. Mexico 1970.
2
Banco de Mexico, Cuentas Nacionales y Acervos de Capital, 1965.
GRAPH 2-1
BREAKDOWN OF PUBLIC INVESTi;NT IN CONSTRUCTION ACCORDING TO TYPE OF CONSTRUCTION.
Roads
Bridges Railroada Airports
Large Irrigation Projects Small Irriation Projects Ges & Oil Lines
Refineries
Electric Installations
Learning & InvestigEtion Centers Hospitals & Health Centers
8000
6000
55
SOURCE : Nacional Financieru and Ref. 20
2-11
Dwellings
Urban Facilities & Public Buildines Ocean & Shore viorks
4000
20C00
0
25
TABLE
2-3
Value Added by 'Construction Industry in: Millions of current .pesos 1 026 2 377
6 105
10. 055
12 758 15 257 16 102 19 022 211 401 21 507 27 308 36 264 53 043 Millions of current dollars82
190
488 804 1 0211 257
1 288 1 522 1 712 1 720 2 184 2 901 4 2-42 Millions of 1960 pesos 2 998 3 9516 105
8 481 9 762 11 032 11 844 12 961 13 583 13 25015 558
18 01618
(28
MillIons of 1960 dollars 240 316488
678
781883
948
1 037 1 0871
058
1 245 1 441 1 490 Total Index 1739
100 165 209 250 264 312351
352
447594
869
Price Volume tnnual Index Index Growth
in Vol. 34 49
6.5
60 65 10.8 100 100 7.8 119 13915.0
131 160 13.1 138 181 7.2 136 194 9.4 147 212 4.7 158 222 -1,3 162 217 19.4 175 259 13.9 201 295 3.4 285 305SOURCE: Informe Anuall. Year
195C
1955
1960
1965
1966
1967
1968 1969 19701971
1972 19731974
Banco de Mexico. 197426
According to studies made by the "Banco Nacional de
1
Mexico," the average annual volume production of the construction sector increased 6.3% per year between the years 1950 and 1960; in the next decade the increase represented an annual 8.9 percent. These values are larger than the indexes of growth of the Mexican GDP.
The demand of the construction industry which
corresponds to public and private investment during the last 25 years, is presented on Table 2-4.
Ptblic investment has a relatively greater influence in the construction demand in Mexico than it has in the United States. In Mexico, the demand for public invest-ment has been between 2/3 and 3/4 of the total demand, while in the United States, it has been less than 1/2 of it. This investment has particular importance in the growth of construction because it benefits all large
groups into which construction activities can be divided. This is in contrast to private demand which is only
concerned with residential, industrial, and commercial construction.
Demand follows an overall upward trend, though it reflects the fluctuations to which public works are subject, namely: they slow down at the beginning of each term of governments and gain momentum towards the end. These up and downs are responsible for unsatis-factory utilization of technology, machinery, labor,
Review of the Economic Situation in Mexico. Banco Nacional de Mexico. (Ref. 32).
27._
TABLE 2-4
INVESTMENT IN CONSTRUCTION, 1950-1973 (Millions of current pesos)
Year Public Private Total
1950
1 845
764.
2 609
1951
2 027
1 076
3 103
1952
2 773
1 310
4 083
1953 2 0C8 1 270 3 278 1954 2 879 1 459 4 3381955
3 170
1 634
4 804
1956 3 024 2 096 5 1201957
3.'690
2 558
6 248
1958 4 131 2 752 6 883 1959 4 129 3 012 7 141 1960 5 993 3 458 9 451 1961 8 094 3 321 11 415 1962 8 217 4 225 12 442 1963 10 796 3 446 14 242 1964 12 534 4 064 16 598 1965 10 155 4 647 14 8C21966
10 56"'
5 738
16 305
1967
13 563
6 604
20 167
1969
18 216
6 957
25 173
1970 21 715 . 8 163 29 878 1971 19 373 8 843 28 216 1972 " 24 181 10 180 34 361 1973 31 203 11 487 42 690SOURCE: Based on data of the Engineering Faculty of UNAM -Demanda y la Planeaci6n de la Industria de la Construcci6n M•6xico." Milions of U.S. Dls. 209 248
327
262
347
384
410500
.551
571 756 913 995 1 139-1
328
1 18 1 304 1 613 2 014 2 390 2 257 2 749 3 415 "La en28
and raw materials. At certain times, there is idle ca-pacity, while at others, it is insufficient.
In order to determine the best capacity of the con-struction industry, variouis econometric models of its behavior have been developed in Mexico. These models, which deal with the national demand, use as basis sta-tistical data (even though these may not be 1CO% reliable in all cases) and utilize programming methods to deter-mine future volumes of demand.
One of these models, obtained by using the Econo-metric Model of Wharton of the University of Pennsyl-vania, compiles data from 1960 to 1973, and, with a time projection until 1980, gives a prediction of the Mexican construction demand. This is shown in graphs 2-2 and 2-3 both at current pesos and at 196C pesos.
Another effort to predict the volume of demand of construction was developed by the "Instituto de
Inge-1
nieria de la Universidad Nacional Aut6noma de Mexico" (Institute of Engineering of the University of Mexico). This consisted of the development of an econometric Model of production for the construction industry in Mexico. The demand was expressed as a function of the Gross Internal Product (GDP) and the public investment in construction. In this study future consumptions of
1
"Modelo Econom trico para predecir la demands de la Construzncc6n en Mexico"- Leonel Corona T. - Instituto de Ingenieria UNAM 197C
"La Demands y la Planeaci6n de la Industria de la
Conetrucci6n en Mexico"-Jorge I. Bustamente y Reynaldo Escobar - Facultad de Ingenieria UNAM.
GRAPH 2-2
2-16
PREDICTION OF PRODUCTION OF THE CONSTRUCTIONINDUSTRY FROM 1960 TO 1980. (CURRENT PESOS)
150 .36
119.56
-TE
GROWTH
N1960
65
7C
75
YEARSSOURCE: CNIC. (Ref. 7)
150
B
I L L I 0 N 0CC;50
2-17
/ 30 ...
GRAPH 2-3
PREDICTION OF VALUE ADDED BY THE CONSTRUCTION
INDUSTRY FROM 1960 TO 1980C. (1960 PRICES)
30.16
2 CELERATED GROWTH 96 :D GROWs'TH 65 70 7580
YEARSSOURCE: CNIC. (Ref. 7)
B I L L I 0 N P E S 0 s 1960
31
cement and steel bars used in construction were also estimated.
Some equations and corelations of this model are as follows:
dt= - 2913.614+0.0923 X + 0.5904 X
It 2t
where dt is the demand of construction during the year t. X is the gross public investment and is equal to:
It
X =82851.15e 0.06084 t it
X is the government investment and is equal to: 2t
X = -391.235+0.026X + C.1297AX + 1616.308Z
2t it It 2t
Z is an auxiliary variable that is equal to (-I) or (+1) when the year corresponds to the first of last year of the presidential term respectively and it equals 0 the rest of the time.
t time expressed in years.
A clearer idea of the results of this model can be obtained from the summary Table (2-5).
According to comments of entrepreneurs and persons connected with the Mexican construction industry, the results of both, the Wharton Model and the one from the "Instituto de Ingenieria" have been conservative with respect to actual demand.
2,1.2 Methods of Operation. As has been mentioned before, the majority of AMexican construction companies are
32
r
x -. _ _ ----. ----: TABLE 2..5
Construction Demand Increase in the Decade
Year Millions Index in % based Millions Index in % based of pesos on the year of pesos on the decade
(1960 value) 1970 196C 1950 .(1960 value) 190C-70 195C-6C
1950
6 884
12
49
100
-1960 13 938 44 100 -203 7 094 46 1C0
197C
29 486
100
210
430
15 548
100
220
1980
55 93C
19C
426
el2
26 444
170
359
SOURCE:
(Ref. 8)
Registered capital is not an ideal standard for classifying firms according to size. A better criterion would be to use the annual volume of work completed by
the firm. Because there are no reilable data concern-ing the yearly production of the construction firms, registered capital has to be used.
The construction firms usually withhold informa-tion concerning the total work performed, profits, as-sets, etc., since these are directly related to taxes. The construction companies can decide to be taxed on
their income or pay a tax of 3% of the total work per-formed during the year, according to an agreement
between the National Chamber of the Construction Indus-try and the government.
In 1973 there were 4,65C construction companies in the country, 79% of which with capital of less than 20 million pesos (1.6 million dollars) accounting for 78.2 percent of the industry's capital stock. On the other hand, much of the registered capital is concentrated in a small number of firms. The breakdown of Mexican
con-struction firms according to capital is shown on Table
2-6.
It is estimated that, according to the type of construction in which it is involved, an average con-struction company can carry out contracts with a value
2-21
34
TABLE 2-6
Breakdown of Construction Firm According to Registered Capital
1969
Rank by Registered Capital in Million Pesos Number of Firms%
of the
Total Total Reg. Capital byRank
%
of the
Total I A 20-100C 8-20o2-8
1-2
0.5-1
0.5
22
34
255
418 4961 905
0.7
1.1
8.1
13.4
15.8
60.9 Total 3 130 100 3 CC3.4 OC 1973 20 8-20 2-8 Total45
97.
375 4 1334
650
2.1
8.0
88.9
o10Sources:
1.969, Dimitris Germidis. op. cit. 1973, CNIC Records. D725.5
393.7
893.5
468.6
294.11
228.024.2
13.1
29.7
15.6
9.8
7.6
-- ---1-cl-~1--35
of six or even seven times the amount of its capital 1
stock. Therefore, the total capacity of this industry can be computed in the following manner:
Total Capital Stock X Capital Productivity Factor Productivity Capacity.
Then, in 1973 the total capacity of construction was: 5,200 million pesos X 7= 36,400 million pesos.
It is estimated that the working capital of the construction firms is usually about twice its registered capital.
Taking into consideration its capital turnover, it is evident that in the Mexican construction industry, capital is not efficiently used in spite of the diffi-culty in obtaining it. In the following chapters more emphasis will be given to the facts of resource
produc-tivity which are of great importance for a better under-standing of the construction industry in Mexico.
2.2 Significance in the National Economy
2
The contribution of the construction industry GDP (value added) is usually between 2 and 10 percent,
Verbal information by representatives of the "Chmara Nacional de la Industria de la .Construcci6n."
2
This sector of economic activity is classified under division 4 of the International Classificaticn of Economic Activities and corresponds to Division 4 of
the Mexican System of National Accounts under the title: "Construction of Public and Private Works and Installations ."
36
1according to UNIDO (United Nations Industrial Develop-ment Organization). This percentage is in the majority of the developing countries between 3 and 5; in indus-trialized countries, owing to higher' wages and a propor-tionally larger volume works, this figure is usually higher than 5 and may reach up to 9 percent.
In Mexico, value added by the construction industry in 1973 amounted to 5.1 percent of GDP. This corresponds to 14.4 of the value added by industry as a whole, (that amounted to 35.3 percent of GDP that year), whereas
agriculture and services contributed 10.2 and 34.5 percent respectively. The volume and indexes of Mexican GDP is presented on Table 2-7, and Graphs 2-4, 2-5 and 2-6. On
that table, it can be seen that the GDP goes from an
index of 10C in 1960 to one of 249.2 in 1974. If 195C is taken as the reference index 1CO, then the index volume of GDP rose up to 431.3 in 1974. These indexes give a clear idea of the continuous growth of the Mexican economy
during the last 3C years.
On the Table 2-8 the volume and indexes of value added by branch of activity between 1950 and 1974 are presented.
The index of volume of value added by the construc-tion industry rose from 1CO in 1950 to 621.3 in 1974,
UNIDO. Construction Industry.
_____
37
TABLE 2-7
Mexico's Gross Domestic Product
1960 Index =10C Millions of Pesos Year At Current 1960
1960
1961
1962
1963
1964
1965 1966 1967 1968 19691970
1971
1972
1973
1974
Price 511265
030 983 370 c28 090 317 145 900 70o 400 300 600 900 Value Volume Index 100.0 104.9 109.8 118.6 132.5 141.1 150.8 160.3 173.3 184.3 197.1 203.8 218.7 235.3 249.2 Price Index 150 511 100.0 157 931 108.5 165 310 117.C 178 516 130.2 199 390 153.7 212 320 167.4 227 C37 186.1 241 272 203.5 260 901 225.3 277 400 249.1 296 6CC00 278.2 306 800 300.6 329 100 340.4 354 100 411.7 375 100 540.1 Price Index 1CO.0 103.4 106.5 109.8 116.0 118.7 123.4 127.0 130.0 135.1 141.2 147.5 155.7 175.0 216.7 Current Dollars 12 C41 13 061 14 08215
675
18 510 20 162 22 40724
505
27 132 29 992 33 496 36 C32 40 984 49 56865
032
DOURCE: Informe Anual. BEanco de Mexico. 1974.
15C
163 176 195 231 252 280 306 339 374 418 452 512 619 812 19CC Dollars12 041
12 63413 225
14 281 15 95116 986
18 163 19 3C2 20 872 22 19223 728
24 544 26 328' 28 328 30 008GRAPH 2-4
Mexico's Gross Domestic Product.
(195C-1974)
30~1950 55 60 65 70 74
Source: Informe Anual. Panco de Mexico. 1974. M E
X
I C0
2
-P B 2 I L L I-0 N 1 S O F 1 I9
6
0 D 0 L L A R SG CRAPH 2-.5
YEARS
I SOURCE: Informe Anual, Banco de Mexico. 1974.
0 Cý Ce cl-LL -J Ci
GRAPH
2-\2-27
G40
GRAPH 2-6
YEARS
SOURCE: Informe Anual. Panco de MIexico. 1974.
J
N O I) O r--LO C) O -J C-C) ,I-,/
VOLUME AND INDICES OF MEXICAN GDP AND VALUE ADDED BY BRANCH OF ACTIVITY, 1950 TO 1974.
( Millions of 1960 pesos )
Source:: Informe Anual.· Banco de Mexico.74.I
1950 1955 1960 1965 1966 1967 1968 1969 1970 1971 1972 1973 :'1974l %V.A. )SS DOMESTIC PROD. 86 973 114 049 150 511 212 320 227 037 241 272 260 901 277 400 296 600 306 800 329 100 354 100 375 100 100 INDEX 100.0 131.1 173.1 244.1 261.0 277.4 300.0 318.9 341.0 352.8 378.4 407.1 431.3 CONSTRUCTION 2 998 3 951 6 105 8 534 9 762 11 032 11 844 12 961 13 583 13 230 15 558 18 016 18 628 5.1 INDEX 100.0 131.8 203.6 284.7 325.6 368.0 395.1 432.3 453.1 441.3 518.9 600.9 621.3 'RACTIVE IND. 3 943 4 815 7 434 10 444 11 000 12 368 13 454 14 302 15 534 15 982 17 147 17 838 20 660 5.0 INDEX (1) 100.0 122.1 188.5 264.9 279.0 313.7 341.2 362.7 394.0 405.3 434.9 452.4 524.0 MANUFACTURING 16 064 21 423 28 892 44 761 48 990 52 341 57 641 62 287 67 680 69 745 75 524 82 255 86 733 23.2 INDEX 100.0 133.4 179.9 278.6 305.0 325.8 358.8 387.7 421.3 434.2 470.1 512.0 539.9 TA, ,, ,,,, ,, , . . 002 It
83
933
Z;3 Do508
/Z9I~
9248 6
432121410 4 1 2 2 9 3 1
INDEX 100.0 131.4 187.2 283.4 310.7 337.8 371.14 402.1 435.3 446.3 488.0 533.1 569.8 ELECTRICITY 462 845 1 502 2 769 3 157 3 533 4 228 4 812 5 357 5 784 6 297 6 987 7 690 2.0 INDEX 100.0 182.9 325.1 599.4 683.3 764.7 915.2 1041.6 1159.5 1251.9 1363.0 1512.3 1664.5 A G r R V .R.T. 15 442 20 163 23 970 30 2 . INDEX (2) 100.0 130.6 155.2 195.2 199.1 204.5 210.8 213.1 223.6 228.1 229.3 234.3 236.4 SERVICES 48 064 63 052 82 608 115 590 123 388 130 415 141 176 150 126 159 911 166 823 179 169 192 825 204 879 54.5 INDEX (3) 100.0 131.2 171.9 '240.5 256.7 271.3 293.7 312.3 332.7 347.1 372.8 401.2 426.31) Including the recovery and refining of oil and petrochemical products.
2) Including stockbreeding, forestry and fisheries.
3) Including transport and communications, commerce and banks.
* Estimated
%V.A. Per cent of value added, 1973.
42
while the industry a&_a whole rose from 100 to 431.3 in the same period. It is interesting to note that, with the exception of the electrical industry (from index IOC in 1950 to 1664 in 1974) the rate of growth of construc-tion is higher than any other industrial sector and even of services and agriculture. The extractive industries grew from 1CC to 5C4; manufacturing from 1CO to 540, agriculture from 100 to 236.4 and services from 100 to 317 during said period of 24 years.
It is also interesting to compare the development of the construction industry in Mexico with those of other Latin American countries. Table 2-9 includes data relative to these countries. It is important to notice that Mexico is the only country among those listed where value added by construction has a steady increasing role, both in the industry as a whole and in GDP formation; in contrast, the other countries included, present either a downward trend or a leveling of these percentages.
Another reference which compares Mexican construc-tion with that of other countries appears on the following Table (2-10) taken partially from the article "Construc-tion Productivity and Employment in Developing Countries"
1
by Paul Strassman. In this article, the author shows a
series of comparisons between the value added by construction
1
Paul Strassman: "Constructive Productivity and Employ-ment in Develoring Countries." International Labor Review, May 1970, pp. 5C7-509.
TABLE 2-9
Gross Fixed Asset Formation in the Construction Industry Compared with the National Total; And Value Added by the
Industry Compared with Total GDP and Value Added by
Industry As a Whole (Expressed in Per Cent), in Some Latin American Countries. 1960 1961 1962 1963 1964 1965 1966 1967 Mbxico GFAFC/NT 53.1
VAC/GDP
3.7
VAC/TI
12.8
Ar6entina GFAFC/NT 52.1 VAC/GDP 3.4 VAC/TI 10.0 Venozuela GFAFC/NT -VAC/GDP-VAc/TI
-Chile GFAFC/NT -VAC/G DP
-VAC/TI
-Colombia Peru GFAFC/NT 61.6 VAC/GDP 3.3
VAC/TI
13.1
GFAFC/NT 49.1 VAC/GZDP 4.2 VAC/TI -SOURCE: The 55.1 4.1 13.9 41.9 3.8 10.8 64.9 6.112.5
62.1 5.1 12.95C.3
3.0 11.8 48.7 4 .2 14.5*
52.4
3.8 13.1 37.2 3.810.8
62.6 5.2 11.158.4
5.5
13.8 51.1 3.3 12.8 47.7 4.7 16.1 55.0 3.9 13.3 36.9 3.6 9.958.2
4.6 9.960.C
6.1 14.4 53.7 3.3 12.8 44.5 1.7 16.5 55.4 4.2 13.8 41.9 3.4 9.5 61.6 4.0 9.164.7
6.1 14.4 53.22.9
c10.6 40.13.9
13.7 Contruction Industry In 53.3 50.5 4.3 4.0C 14.0 12.8 4•C.8 41.4 3.2 3.0 8.5 7.7 63.1 65.o0 4.1 4.C 9.4 9.3 63.9 63.15.8 5.6
13.5 13.1 50.0 53.2 2.7 2.7 10.6 10.4 43.6 43.0 4.1 4.4 1A.1 14.7 51.7 4.3 13.4 42.1 3.1 8.2 65.7 4.2 9.9 60.I 5.0 11.8 54.0 3.0 11.5 42.0 4.5 14.8 Mtxico: Demetrios 51.6 4.6 14.3 42.4 3.3 8.8 68.7 4.1 9.655.4
4.6 10.9 60.4 3.5 13.1 41.6 4.5 14.7. A. Germidis.* CODE: GFAFC/NT = Gross fixed asset formation in the construction industry compared with the national total of existing assets.
VAC/GDP = Value added by the construction industry compared with the total GDP:
VAC/TI = Value added by the construction industry compared with the total for ali Industry.
44
TABLE 2-10
Value Added: Comparison between Construction and Manufacturing in a group of Developed Contries,
Deve-loping Countries and Mexico. (1955-1964)
Mexi
co AllDeveloping Devel oped CoUntrieL . Countries (Countries Share in GDP: - Construction - Manufacturing Rates Of Increase In Production: 3.9 19.2 6.0
23.8
4.6 7.1 31.6 14.9 - GDP - Construction - Manufacturing SOURCES: -Paul5.9
7.3
6.8
5.2 4.5 7.25.3
3.0 7.2Strassman, Construction Productivity and Emoloyment in DevelopinCg ountries.
(Ref. 41) p. 508.
-Dimitrios Germidis, The Construction Industry in Mexico. (Ref. 13) p. 15.
5.0
5.9
5.9
and by manufacturing industries in a sample of 26 coun-tries divided in two groups: 14 developed countries, including; the United States of America, Canada, Aus-tralia, Norway, Federal Republic of.Germany, United
Kingdom, France, Denmark, Belgium, Netherlands, Austria, Finland, Italy, and Japan, and 12 developing countries, which were: Spain, Jamaica, Mexico, Turkey, Peru, Hon-duras, El Salvador, Egypt, Philippines, South Korea, Niger, and Kenya. These data are complimented with the share of GDP of Mexican Construction and Manufacturing.
It can be seen on the Table (2-10), that in terms of percentages of GDP, Mexico comes closer to developing countries than to developed ones, but considering the growth of GDP and value added by manufacturing and con-struction, it can be better identified with developed countries.
The gross production of the construction sector is composed of the gross internal product of the sector and
the intermediate consumption from other industries. The internal product of the construction industry varied between 3.26% and 4.6% of the GDP; its interme-diate consumption between 7.93% and
9.94%,
and the gross1 production between 5.C0% and 6.49% of the national total.
Source: Cuentas Nacionales y Acervos de Capital Conso-lidados y por Tipo de Actividad Economica, 1951-67, Banco de Mexico, S. A., (Ref. 4).
46
In the same manner, the gross internal product of this sector is made up of wages paid to labor, income from capital, profits of operation, and taxes.
The components of the gross internal product of the construction sector compared to the national totals are: labor wages about 8 percent of the national total; the consumption of fixed capital about C.6 percent; and the profits derived from operation and taxes approximately
2 percent of the national totals.
Taking these facts into consideration, we can infer the production function of the Mexican construction in-dustry. In 1967, the labor force constituted 48.C%; capital 0.6% and indirect costs, taxes and profits of operation 51.4%. It is important to mention that other component of the cost of construction, namely, the con-struction materials, is not considered within the internal product of this sector, for these materials are usually considered intermediate consumption of other industries. This subject will be discussed more fully in the next chapter.
Another important parameter to evaluate the con-struction industry is its total capital stock and its annual increases. The total capital stock of the con-struction industry reflects the capacity of production in form of materials, equipment, and installations.
The increase (or formation) of fixed capital stock by economic activity gives the increase in capacity of production of this sector. It, according
to goods created by sector, gives the contribution that the output of an economic sector has given to the
increase of stock of fixed assets in the country. The next Table (2-11) shows the importance of this industrial sector as a source of fixed assets in the country.
Two items are worthy of notice on this table: (1) how the construction industry has contributed with more
than 50 percent of the total formation of fixed assets. (2) The low percentage that the construction industry has, about 5 percent, of the total stock of fixed assets.
If these two premises are placed together, it is easy to arrive at the same conclusion that Paul Strass-man expressed in "Construction, Productivity and Employ-ment in Developing Countries," which is that: "this
sector seemed able to produce capital almost without using capital."
It is important to note that there is a constant increase on fixed capital in the construction sector even considering the variations that this sector suffers at the beginning of each term of government.
2-35
48
TABLE 2-il1 Year Total Natiorn1950
9 44
1955 13 43 1960 18 Ic 1961 19 05 :1962 18 71 1963 21 81 1964 28 CL 1965 29 01 1966 32 86 1967 37 64NET FIXED ASSET FORMATI (Millions of 196C Pesos Net Fixed Asset Formation
According to Goods Total
Lal Construction % Nati
9
5
241
55.5
232
7 7 438 55.4 296 15 10 807 59.7 379 7 10 670 56.0 398 2 11 227 60.0 477 18 13 115 60.0 439 c8 15 817 56.4 467 .3 15 298 52;7 496 4 17 900 .54.5 528 1i 20 439 54.3 566 SOURCES: a) BANCO DEStock of Fixed Assets
According to Activity onal Construction % 139 866 0.37 183 1 355
c.46
424 2 312 0.61 481 2 274 0.57 193 2 297 0.55 C041 2 39c 0.55 089 2 551 0.55 102 2 754 0.56 966 2 823 0.53 607 2 824 0.50"Cuentas Nacionales y Acervos MEXICO - 1969.
de Capital"
b) Dimitrios A. Germidis, "The Construction Industry in Mexico." op. cit.
The construction industry is also an important source of employment. In Mexico, this sector, as has already been shown, is definitely labor-intensive. For this reason, its importance in the labor context is so fundamental.
In 197C, the Mexican construction industry employed 5% of the economically active population, which repre-sented more than one fifth of the active population
employed by the industrial sector. At present, there are 1 more than one million workers employed in this industry.
The part of the economically active population which work in the construction industry, has increased since 1950 at a steady rate.
This rate seems particularly high if it is compared 2
with that of other industries. The increase during the decade 195C-1960 was 32.8%, while that of 1960-1970 was
33.0%.
This growth has been possible due to the special characteristics of the construction sector, which, in Mexico, as in other countries with a similar economic and
social level, is the beginning of a transitory stage, in the course of which, the rural workers are integrated into the industrial activities.
1
The number of full-time positions is less than the number mentioned above, since many of the laborers work seasonally.
2
2-37
50
TABLE 2-12
ECONOMICALLY ACTIVE POPULATION EMPLOYED IN CONSTRUCTION
(In Thousands of Persons) Industry 1 330 1 689 Construction 226 294 Percentage The Total 2.71
3.
05
of -Percentage of Industries 17.0 18.0 1960 11 332 2 1117 408 3.C 19.0 1965 13 427 3 020 583 4.34 19.1 1970 16 750 3 636 804 4.80 22.1SOURCE: "Proyecciones Demogrificas de la Repdblica Mexicana Direcci6n General de Estadistica, SIC."
Year
1950
1955
Total8 345
9 6142 -- J _ _ --This particular feature has had special importance in Mexico, since this country, as the majority of the Latin American countries, is confronted with a serious problem of unemployment and under-employment. During 1969 4.48% of the population economically active, de-clared having worked three months or less out of the year, and 8.C7% said to have worked 4 to 6 months. If we consider as unemployed half of the percentages men-tioned, we will arrive at a figure of unemployment of 8.51%. With an economically active population of 15 million inhabitants, the number of people unemployed part of the time is approximately 1.3 millions.
According to Table (2-13), it becomes evident that the problem of seasonal employment is more serious in the construction sector than in all other economic sectors.
TABLE 2-13
Period of Employment of the Population Economically Active in Mexico, 1969
(Percentage)
Months Agricultural Construction Other National
Worked Foresting And Activities Total
Fishing Sectors From 1 to 3 4.57 6.24 4.29 4.48 From 4 to 6 10.13 11.41 6.36 8.07 From 6 to 9 8.33 11.43 4.78 6.47
From 10 to 12
76.97
70.92
84.57
80.4960
TOTAL 100 100 100 10052
From the information on Table (2-13), it can be in-ferred that the level of unemployment in the construction sector could be estimated to be about 1CC,CCO individuals for the year 1969.
In order to give a broader idea of the importance of the construction industry in regard to the number of per-sons employed, a breakdown of economically active
popula-tion by sector from 1950 to 1970 is included on Table (2-14). The construction sector in Mexico could well be
considered as belonging to a country in development rather than to an industrialized country if creation of employ-ment and productivity of labor in manufacturing and
con-1 struction are taken as a point of reference.
These considerations are based on data that appear on Table (2-15).
2.3 Particular Characteristics of Mexican Construction In Mexico, as in many other countries, the construc-tion industry has been developing from an occupaconstruc-tion
mainly of handcraftsmen, where experience was more im-potant than technical knowledge, to become one which re-quires specialized training in technical and administra-tive matters,
1
The labor productivity is estimated by dividing the total production of the construction sector by the
53
TABLE 2-14
ECONOMICALLY ACTIVE POPULATION BY SECTOR IN MEXICC
Year Total Active Population (In Thousands Of Extra Manufactur-Active ing Industry Persons) Elec-tricity Construc- Agri-tion culture Services
98
118
142
206
ý23
240
258
278
298
"Proyecc981
1235
15562175
2325
2483
2650
2825
iones25
32
41
63
68
74
81
87
94
Demogro ficas. de la226
4 867
304
5 468
408
6 144
576
6
863
616
7 C07
660
7 152
705
7 297
753
7 442
804
7 587
Repdblics Mexicana; Poblaci6n."Secretaria De Industria .Y Comercio. Direc-cibn General De Estadistica,1966.
(*) ESTIMATED. I·'~~r*~; ~ ~ r c~- c---·--- .
1950
1955
1960
1965
1966
1967
1968
1969
197C
89
13
14 1415
16
16345
713
332
792347
924
523
142
783
SOURCE:2148
2556
3041
3098 4108 43154532
4757
4990-2-41
'54
TABLE 2-15
a)
Employment
As
A
Developin
Proportion Of Economically Countries Active Population Construction Manufacturing b) Rates Of Growth Of Employment Construction Manufacturing
3.9
11.11.3
4.64
Developed MYxico Countries7.2
3.6
13.8
1.8
1.6
6.5
c) Rates Of Growth Of The Average Production Per Worker Construction Manufac turing0.1
5.8
3.3
4.1
0.7
1.0
SOURCE: -Paul Strassman : "Productivity, Construction. And Employment. (Ref. 41) p.508.
55
For some time, it has been the belief since the con-struction industry turned out a different product for each project, it.was impossible to make use of modern planning and control techniques, which would permit the best use of resources. This opinion has given rise to a school which tends to give more importance to
improvi-sation or ability on the part of the contractors to confront any unexpected situation, rather than to develop a syste-matic mentality capable of forecasting and handling the variances that many types of construction present.
This circunstance, plus the mentality that exists in many sectors of the Mexican population of giving solu-tions to present problems and of not considering the
1
future, has caused the construction in Mexico to pre-sent several characteristics of instability that will be discussed later in this chapter.
2.3.1 Cycles and Seascnal Changes. Mexican con-struction suffers two different cyclic variations: one
2 with a periodicity of one year; the other, every six years.
The annual variation is not very noticeable and is caused by three phenomena: (1) the rainy season during the summer in the central region of Mexico, which is where
the majority of construction projects take place; (2) the
This assertion in particular true in
-overnment
policies, which, in the ,1majority of cases, are not studied at long range.
2
The Presidential term in Mexico is a six year period; the president takes office on December ist., of the year *U^ * A n C'I ^^+,nA r V-, 1 0 .1Y. di -r-
07r
i R on- I ^nt~i n vps r-56
period of scarcity of unskilled labor, due to the cul-tivation and harvesting of the principal crops, and (3) the time when the annual investment budgets of the dif-ferent government agencies are approved. In Mexico the climate is rather mild, and with the exception of the northern regions near the U. S. border, where a a pos-sibility of inclement weather, such as hard freezes or snow falls, may slow down outdoor work during the
winter; construction works are not influenced by changes of temperature.
The.. first..cycle tends to increase the investment in construction during January, February, and March and to slow down during the summer months.(see Graph 2-7).
Of much more importance, is the fluctuation which the demand for construction suffers at the beginning and at the end of the presidential terms.
The other cycle begins with a retraction of invest-ment during the first two years of every presidential
term, then it accelerates after the first half of the term and comes to a peak during the 6th year. This vari-ation is illustrated on Table (2-16).
The government, having control of the greatest part of the demand for construction, has used over the years the recourse of increasing or decreasing public invest-ment to accelerate or slow down the course of the eco-nomic cycle. On certain occasions, this has been used to
GRA - 2-7
GRAPH 2-7
CONSTRUCTION .INDEX
(1972-1975)
Index : 1970 Average = 100
Source: Based on Banco de Mexico Data. MONTHLY
150
140
130
120
110
90
58
TABLE (2-16)
CHRONOLOGICAL DISTRIBUTION OF PUBLIC INVESTMENT, BY ADMINISTRATION PERIODS
(in real terms)
1959-1964 Annua 1
%
change
1965-1970
%
Annual%change
1971-1976 ArAu,,_
%
%change
Six-year total First year Second year Third year Fourth year Fifth year Sixth yearSOURCE: Based on Banco de Mexico data.