HAL Id: hal-00305144
https://hal.archives-ouvertes.fr/hal-00305144
Submitted on 5 Mar 2008
HAL is a multi-disciplinary open access
archive for the deposit and dissemination of
sci-entific research documents, whether they are
pub-lished or not. The documents may come from
teaching and research institutions in France or
abroad, or from public or private research centers.
L’archive ouverte pluridisciplinaire HAL, est
destinée au dépôt et à la diffusion de documents
scientifiques de niveau recherche, publiés ou non,
émanant des établissements d’enseignement et de
recherche français ou étrangers, des laboratoires
publics ou privés.
nitrogen wet deposition in Norway
L. R. Hole, H. A. de Wit, W. Aas
To cite this version:
L. R. Hole, H. A. de Wit, W. Aas. Influence of summer and winter climate variability on nitrogen
wet deposition in Norway. Hydrology and Earth System Sciences Discussions, European Geosciences
Union, 2008, 12 (2), pp.405-414. �hal-00305144�
Hydrol. Earth Syst. Sci., 12, 405–414, 2008 www.hydrol-earth-syst-sci.net/12/405/2008/ © Author(s) 2008. This work is licensed under a Creative Commons License.
Hydrology and
Earth System
Sciences
Influence of summer and winter climate variability on nitrogen wet
deposition in Norway
L. R. Hole1,3, H. A. de Wit2, and W. Aas1
1Norwegian Institute for Air Research (NILU), P.O. Box 100, 2027 Kjeller, Norway 2Norwegian Institute for Water Research (NIVA), Gaustadall´een 21, 0349 Oslo, Norway
3Norwegian Meteorological Institute, Forecasting Division for Western Norway, Allegt. 70, 5007 Bergen, Norway
Received: 7 November 2006 – Published in Hydrol. Earth Syst. Sci. Discuss.: 11 September 2007 Revised: / – Accepted: / – Published: 5 March 2008
Abstract. Dominating wind patterns around Norway may
change due to climate warming. This could affect transport of polluted air masses and precipitation. Here, we study rela-tions between reactive nitrogen wet deposition and air mass transport during summer and winter expressed in the form of climate indices, at seven sites in Southern Norway for the period 1980–2005. Atmospheric nitrate concentrations de-creased with 0 to 50% in the period, particularly at sites with little precipitation, and mostly during 1990–2005. For com-parison, reported reductions in emissions of oxidised nitro-gen in Europe in 1989–2003 were 23%. Climate indices ex-plained up to 36% of the variation in winter nitrate deposition at the western and northern sites – and also explained 60% of the variation in winter precipitation (R=0.77). This suggests that the variation in nitrate wet deposition is closely related to variation in precipitation, and that the climate indices seem to also partly control the variation in atmospheric nitrate con-centrations (R=−0.45 at coastal sites). At the coastal sites, local air temperature was highly correlated (R=0.84) with winter nitrate deposition, suggesting that warm, humid win-ter weather results in increased wet nitrate deposition. For ammonia the pattern was similar, but this compound is more influenced by local sources. Expected severe increase in pre-cipitation in western and northern regions as a consequence of climate change suggest that nitrogen deposition in these areas will increase under global warming if emissions are held constant.
1 Introduction
Long-range transported deposition of reactive nitrogen (Nr) has been an issue of concern Europe and North America for a long time. In 1983 the Convention on Long-Range Trans-Correspondence to: L. R. Hole
boundary Air Pollution entered into force, while the Protocol concerning the Control of Nitrogen Oxides or their Trans-boundary Fluxes was signed in 1988. While measures to re-duce S emissions have been quite successful, N emissions have proven more difficult to reduce (http://www.emep.int). Effects of N deposition on terrestrial ecosystems include sur-face water acidification (Stoddard, 1994) and reductions in biodiversity (Bobbink et al., 1998) while forest growth ef-fects are more difficult to substantiate (Tietema et al., 1998; Emmett et al., 1998). Retention of N in many boreal and temperate ecosystems is usually high, which leads to soil N enrichment which in turn may lead to ‘N saturation’ of soils and increased leaching of N to surface waters, leading to wa-ter acidification (Stoddard, 1994). Recent studies indicate that climate change may affect the biogeochemical Nr cycle profoundly. Evidence is accumulating that interactions be-tween N deposition and terrestrial processes are influenced by climate warming (i.e. De Wit et al., 2008).
There are few studies on the linkage between Nr depo-sition and climate variability in Northern Europe. By cou-pling of regional a climate model and the Mesoscale Chemi-cal Transport (CTM) Model MATCH, Langner et al. (2005) showed that changes in the precipitation pattern in Europe have a substantial potential impact on deposition of oxidised nitrogen, with a global warming of 2.6 K reached in 2050– 2070. Air mass trajectories have been shown to be affected by climate warming and this may potentially lead to changes in N deposition. Fowler et al. (2005) were not able to es-tablish a clear connection between Nr wet deposition in the UK and the North Atlantic Oscillation Index (NAOI), sug-gesting that a much more detailed approach with analysis of individual precipitation events and trajectory studies would have to be used in order to establish relationships between Nr deposition trends and climate variation.
In Norway, Hole and Tørseth (2002) reported the total sul-phur and nitrate deposition in five-year periods from 1978– 1982 to 1997–2001 by interpolating national and EMEP
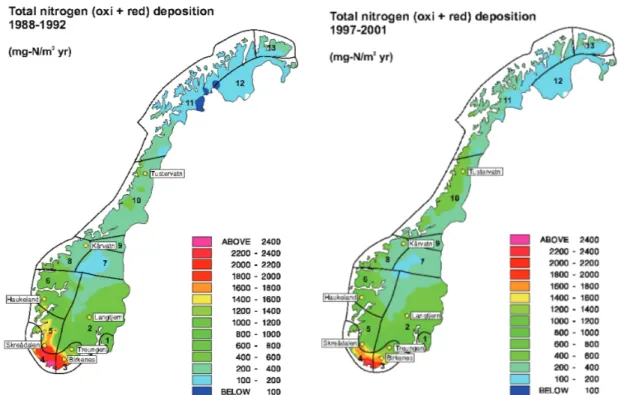
Fig. 1. Total deposition of nitrogen (oxidized + reduced) 1988–1992 (maximum total Nr deposition in the monitoring period) and 1997–2001
(minimum total Nr deposition in the monitoring period) in mainland Norway. The unit is mg N/m2year. From Hole and Tørseth (2002). Precipitation zones from Hanssen-Bauer (2005) are also indicated.
station measurements to the EMEP 50×50 km grid. They found that the total (wet + dry) Nr deposition in the last period had been reduced with 16% compared to the first period although the total precipitation had increased with 10% (Fig. 1). However the decline in deposition since the early 1980s is not steady since EMEP area NOxemissions
reached a peak around 1990 and the period 1988–1992 was the wettest in Norway of the periods studied. Grid cell to-tal deposition for NOx in the last period varied from 0.04
to 1.2 g N m−2yr−1while corresponding numbers for NHy
was 0.06 to 0.9 g N m−2yr−1. The large regional gradients
are partly caused by large variations in annual precipitation, which are about a factor of 10. Southwest Norway has rela-tively high precipitation in addition to being located closest to the main sources of N emissions and has consequently the highest deposition of entire Norway (up to 90% wet deposi-tion). Dry deposition dominates in the north and along the Swedish border.
According to Hanssen-Bauer (2005) mean annual precipi-tation in Norway has increased in 9 of 13 climate regions into which Norway is divided, with a 15–20% increase in north-western regions (between Bergen and Trondheim) in the last century. The same study shows that there is a correlation be-tween the NAOI and winter air temperature in all regions and a correlation between NAOI and winter precipitation in the western regions. However, this correlation varies with time. One explanation may be that the atmospheric circulation over
Norway is not only dependent on NAOI but also the position of the Icelandic low. Consequently, in the present paper, we also investigate the correlation between Nr wet deposition (nitrate and ammonia) and other circulation indices.
The REGCLIM project (http://regclim.met.no) has re-cently published scenarios for the period 2071–2100 and sug-gests that the annual precipitation in Southern Norway can increase 0.2 to 19.6% while the winter precipitation can in-crease with 2.0 to 35.6%. This inin-crease is associated with more westerlies, i.e. higher occurrence of positive NAOI events.
In this paper, we explore relations between climate vari-ability and wet N deposition at 7 locations in south Norway, including a range in annual precipitation and atmospheric Nr deposition. We have tested whether various climate indices are significantly correlated with i) bulk concentrations of Nr in precipitation ii) monthly precipitation iii) Nr deposition during summer and winter. Our main focus is deposition. We have separated summer and winter data in order to test whether there are seasonal differences in the correlations.
L. R. Hole et al.: Influence of summer and winter climate variability 407
2 Data description and methods
2.1 Measurement network
The seven deposition time series used in this study are taken from the national monitoring network of acid deposition, which as of 2005 consisted of 17 stations for monitoring of main compounds in precipitation (Aas et al., 2006). They were selected partly because they are located in different cli-mate zones in S Norway (Hanssen-Bauer, 2005 – Fig. 1) and partly because they are located close to water monitoring stations used in climate effect studies by NIVA. Langtjern is a NIVA-station located close to Gulsvik (January 1980– April 1997) and Brekkebygda (1997–2005) and the data for “Langtjern” is consequently a combination of data from these two stations. It is included here since it represents a very dry, continental, climate region. Otherwise all stations have con-tinuous time series in the period studied (1980–2005), with very few gaps. Birkenes, K˚arvatn, Skre˚adalen and Tuster-vatn are also EMEP-stations. Some station characteristics are listed in Table 1. Treungen and Langtjern did not have complete time series for ammonia concentrations.
2.2 Climate indices
Different climate indices (Fig. 2) have been tested for corre-lation with Nr deposition, precipitation and Nr concentration in precipitation. In addition to the NAOI we have tested for the Arctic Oscillation Index (AOI), the European Blocking Index (EUI), the Scandinavian blocking Index (ScandI) and the East Atlantic Index (EAtlI).
The Arctic oscillation (AO) is the dominant pattern of non-seasonal sea-level pressure (SLP) variations north of 20◦N,
and it is characterized by SLP anomalies of one sign in the Arctic and anomalies of opposite sign centered about 37– 45◦N. The North Atlantic oscillation (NAOI) is a climatic
phenomenon in the North Atlantic Ocean of fluctuations in the difference of sea-level pressure between Iceland and the Azores. It controls the strength and direction of westerly winds and storm tracks across the North Atlantic and is a close relative of the AO (http://www.cpc.noaa.gov).
The European blocking index is based on observations of pentad (5-day average) wind over the region 15◦W to 25◦E
and 35◦N to 55◦N. If the pentad zonal wind equals the
cli-matological value for that time period, the index is zero. If the pentad zonal wind is less than average the index is pos-itive (a blocking high pressure persist over central Europe), while the opposite is true if the index is negative. Similarly, positive ScandI and EatlI are associated with blocking an-ticyclones over Scandinavia and the East Atlantic, respec-tively. Jet stream intensity and orientation at the storm track exit, and in the vicinity of Norway in particular, vary with the phase of these climate patterns (Orsolini and Doblas-Reyes, 2003).
Time series of the climate indices are shown in Fig. 2. The winter of 1990 (which was warm and wet with prevailing westerlies in S Norway) is seen as a strong positive event in NAOI whilst the dry and cold winter of 1996 is seen as a pro-longed negative event. It also appears that the NAOI and AOI behave similarly and they are also correlated, particularly in winter (Rsummer=0.55, Rwinter=0.81).
2.3 Statistical method
Precipitation data from seven monitoring stations are pre-sented here as monthly values in winter (December– February) and summer (June–August). In this way we can see seasonal differences since strong anticyclones in the At-lantic with westerlies are particularly common in winter dur-ing negative NAOI events. Precipitation concentrations were weighted according to precipitation amount. Existence of a monotonic increasing or decreasing trend in the time series 1980–2005 and 1990–2005 was tested with the nonparamet-ric Mann-Kendall test at the 10% significance level as a two-tailed test (Gilbert, 1987). Some of the stations opened in the 1970s, but we choose to test for the same periods at all stations to be able to compare trends. An estimate for the slope of a linear trend was calculated with the nonparametric Sen’s method (Sen, 1968). The Sen’s method is not greatly affected by data outliers, and it can be used when data are missing (Salmi et al., 2002).
It is likely that significant trends in deposition are partly a result of changes in emissions. However, it is not obvi-ous which emission areas contribute to deposition in Nor-way, even though a sector analysis has been carried out for parts of the period studied (Tørseth et al, 2001). The relative contribution could also vary from year to year depending on transport climate. Here, we have tested whether removing significant trends in the data have any influence on the corre-lations we observe.
Source receptor analysis made for Norway (Fig. 6) is not specific for the different sites, but valid for Norway as a whole. In Tørseth et al. (2001), the trends in SO2, SO4and
NO2 at different Norwegian sites were studied. The NO2
trends for all the sites in southern Norway are mostly influ-ence by the emission reduction in the southern sector; but the reductions in east and west are also of significant importance. For the site at Tustervatn there is no big difference between the sectors, eastern sector is slightly more important than the others.
3 Results and discussion
3.1 Observed trends
Significant Sen slopes (10% level) in nitrate and ammo-nia deposition for 1980–2005 and 1990–2005 are shown in Figs. 3–4 and summarized in Tables 2 and 3 and together with significant trends in precipitation and concentration.
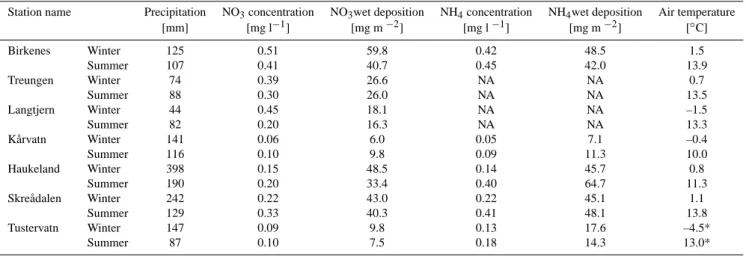
Table 1. Average summer and winter monthly characteristics 1980–2005 of the sites studied. Precipitation is measured at the sites, while air
temperature is taken from the nearest climatological station (provided by met.no). Volume weighted averages.
Station name Precipitation NO3concentration NO3wet deposition NH4concentration NH4wet deposition Air temperature
[mm] [mg l−1] [mg m−2] [mg l−1] [mg m−2] [◦C] Birkenes Winter 125 0.51 59.8 0.42 48.5 1.5 Summer 107 0.41 40.7 0.45 42.0 13.9 Treungen Winter 74 0.39 26.6 NA NA 0.7 Summer 88 0.30 26.0 NA NA 13.5 Langtjern Winter 44 0.45 18.1 NA NA –1.5 Summer 82 0.20 16.3 NA NA 13.3 K˚arvatn Winter 141 0.06 6.0 0.05 7.1 –0.4 Summer 116 0.10 9.8 0.09 11.3 10.0 Haukeland Winter 398 0.15 48.5 0.14 45.7 0.8 Summer 190 0.20 33.4 0.40 64.7 11.3 Skre˚adalen Winter 242 0.22 43.0 0.22 45.1 1.1 Summer 129 0.33 40.3 0.41 48.1 13.8 Tustervatn Winter 147 0.09 9.8 0.13 17.6 –4.5* Summer 87 0.10 7.5 0.18 14.3 13.0*
* Temperatures in nearby Mosjøen.
Fig. 2. North Atlantic Oscillation Index (NAOI), Arctic Oscillation Index (AOI), European Blocing Index (EUI), the Scandinavian Blocking
Index (ScandI) and the East Atlantic Blocking Index (EAtlI), 1980–2005.
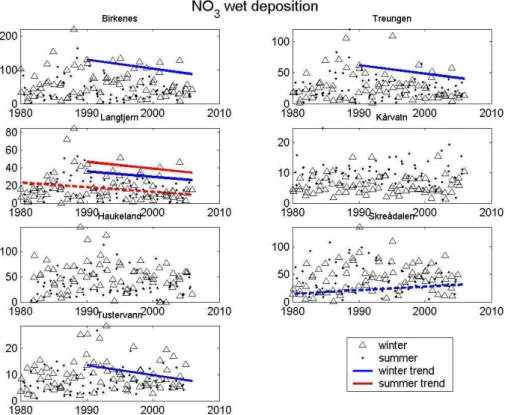
Trends in nitrate concentrations since 1980 corresponds to a reduction of up to 50% at K˚arvatn in summer (Aas et al., 2006) and less at the other stations. For the longest pe-riod, there are negative trends (summer, winter or both) in nitrate wet deposition at five out of seven sites. For the shortest period there are negative trends in nitrate wet de-position at four of seven sites, including the most coastal site
(Haukeland), where there is also a very strong increase in summer precipitation (32 mm/decade). For the longest pe-riod there are few sites with significant trends in nitrate wet deposition and this could be caused by increasing precipi-tation in the period, although the data analysed here show significant increase in precipitation at only three sites. For 1990–2005 decreasing nitrate concentration in precipitation
L. R. Hole et al.: Influence of summer and winter climate variability 409
Fig. 3. Monthly average NO3wet deposition summer and winter (mg/m2). Solid lines are 1990–2005 trends, dashed lines are 1980–2005
trends.
Fig. 4. Monthly average NH4wet deposition summer and winter (mg/m2). Solid lines are 1990–2005 trends, dashed lines are 1980–2005
trends.
Table 2. Significant annual trends in monthly values 1980–2005. See Figs. 3–4.
Station Monthly Precipitation NO3concentration NH4concentration NO3wet deposition NH4wet deposition
name [mm] [mg l−1] [mg l−1] [mg m−2] [mg m−2] Birkenes Winter −0.006 Summer −0.006 −0.01 Treungen Winter NA Summer −0.004 NA Langtjern Winter −0.005 NA Summer 1.3 −0.006 −0.5 NA K˚arvatn Winter 3.0 Summer −0.002 Haukeland Winter −0.003 Summer 3.2 −0.01 Skre˚adalen Winter 0.7 Summer Tustervatn Winter 0.03 3.0 0.6 Summer 0.3
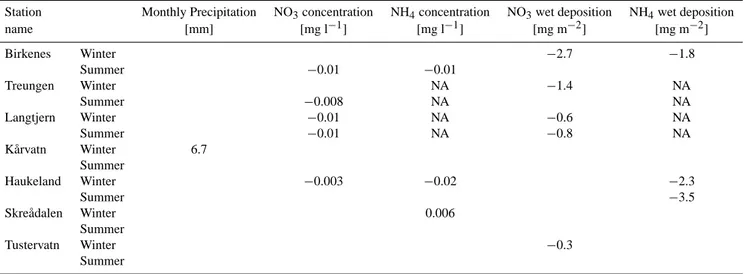
Table 3. Significant annual trends in monthly values 1990–2005. See Figs. 3–4. NA = Not Available.
Station Monthly Precipitation NO3concentration NH4concentration NO3wet deposition NH4wet deposition
name [mm] [mg l−1] [mg l−1] [mg m−2] [mg m−2] Birkenes Winter −2.7 −1.8 Summer −0.01 −0.01 Treungen Winter NA −1.4 NA Summer −0.008 NA NA Langtjern Winter −0.01 NA −0.6 NA Summer −0.01 NA −0.8 NA K˚arvatn Winter 6.7 Summer Haukeland Winter −0.003 −0.02 −2.3 Summer −3.5 Skre˚adalen Winter 0.006 Summer Tustervatn Winter −0.3 Summer
is accompanied by decreasing nitrate wet deposition only at the driest site (Langtjern). The positive trend in ammonia wet deposition at Tustervatn could be caused by changes in local farming activity. We should keep in mind that the 25 year studied here is a very short time to detect climatic trends, since there is much variability on decadal scale (Hanssen-Bauer, 2005).
3.2 Climate indices and connection to concentrations, pre-cipitation and deposition
We considered to remove the trend in N deposition which was caused by trends in N emissions in order to be sure that correlations between climate indices and N deposition were not in fact correlations between climate and N emissions. A
first approximation of detrended N deposition did not show any changes in correlation with climate indices, compared with the original data. From this, we concluded that remov-ing the trend was not necessary for studyremov-ing correlations with climate indices. Additionally, removal of the EMEP emis-sion trends using a simplified source receptor analysis is too crude and uncertain. A detailed sector analysis for the differ-ent sites would be necessary, but that is beyond the scope of this paper.
We first tested correlations between Nr concentrations and climate indices. For most stations there was no correlation. The strongest correlation found was R=−0.45 for nitrate con-centration and NAOI at Haukeland in winter. Nitrate wet de-position at the western sites (Haukeland and Skre˚adalen) are
L. R. Hole et al.: Influence of summer and winter climate variability 411
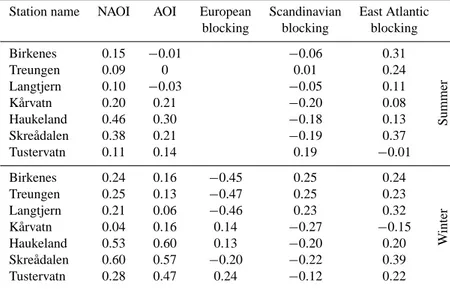
Table 4. Correlation coefficients, R, for nitrate deposition vs. climate indices 1980–2005.
Station name NAOI AOI European Scandinavian East Atlantic blocking blocking blocking
Birkenes 0.15 −0.01 −0.06 0.31 Summer Treungen 0.09 0 0.01 0.24 Langtjern 0.10 −0.03 −0.05 0.11 K˚arvatn 0.20 0.21 −0.20 0.08 Haukeland 0.46 0.30 −0.18 0.13 Skre˚adalen 0.38 0.21 −0.19 0.37 Tustervatn 0.11 0.14 0.19 −0.01 Birkenes 0.24 0.16 −0.45 0.25 0.24 W inter Treungen 0.25 0.13 −0.47 0.25 0.23 Langtjern 0.21 0.06 −0.46 0.23 0.32 K˚arvatn 0.04 0.16 0.14 −0.27 −0.15 Haukeland 0.53 0.60 0.13 −0.20 0.20 Skre˚adalen 0.60 0.57 −0.20 −0.22 0.39 Tustervatn 0.28 0.47 0.24 −0.12 0.22
Table 5. Correlation coefficients, R, for precipitation vs. climate indices 1980–2005.
Station name NAOI AOI European Scandinavian East Atlantic blocking blocking blocking
Birkenes 0.07 −0.18 −0.06 0.33 Summer Treungen 0.04 −0.13 0.07 0.31 Langtjern 0.01 −0.14 0.06 0.28 K˚arvatn 0.40 0.34 −0.50 0.09 Haukeland 0.68 0.47 −0.32 0.23 Skre˚adalen 0.46 0.20 −0.23 0.48 Tustervatn 0.40 0.34 −0.13 0.02 Birkenes 0.40 0.31 −0.52 −0.01 0.36 W inter Treungen 0.35 0.26 −0.52 0.04 0.36 Langtjern 0.20 0.05 −0.48 0.14 0.43 K˚arvatn 0.09 0.19 0.30 −0.57 −0.23 Haukeland 0.70 0.74 0.10 −0.52 0.10 Skre˚adalen 0.77 0.73 −0.18 −0.51 0.29 Tustervatn 0.30 0.53 0.49 −0.52 0.10
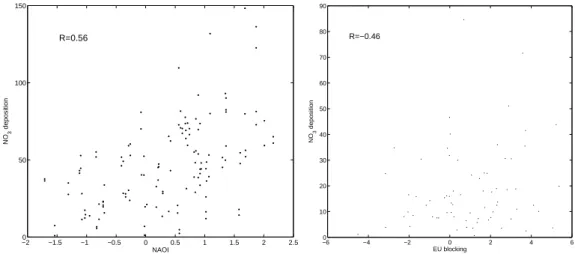
well correlated with NAOI and strongest in winter (R=0.60 at Skre˚adalen) (Table 4). A cluster analysis where the west-ern sites are combined gives R=0.56 for the westwest-ern sites in winter (Fig. 5a), and a much lower correlation (R=0.22) for the southern sites (Birkenes and Treungen). For precipitation the corresponding correlations coefficients are 0.75 and 0.38 respectively. Interestingly AOI has a similar regional correla-tion pattern, but it has a higher correlacorrela-tion at the northern site Tustervatn (R=0.47 in winter). This regional pattern reflexes the correlation with precipitation in Table 5 which again cor-responds well with Hanssen-Bauer (2005). High correlations with NAOI and AOI in winter is not surprising since strong cyclonic systems in the Atlantic leads to high precipitation
at the west coast. Local air temperature is also strongly cor-related with winter nitrate wet deposition at the coastal sites (R=0.84), suggesting that mild, humid winter weather with strong transport from west and south-west (positive NAOI) brings high deposition, mostly as rain, and transport from the UK. For the other sites R<0.2. The European blocking index is strongest (and negatively) correlated with winter deposi-tion at the drier, eastern site, Langtjern, (Table 4, Fig. 5b). This suggests that a certain orientation of the isobars brings in precipitation from the south at these sites. The other block-ing indices do not show very high correlation with nitrate wet deposition. However, ScandI shows high correlation (R=−0.49) with winter precipitation at Skre˚adalen, although www.hydrol-earth-syst-sci.net/12/405/2008/ Hydrol. Earth Syst. Sci., 12, 405–414, 2008
−20 −1.5 −1 −0.5 0 0.5 1 1.5 2 2.5 50 100 150 NAOI NO 3 deposition R=0.56 −60 −4 −2 0 2 4 6 10 20 30 40 50 60 70 80 90 EU blocking NO 3 deposition R=−0.46
Fig. 5. Scatterplot of Nitrate deposition vs. climate indices at coastal sites (a Haukeland and Skre˚adalen) and the eastern site (b Langtjern).
Fig. 6. Budget of NOxdeposition in Norway based on the EMEP
model. NO = Norway; NOS, ATL = North Sea and Atlantic; GB = Great Britain; DD, DE, PL = Germany and Poland; DK, FI, SE = Denmark, Finland and Sweden. BE, NL, FR = Belgium, Nether-lands and France.
much lower than NAOI (R=0.77) and AOI (R=0.73). The pattern for ammonia wet deposition is similar and will not be discussed here.
3.3 Discussion
Reductions in nitrate wet deposition are probably a conse-quence of emission reductions in the EMEP area (EMEP, 2006). There has been a steady decrease in emissions in most of Europe since 1990 and looking at the trend 1980–2004 the decrease has been particularly strong in Eastern Europe. Am-monia emission estimates are highly uncertain since agricul-ture is the main source. Emissions seem to be rather steady in most areas, except in Eastern Europe where reductions have been up to 50% in the 1990s. Sutton et al. (2003) stud-ied trends in reduced nitrogen in different parts of Central Europe and the UK to assess the effectiveness of ammonia abatement. For a range of countries it was shown that
atmo-spheric interactions complicate the expected changes, partic-ularly since sulphur emissions have decreased steadily in the last two decades.
Precipitation is better correlated than deposition with NAOI and AO. This is an indication that deposition is de-pending more on precipitation amount than on transport sec-tor. NAOI seems to also partly control the variation in atmo-spheric nitrate concentrations (R=−0.45 at the coastal sites), i.e. westerly wind brings lower concentrations. It is already established that precipitation amounts, particularly on the west coast, are well correlated with NAOI (Hanssen-Bauer, 2005). On the other hand, it has been shown that transport from continental Europe in south and east is likely to result in higher concentration levels than transport from the Atlantic in west and north (Tørseth et al., 2001). Probably since emis-sions trends for nitrate are relatively weak and continuous (28% reduction from maximum in 1989 to 2003) it was not possible to establish a correlation between emissions in the EMEP area and wet deposition here.
Figure 6 shows the budget of NOxdeposition in Norway
calculated with the EMEP model (EMEP 1992, EMEP, 1997, EMEP, 2003). Note that for the year 2000, the model run was Eulerian, for the other cases it was Lagrangian. The comparison using these two different models create some extra uncertainty in the trends. However the peak in 1990 is obvious, and it is also interesting that the according to the model, deposition in 2000 is much higher that in 1995. However these results are not entirely consistent with Hole and Tørseth (2002) who reported stable total Nr deposition levels comparing 1992–1996 with 1997–2001. In the win-ter of 1990 NAOI was strongly positive and it is inwin-terest- interest-ing to note that the relative contribution from Great Britain (transport from west) was high this year (Fig. 6), however the connection between Fig. 6 and the NAOI (Fig. 1) should be interpreted with care since Fig. 1 shows monthly data. Also, deposition calculations for 2000 is carried out with an
L. R. Hole et al.: Influence of summer and winter climate variability 413
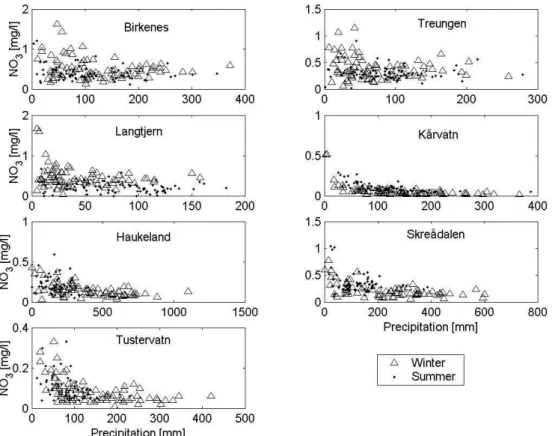
Fig. 7. Monthly average NO3concentration in precipitation (mg/l) vs. monthly precipitation (mm) 1980–2005.
Eulerian version of the EMEP model, while the others are Lagrangian, so the reader should focus on the relative con-tributions for each year. Emission reductions are not evenly distributed in the EMEP countries. Only at the dryest site, Langtjern, a weak correlation was found with the total EMEP annual emissions (Rsummer=0.33 and Rwinter=0.18 in winter).
At Birkenes Rsummer=0.2. This could suggest that variability
in deposition is determined by variability in precipitation and transport pathways rather than emissions and also that Nor-way can be influenced by North American emissions which are not taken into account in Fig. 6.
For nitrate concentration in precipitation (Fig. 7) it is clear that the driest months bring the highest concentrations at all sites. The negative correlation between nitrate wet deposition and precipitation amount is weakest at the driest sites (Treun-gen and Langtjern). In Norway high precipitation events are associated with weather systems with a S component, gener-ally SW wind on the W coast and SE wind in E Norway. We would also expect that these directions with transport from UK and E Europe would give the highest concentrations. Figure 6 suggests a dilution effect in rainy months. Mod-elling results in Hole and Enghardt (2008) also show that the severe increase in precipitation in W Norway expected in the coming decades (in the order of 50%) will indeed result in lower concentrations.
Because 1990 was the warmest (and consequently one of the wettest) year on record in Norway, there are no signif-icant trends in precipitation in 1990–2005 (Table 3) except for a strong increase in winter precipitation at K˚arvatn. How-ever, there are significant reductions in nitrate concentration in precipitation at several stations.
4 Conclusions
We have studied the connection between summer and win-ter climate variability, described by climate indices, and ni-trate and ammonia wet deposition at seven monitoring sites located in different climate zones in Norway in the periods 1980–2005 and 1990–2005.
36% of the variation in winter nitrate wet deposition is de-scribed by the North Atlantic Oscillation Index in coastal sta-tions, while deposition at the inland station Langtjern seems to be more controlled by the European blocking index. The Arctic Oscillation Index gives good correlation at the north-ernmost station in addition to the coastal (western) stations. Local air temperature is highly correlated (R=0.84) with win-ter nitrate deposition at the weswin-tern stations, suggesting that warm, humid winter weather results in high wet deposition. For concentrations the best correlation was found for the coastal station Haukeland in winter (R=−0.45). In addi-tion, there was a tendency in the data that high precipitation
resulted in lower Nr concentrations. Removing trends in the data did not have significant influence on the correlations ob-served. However, a careful sector analysis for each month and for each station could improve the understanding of the separate effects of emission variability and climate variabil-ity on the deposition.
Our results suggest that prediction of future Nr deposition for different climate scenarios most of all need good predic-tions of precipitation amount and precipitation distribution in space and time. Climate indices can be a tool to under-stand this connection. It is also likely that Nr emission re-ductions according to the Gothenburg protocol will not nec-essarily lead to the same relative reduction in Nr deposition due to increasing precipitation. This should motivate for fur-ther emission reductions in Europe.
Acknowledgements. The Software used for trend analysis was kindly provided by A. Grimvall and C. Libiseller, Link¨oping University, Sweden. All climate indices except for EUI were downloaded from NOAA Climate Prediction Center (http://www.cpc.noaa.gov). Y. Orsolini at NILU provided the EUI. The Norwegian Meteorological Institute provided meteorological data (local air temperature). This work was supported by the Norwegian Research Council through project no. 155826. The monitoring network is mainly sponsored by the Norwegian Pollu-tion Control Authority (http://www.sft.no).
Edited by: P. Dillon and R. F. Wright
References
Aas, W., Solberg, S., Berg, T., Manø, S., and Yttri, K. E: Mon-itoring of long range transported pollution in Norway, Atmo-spheric transport, 2005, Norwegian Pollution Control Author-ity, Rapport 955/2006, TA-2180/2006, NILU OR 36/2006, http: //www.nilu.no, 2006 (in Norwegian).
Bobbink, R., Hornung, M., and Roelofs, J. G. M.: The effects of air-borne nitrogen pollutants on species diversity in natural and semi-natural European vegetation, J. Ecol., 86(5), 717–738, 1998.
Delwiche, C. C.: The nitrogen cycle, Sci. Am., 223, 137–146, 1970. de Wit, H., Hindar, A., and Hole, L.: Winter climate affects long-term trends in stream water nitrate in acid-sensitive catchments in southern Norway, Hydrol. Earth. Syst. Sci., 12, this special issue, 2008.
EMEP: Calculated budgets for airborne acidifying components in Europe 1985, 1987, 1988, 1989, 1990 and 1991, edited by: Sandnes, H. and Styve, H. The Norwegian Meteorological In-situte, Oslo, EMEP/MSC-W Report 1/92, 1992.
EMEP: Transboundary Air Pollution in Europe, MSC-W Status Re-port 1997, Part 2; Numerical Addendum, The Norwegian Mete-orological Institute, Oslo, EMEP/MSC-W Report 1/97, 1997. EMEP: Transboundary acidification, eutrophication and ground
level ozone in Europe, Status Report PART III Source-Receptor Analysis, The Norwegian Meteorological Institute, Oslo, EMEP/MSC-W Report 1/2003, 2003.
EMEP: Transboundary acidification, eutrophication and ground level ozone in Europe since 1990 to 2004, EMEP Status Report1/2006 The Norwegian Meteorological Institute, Oslo, EMEP/MSC-W Report 1/97, 1997.
Fowler, D., Smith, R. I., Muller, J. B. A., Hayman, G., and Vincent, K. J.: Changes in the atmospheric deposition of acidifying com-pounds in the UK between 1986 and 2001, Env. Poll., 137(1), 15–25, 2006.
Galloway, J. N., Dentener, F. J., Capone, D. G., Boyer, E. W., Howarth, R. W., Seitzinger, S. P., Asner, G. P., Cleveland, C., Green, P., Holland, E., Karl, D. M., Michaels, A. F., Porter, J. H., Townsend, A., and V¨or¨osmarty, C.: Nitrogen Cycles: Past, Present and Future, Biogeochemistry, 70, 153–226, 2004. Gilbert, R. O.: Statistical methods for environmental pollution
mon-itoring, Van Nostrand Reinhold, New York, 1987.
Hanssen-Bauer, I.: Regional temperature and precipitation series for Norway: Analyses of time-series updated to 2004, Met.no report 15/2005, http://www.met.no, 2005.
Hole, L. R. and Enghardt, M.: Climate change impact on atmo-spheric nitrogen deposition in northwestern Europe: A model study, Ambio, 37, 9–17, 2008.
Hole, L. R. and Tørseth, K.: Deposition of major inorganic com-pounds in Norway 1978–1982 and 1997–2001: status and trends, Naturens t˚alegrenser, Norwegian Pollution Control Authority, Report 115, NILU OR 61/2002, ISBN: 82-425-1410-0, http: //www.nilu.no, 2002.
Langner, J., Bergstr¨om, R., and Foltescu, V.: Impact of climate change on surface ozone and deposition of sulphur and nitrogen in Europe, Atmos. Environ., 39(6), 1129–1141, 2005.
Orsolini, Y. J. and Doblas-Reyes, F. J.: Ozone signatures of climate patterns over the Euro-Atlantic sector in the spring, Q. J. R. Me-teorol. Soc., 129, 3251–3263, 2002.
Sen, P. K.: Estimates of the regression coefficient based on Kendall’s tau, J. Am. Stat. Assoc, 63, 1379–1389, 1968. Salmi, T., M¨a¨att¨a, A., Anttila, P., Ruoho-Airola, T., and Amnell,
T.: Detecting trends of annual values of atmospheric pollutants by the Mann-Kendall test and Sen’s slope estimates – the Excel template application MAKESENS, Publications on Air Quality, no. 31, FMI-AQ-31, FMI, Helsinki, Finland, 2002.
Stoddard, J. L.: Long-Term Changes In Watershed Retention Of Nitrogen – Its Causes And Aquatic Consequences, Adv. Chem. Ser., 237, 223–284, 1994.
Sutton, M. A., Asman, W. A. H., Ellermann, T., van Jaarsveld, J. A., Acker, K., Aneja, V., Duyzer, J., Horvath, L., Paramonov, S., Mi-tosinkova, M., Tang, Y. S., Achtermann, B., Gauger, T., Bartniki, J., Neftel, A., and Erisma, J. W.: Establishing the link between ammonia emission control and measurements of reduced nitro-gen concentrations and deposition, Environ. Monit. Asessm., 82, 149–85, 2003.
Tietema, A., Boxman, A. W., Bredemeier, M., Emmett, B. A., Moldan F., Gundersen P., Schleppi, P., and Wright, R. F.: Ni-trogen saturation experiments (NITREX) in coniferous forest ecosystems in Europe: a summary of results, Environ. Pollut., 102, 433–437, 1998.
Tørseth, K., Aas, W., and Solberg, S.: Trends in airborne sulphur and nitrogen compounds in Norway during 1985–1996 in rela-tion to airmass origin, Water Air Soil. Poll., 130, 1493–1498, 2001.