HAL Id: hal-01963587
https://hal-amu.archives-ouvertes.fr/hal-01963587
Submitted on 21 Dec 2018
HAL is a multi-disciplinary open access
archive for the deposit and dissemination of
sci-entific research documents, whether they are
pub-lished or not. The documents may come from
teaching and research institutions in France or
abroad, or from public or private research centers.
L’archive ouverte pluridisciplinaire HAL, est
destinée au dépôt et à la diffusion de documents
scientifiques de niveau recherche, publiés ou non,
émanant des établissements d’enseignement et de
recherche français ou étrangers, des laboratoires
publics ou privés.
Distributed under a Creative Commons Attribution| 4.0 International License
Entorhinal–Hippocampal Network
Guzel Valeeva, Sona Janackova, Azat Nasretdinov, Veronika Rychkova,
Roman Makarov, Gregory Holmes, Roustem Khazipov, Pierre-Pascal
Lenck-Santini
To cite this version:
Guzel Valeeva, Sona Janackova, Azat Nasretdinov, Veronika Rychkova, Roman Makarov, et al..
Emer-gence of Coordinated Activity in the Developing Entorhinal–Hippocampal Network. Cerebral Cortex,
Oxford University Press (OUP), 2018, pp.1 - 15. �hal-01963587�
doi: 10.1093/cercor/bhy309 Original Article
O R I G I N A L A R T I C L E
Emergence of Coordinated Activity in the Developing
Entorhinal
–Hippocampal Network
Guzel Valeeva
1
, Sona Janackova
2
, Azat Nasretdinov
1
, Veronika Rychkova
1
,
Roman Makarov
1
, Gregory L. Holmes
3
, Roustem Khazipov
1,2
and Pierre-Pascal Lenck-Santini
2,3
1
Laboratory of Neurobiology, Kazan Federal University, Kazan 420008, Russia,
2INMED, Aix-Marseille
University, INSERM, Marseille 13273, France and
3Department of Neurological Sciences, Larner College of
Medicine, University of Vermont, Burlington, VT 305401, USA
Address correspondence to Dr Roustem Khazipov and Pierre-Pascal Lenck-Santini, INMED/INSERM U1249, 134 Avenue de Luminy BP13, Marseille 13273 , France. Email: [email protected]; [email protected]
Guzel Valeeva and Sona Janackova contributed equally to this work
Abstract
Correlated activity in the entorhinal–hippocampal neuronal networks, supported by oscillatory and intermittent population activity patterns is critical for learning and memory. However, when and how correlated activity emerges in these networks during development remains largely unknown. Here, we found that during thefirst postnatal week in non-anaesthetized head-restrained rats, activity in the superficial layers of the medial entorhinal cortex (MEC) and hippocampus was highly correlated, with intermittent population bursts in the MEC followed by early sharp waves (eSPWs) in the hippocampus. Neurons in the superficial MEC layers fired before neurons in the dentate gyrus, CA3 and CA1. eSPW current-source density profiles indicated that perforant/temporoammonic entorhinal inputs and intrinsic hippocampal connections are co-activated during entorhinal–hippocampal activity bursts. Finally, a majority of the entorhinal–hippocampal bursts were triggered by spontaneous myoclonic body movements, characteristic of the neonatal period. Thus, during the neonatal period, activity in the entorhinal cortex (EC) and hippocampus is highly synchronous, with the EC leading hippocampal activation. We propose that such correlated activity is embedded into a large-scale bottom-up circuit that processes somatosensory feedback resulting from neonatal movements, and that it is likely to instruct the development of connections between neocortex and hippocampus.
Key words: entorhinal cortex, hippocampus,in vivo, neonatal, sharp waves
Introduction
The entorhinal cortex (EC) and hippocampus are critically involved in spatial navigation and learning and memory (Buzsaki and Moser 2013;Moser et al. 2015). The EC receives and processes information of various sensory modalities that
are conveyed to the hippocampus via two main bottom-up pathways: the temporoammonic pathway projecting from EC layer 3 (L3) to the distal dendrites of CA1 pyramidal cells in the stratum lacunosum-moleculare (sl-m) and the perforant path that forms a trisynaptic loop from EC layer 2 (L2) to the dentate
© The Author(s) 2018. Published by Oxford University Press.
This is an Open Access article distributed under the terms of the Creative Commons Attribution Non-Commercial License (http://creativecommons.org/ licenses/by-nc/4.0/), which permits non-commercial re-use, distribution, and reproduction in any medium, provided the original work is properly cited. For commercial re-use, please [email protected]
gyrus and CA3, from dentate granule cells to CA3 and from CA3 pyramidal cells to the proximal dendrites of CA1 pyramidal cells in the stratum radiatum (sr). In turn, CA1 pyramidal cells form the main output of the hippocampus, projecting back to the neocortex via synapses on neurons in the deep layers of the EC and in other cortical and subcortical structures. Correlated activity in the EC and hippocampus is comprised of various oscillatory and intermittent network activity patterns. For example, during exploratory behavior, which is dominated by theta oscillations, hippocampal circuits receive rhythmic inputs from neurons in the superficial layers of the EC that enable the organization of neuronalfiring into sequences repre-senting trajectories of the animal through space (Buzsaki and Moser 2013;Moser et al. 2015;Wikenheiser and Redish 2015;
Wang et al. 2016;Fernandez-Ruiz et al. 2017). EC-driven theta oscillations are associated with current sinks in the stratum lacunosum-moleculare. In addition, during theta, neuronal activity in the superficial layers of the EC precedes activity in the hippocampus (Mizuseki et al. 2009;Fernandez-Ruiz et al. 2017). In contrast, during periods of immobility and sleep, cor-related activity between these structures is characterized by hippocampus-generated SPWs, which drive activity from the hippocampus to the EC (Buzsaki 2015). SPWs are generated by a collective discharge in CA2/CA3 networks, conveyed to CA1 and further propagated to the deep layers of the EC and other corti-cal and subcorticorti-cal targets (Chrobak and Buzsaki 1994;Pennartz et al. 2004;Wierzynski et al. 2009;Oliva et al. 2016;Roth et al. 2016). SPWs are characterized by a main current sink insr and associated with replay of neuronal sequences. During SPWs, CA1firing precedes firing in EC. SPWs are regarded as a top-down signal involved in memory transfer from the hippocam-pus to the neocortex where memories are consolidated (Chrobak and Buzsaki 1994;Ylinen et al. 1995;Buzsaki 2015).
Despite extensive knowledge on the interactions within the entorhinal–hippocampal circuits in adult animals, little is known about how these structures communicate during devel-opment. This information is important because early functional interactions between EC and hippocampus are critical for the maturation of entorhinal–hippocampal circuits (Donato et al. 2017). To date, the activity patterns expressed in the developing EC and hippocampusin vivo were mainly explored in these two structures separately. In the neonatal rodent hippocampus, the first (starting from the postnatal day P2) and predominant activity pattern is provided by early sharp waves (eSPWs) (Leinekugel et al. 2002;Karlsson et al. 2006;Mohns et al. 2007;
Mohns and Blumberg 2008; Marguet et al. 2015). Similar to SPWs in adult animals, eSPWs in neonatal rats are recurrent non-periodic events characterized by a prominent negative localfield potential (LFP) deflection and current sink in sr, LFP reversal in the pyramidal cell layer (pcl) and a robust discharge of CA1 pyramidal cells (Leinekugel et al. 2002;Karlsson et al. 2006;Mohns et al. 2007;Buzsaki 2015;Marguet et al. 2015). The current network model of eSPWs is similar to that of the adult SPWs. However, while eSPWs share common properties with adult SPWs, they also display particular developmental fea-tures such as the absence of high frequency ripple oscillations (Leinekugel et al. 2002; Buhl and Buzsaki 2005; Mohns et al. 2007;Marguet et al. 2015) and variable current-source density (CSD) profiles that may indicate a contribution of extrahippo-campal inputs (Mohns et al. 2007;Marguet et al. 2015). Also, eSPWs in neonatal rats are triggered by behavioral startle responses (Karlsson et al. 2006;Marguet et al. 2015), a feature that is not documented in adult animals (Buzsaki 2015).
Population activity in the EC during the neonatal period is also characterized by intermittent activity bursts organized in sharpfield potential events and oscillatory bursts both in vivo and in brain slicesin vitro (P1–7) (Sheroziya et al. 2009;Namiki et al. 2013;Unichenko et al. 2015). In brain slices, these popula-tion bursts are also associated with synchronized calcium waves. These are initiated in the lateral EC and propagate ante-riorly to the frontal cortex and posteante-riorly to the medial EC (MEC), forming traveling waves that engage almost the entire cortex, but stop at perisubiculum and fail to invade the hippo-campus (Namiki et al. 2013;Unichenko et al. 2015). Hippocampal CA3-generated giant depolarizing potentials (GDPs), which are considered as anin vitro counterpart of eSPWs, do not propagate to the EC either (Khalilov et al. 1999).
Thesein vitro findings raise several questions regarding the functional communication between the hippocampus and the EC during the neonatal period. First, anatomical connections from the EC to the hippocampus are already formed during the embryonic period (Super and Soriano 1994; Deng et al. 2006). Second, as mentioned above, myoclonic movements and somatosensory stimulation induce neuronal activation in CA1 (Karlsson et al. 2006;Mohns and Blumberg 2010;Marguet et al. 2015) that is disrupted after parahippocampal lesions, severing connections between the neocortex and the hippocampus (Mohns and Blumberg 2010). Therefore, it has been suggested that in neonatal animals, somatosensory inputs to hippocam-pal circuits are potentially conveyed via the EC (Mohns and Blumberg 2010). Finally, experiments using both pharmacoge-netic silencing of specific cell populations and doublecortin/ parvalbumin expression as maturation markers revealed that the EC drives entorhinal–hippocampal circuit maturation dur-ing the neonatal period. These experiments suggest that the EC sends an activity-dependent instructive signal sequentially and unidirectionally through the intrinsic circuits of the entorhinal– hippocampal network (Donato et al. 2017). These observations suggest that functional communication in the entorhinal–hip-pocampal system already exist during the neonatal period, and that it may be critical for the development of entorhinal–hippo-campal circuits. To address this question, we examined corre-lated activity in the superficial layers of the MEC and the hippocampus in neonatal ratsin vivo. We found that myoclonic movements trigger activity bursts in the EC, which in turn drive eSPWs in the hippocampus.
Materials and Methods
Ethical approval
All animal-use protocols followed the guidelines of the French National Institute of Health and Medical Research (INSERM, protocol N007.08.01) and Kazan Federal University on the use of laboratory animals (ethical approval by the Institutional Animal Care and Use Committee of Kazan State Medical University N9-2013). Experiments were carried out in accor-dance with the European Communities Council Directive of 24 November 1986 (86/609/EEC).
Animal preparation
Wistar rats of both sexes from postnatal days (P) 2 to 7 were used. Preparation of the animals for head-restrained recordings was as previously described (Leinekugel et al. 2002;Akhmetshina et al. 2016) with some modifications. In one group (Group 1; n = 9 animals), surgery was performed under isoflurane anesthesia the
day before recording (Akhmetshina et al. 2016). Animals were returned to the litter to recover from surgery and did not receive additional medications during recordings. In the second group (Group 2;n = 24 animals), surgery was performed under isoflur-ane isoflur-anesthesia the same day as the recordings, and the animals received buprenorphine analgesia (0.03 mg/kg of body weight; Buprecare) during the recordings. All simultaneous entorhinal– hippocampal recordings were made from Group 2 animals.
In both groups, while under isoflurane anesthesia the skull was cleared of skin and periosteum and covered by dental cement (Grip Cement, Caulk Dentsply, USA), leaving a 5 mm window above the left hippocampus and EC. The wound was treated with xylocaine (2%) and chlorhexidine (0.05%), animals were warmed up and left for an hour to recover from anesthe-sia. Group 1 animals were returned to the litter. The operated pups and their littermates were all painted with sesame oil to distract the mother from the surgery and handling odors. They were left in their home cage for 30 min, before the mother was transferred back in.
Electrophysiological recordings
Recordings were performed from head-restrained non-anaes-thetized rats the next day after surgery in Group 1 animals, and on the day of surgery in Group 2 animals. A metal ring was fixed to the skull with dental cement and via ball-joint to a magnetic stand. Animals were surrounded by a cotton nest and heated via a thermal pad (35–37°C). During recordings, animals were regularly fed with heated milk and continuously moni-tored for any sign of pain or discomfort and, if such occurred, the animals were given an overdose of urethane and the exper-iment was immediately discontinued.
Extracellular recordings of LFPs and multiple unit activity (MUA) were performed along the CA1—dentate gyrus axis of the dorsal hippocampus and the dorsal part of MEC (Supplementary Fig. 1) using linear silicon probes with 50–100 μm separation dis-tance between the electrodes depending on the probe used (NeuroNexus, USA). Electrodes were placed using stereotaxic coordinates obtained from an atlas of the postnatal rat brain (Khazipov et al. 2015), depending on the age of animal. For fur-ther histological reconstruction of electrode tracks, electrodes were coated with ethanol-dissolved DiI (Sigma) and allowed to dry prior to insertion. A chlorided silver wire, placed in the cere-bellum or neocortex, served as a ground electrode. Signals from extracellular recordings were amplified and filtered (×10 000; 0.15 Hz to 10 kHz) using Digital Lynx SX amplifier (Neuralynx, USA), CellAmp64 (Dipsi, France) or custom made amplifier (×10 000; 1 Hz to 10 kHz; A. Alexeev, Trinity, Russia), digitized at 10–32 kHz and saved on a PC for post hoc analysis. From 30 min to 2 h of spontaneous activity were recorded in each animal. Body movement recordings were performed using one to four piezoelectric sensors attached to the forelimbs and hindlimbs.
Stimulations
Stimulations of the ventral hippocampal commissure (VHC) and of the angular bundle were performed using bipolar elec-trodes prepared from 50μm diameter tungsten wires or glass theta pipettesfilled with saline. Electrodes were placed in the corresponding location using coordinates of the stereotaxic atlas (Khazipov et al. 2015). Electrical stimuli (50–200 μs dura-tion, 10–65 V amplitude) were applied every 10 s. For each stim-ulation site, 50–100 responses were recorded and averaged.
Placement of the stimulation sites was verified post hoc during histological analysis in coronal brain sections.
Histology
After recordings the animals were deeply anaesthetized with urethane (3 g/kg, intraperitoneally) and perfused through the left cardiac ventricle with 4% paraformaldehyde and 1% glutar-aldehyde (Sigma). The brains were removed and left forfixation in a solution containing glutar- and paraformaldehyde at room temperature. The brains were then rinsed in PBS and cut into 100-μm-thick slices using a Vibratome (Thermo Scientific, USA). The slices cut in coronal plane were used for identification of hippocampal probe and stimulating electrode locations, and sagittal sections were made to determine the probe location in the EC. Electrode positions were identified from the DiI tracks overlaid on the microphotographs of sections in oblique light or after cresyl violet staining. The location of the silicone probe tip was assessed through identification of the DiI track in serial 100-μm-thick sagittal sections of the EC. We then selected the section that displayed the deepest and strongest DiI signal, which was considered as the probe tip. In hippocampal record-ings, electrodes location was also verified by the highest MUA rate in CA1 stratum pyramidale.
Detection of eSPWs, MEC bursts and myoclonic movements
Wideband recordings were preprocessed using custom-written functions in MATLAB (MathWorks, USA). For a given recording session, eSPWs were detected semi-automatically from down-sampled (1000 Hz), bandpass filtered (0.1–100 Hz, Chebyshev Type 2 Filter) LFPs on each channel. All events reaching an absolute value greater than 80–100 μV were first considered as putative eSPWs. To discard movement and static artifacts, LFP segments were taken from−0.5 to 1 s around the eSPW peak negativity for each channel and visually inspected. Time= 0 for the eSPWs was defined as the time of maximal LFP negativity of the eSPW.
MEC bursts were detected using a complex parameter of the power in beta-gamma frequency (15–90 Hz) multiplied by the MUA density. A threshold for burst detection was set as three standard deviations of the resulting trace, and burst onsets were defined as intersections with one standard deviation level. Noisy events were excluded after manual selection. Time= 0 for MEC events was defined as a time of the closest significant LFP nega-tive peak to the onset. For MEC events associated with a sharp potential, this coincided with the time of the negative peak of the sharp potential. Spectral power was estimated using direct multitaper estimators (10 Hz bandwidth, three tapers, 100 ms spectral window) or a continuous Morlet wavelet transformation of the 15–90 Hz bandpass filtered LFP signal.
Limb and body movements were detected as events on piezo channels exceeding a threshold level that was individu-ally adjusted for each recording channel. To avoid noisy events piezo signals were smoothed with 30 ms sliding window and events shorter than 10 ms were excluded from the analysis. Two neighboring events closer than 100 ms were considered as one movement. Simultaneous events on multiple piezo chan-nels were considered as a single movement with the earliest onset and the latest offset defined across all piezo channels. Movements detected on one or multiple channels were used for the further analysis.
To determine the relationships between myoclonic jerks, entorhinal bursts and eSPWs, event timestamps were stored in a 1 ms bin vector spanning from−2 before to 2 s around each reference event. Each vector was then convolved with a 10-bin Gaussian window. Shuffling was performed by shifting ran-domly the follower event by±2 s and perform perievent time histograms (PETHs) a thousand times.Z-scores were computed to estimate significance as described below.
To eliminate volume conductance and localize synaptic cur-rents, CSD analysis across depth was then performed on LFP traces normalized to the maximum amplitude signal across all channels and averaged across events. CSD was computed for each recording site according to a differential scheme for sec-ond derivative and smoothed with a triangular kernel of length 3 (Freeman and Nicholson 1975).
Single unit analysis
For single unit analysis, we used the klustasuite spike sorting (Rossant et al. 2016) and clustering pipeline obtained fromhttp:// cortexlab.net/tools/; last accessed on November 28, 2018. Spike sorting consisted of the following three steps performed by sep-arate python-based programs: (1) spike detection and feature extraction; (2) cluster analysis, segregating waveforms based on their features and (3) manual verification and adjustment of cluster assignments. All steps were performed according to
Rossant et al. (2016) with some adaptation to the spike features in the neonatal animals. In brief, spike detection and feature extraction were performed on first bandpass filtered (500–6000 Hz) LFPs (Butterworth filter in forward-backward mode). This process took into account the geometry of the linear probe, allowing action potentials detected at the same time but in spatially separated electrode contacts (contacts in CA1 and DG for instance) to be considered as different entities. In addi-tion, action potentials were extracted using a double threshold (two and four times the standard deviation of thefiltered signal) flood fill algorithm (Rossant et al. 2016) which prevents false detections or erroneous splitting of action potentials as a result of noise. Waveforms were realigned to their negative peak and principal component analysis (PCA) was performed on all wave-forms detected on each channel. Each action potential was therefore given three summary features consisting on the wave-form PCA scores for the three major principal components.
Cluster analysis, performed using klustakwik (Kadir et al. 2014) (Supplementary Fig. 4). Cluster quality, that is how well action potentials from one cluster are separated from other action potentials recorded in the same probe, was estimated using the isolation distance (ID) and L-ratio measures developed bySchmitzer-Torbert et al. (2005). Units with an ID< 5 were dis-carded from the dataset. Only potential units with the following properties were kept for analysis: waveforms had to be detected on≤3 electrode contacts; their amplitude had to be higher than 50μV; their refractory period had to be ≥2 ms and they had to fire more than 50 action potentials in a 10-min session.
Single unit isolation and clustering in pups was more complex than in adult rodents. Single unit features in MEC and hippocam-pus and their firing in relation to the eSPWs, MEC bursts and spontaneous movements are summarized in Supplementary Table 4. Of the 159 CA1 units detected by the klustasuite pipeline (n = 26 rats), only 36 reached our selection criteria (n = 12 rats). These proportions were also small in CA3 (34/82 Units;n = 12 and n = 13 rats), DG (30/120 Units) or MEC L3 (58/153 Units, n = 11 and n = 18 rats) likely due to weaker amplitude of extracellular spikes of immature neurons, their lowfiring rate and the differential
damage to cells layers made by the linear shank in its path (shal-lower structures being more damaged by the electrode body). In all structures, single unit firing rate was much lower than reported in adults (see Supplementary Fig. 4E for comparison withCsicsvari et al. 1999). They ranged from 0.11± 0.01 Hz in MEC L3 to 0.36± 0.09 Hz in CA3 (DG: 0.24 ± 0.05 Hz; CA1: 0.18 ± 0.03 Hz) but differed significantly across structures (Kruskal–Wallis test, P < 0.001) with MEC L3 units firing significantly more than in all recorded hippocampal subfields (Dunn’s multiple comparisons test, P < 0.05). In addition, spike width at 25% amplitude (extracted from wideband 0.1–5000 Hz LFP as inCsicsvari et al. 1999) also differed between groups (Kruskal–Wallis test, P < 0.001) with MEC L3 units (713± 16 μs) being significantly wider than all recorded hippocampal subfields (CA1: 600 ± 21 μs; CA3: 573 ± 17 μs and DG: 530± 13 μs; Dunn’s multiple comparisons test, P < 0.001). There was no significant difference between CA1, CA3 and DG units in terms offiring rate and width. Thus, single units fired less frequently and their duration was longer than in adults. Also, based on theirfiring properties we could not separate pyramidal cells from fast-spiking interneurons that is in keeping with the results of previous developmental studies (Weir et al. 2014).
Unit PETHs were performed by binning spike trains (5 ms bins) in a±2 s perievent time window (eSPWs, MEC burst, myo-clonic movement). Such binned data was then convolved with a 10-bin Gaussian window and averaged across trials. To esti-mate PETH significance, z-scores were estiesti-mated on the basis of a shuffled surrogate dataset. For each trial, spike trains were randomly shuffled in time and a PETH was computed for the whole surrogate session. This operation was repeated 1000 times, across which means and standard deviations were com-puted for each bin. When a peakfiring was detected, a Z-score was computed as: Zp= (xp− mp)/stdp, where xp is the actual
value observed in bin p andmpand stdpare the mean and
stan-dard deviation values at bin p in the surrogate PETH. Peaks cor-responding to a Z-score of higher than 1.65 (α = 0.05) were considered as significant.
Statistics
Statistical analysis was performed using the Graphbad PRISM 6 software, Origin and MATLAB Statistics toolbox. Group compar-isons were done using Student’s t-test and one- or two-way ANOVA if homogeneity of variance between groups was respected. Otherwise, non-parametric Kruskal–Wallis tests were performed. When global statistical differences were found,post hoc comparisons (Tuckey or Dunn multiple compari-son tests for parametric or non-parametric data, respectively) were performed. To compare proportions of single units acti-vated during sharps, chi-square or Fisher exact tests were used, depending on the number of samples considered. Degrees of freedom, t- and P-values are reported as df, t, and P, respec-tively. P-value 0.05 was considered significant. Correlations between variables were estimated using either the Pearson (r) or Spearman, non-parametric, rank-based (ρ) correlation coeffi-cients, depending on whether data were linearly correlated and normally distributed around the regression line. Unless indi-cated, data are presented as mean± SEM.
Results
Co-activation of MEC and hippocampus during myoclonic movements
Wefirst performed simultaneous recordings of LFPs and multi-ple/single unit activity from dorsal hippocampus and
superficial layers of MEC, and concomitant body/limbs move-ment piezo-recordings in non-anaesthetized head-restrained postnatal days [P] 4–6 rats (Fig. 1). Location of the recording sites was identified during post hoc analysis of the DiI electrode tracks in coronal sections for hippocampal recordings and sag-ittal sections for the MEC recordings (Fig.1A,B). Among five ani-mals used in this series of experiments, electrode position was in MEC Layer 3 (MEC L3) in four animals and in MEC Layer 2 (MEC L2) in one animal (Supplementary Fig. 1).
In agreement with results from previous studies, activity in the MEC and the hippocampus was characterized by discontin-uous temporal organization and intermittent neuronal network activity bursts (Leinekugel et al. 2002; Karlsson et al. 2006;
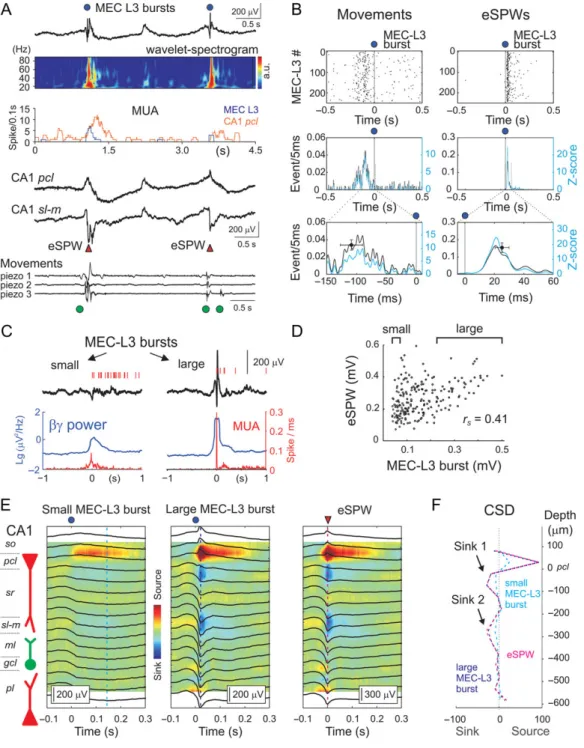
Mohns et al. 2007;Marguet et al. 2015;Unichenko et al. 2015). MEC L3 activity bursts were characterized by collective neuro-nal discharges associated with an increase in LFP power in beta-gamma frequency range (15–90 Hz) and often with a large amplitude sharp potential occurring at the burst onset (Unichenko et al. 2015) (Fig.1C,D top trace from channel #31 located in MEC L3; MEC events are indicated by blue circles; color-coded spikes of individual neurons are shown above the trace; see also Fig.2A,C). Hippocampal activity was character-ized by ripple-lacking eSPWs, which were associated with a negative sharp potential below the CA1 pyramidal cell layer (pcl) and polarity reversal at the pcl, which were often followed by“tails” (Leinekugel et al. 2002; Karlsson et al. 2006;Mohns et al. 2007;Marguet et al. 2015) (Fig. 1C,D middle traces from channels # 3, 5 and 10 located inpcl, stratum radiatum (sr) and stratum lacunosum-moleculare (sl-m), respectively; sharp waves are indicated by red triangles; see also Fig.2A,E). We note that despite some electrographic similarity between the SPWs in neonatal rats and adult SPWs, there are important dif-ferences in physiological mechanisms underlying these two activity patterns (see below) and, therefore, we propose using a term of“early SPWs” (eSPWs) in neonatal rats. Motor behavior in rat pups during active sleep (a predominant behavioral state in which neonatal rodents spend most of the time) was charac-terized by intermittent myoclonic body movements (Fig.1C,D bottom trace of piezo-mechanogram from a forelimb; move-ments are indicated by green circles).
As illustrated by the example recordings in Fig.1(see also Fig.2), bursts in MEC L3 and hippocampal eSPWs were highly synchronized and they often co-occurred with myoclonic movements. Myoclonic movements typically startedfirst, were followed by MEC L3 bursts and then by eSPWs. These correla-tions were also evident on eSPW-triggered average MEC L3 LFP signal and movement traces (Fig. 1D, right traces) and on eSPW-triggered raster plots and PETHs of MEC bursts and myo-clonic movements (Fig.1E, n = 4 rats). We further assessed the co-occurrence probability, the level of synchronization and the time lags between hippocampal eSPWs, MEC L3 bursts and myo-clonic movements (Fig. 1E, bottom plots and Supplementary Tables 1–3). We found that 77 ± 6% (z-score = 18.6 ± 3.2) and 71± 5% (z-score = 9.9 ± 1.2) of eSPWs were preceded by MEC L3 bursts and myoclonic movements within a 300 ms time window, respectively. The time lags separating eSPWs from movements and MEC L3 bursts were of 146.0± 10.6 and 28.5 ± 4.8 ms, respec-tively. This is in agreement with the delays between startles and eSPWs reported previously (Karlsson et al. 2006). Along with these results, similar analysis using MEC L3 bursts as a trigger con-firmed high level of co-occurrence of MEC L3 bursts, movements and eSPWs, with the movements reliably preceding MEC L3 bursts and the eSPWs reliably following the eSPWs. This was evi-dent in the MEC L3-triggered raster plots and PETHs of
movements and eSPWs (Fig.2B and Supplementary Tables 1–3). On average, 66± 5% (z-score = 11.8 ± 2.2) and 88 ± 2% (z-score = 18.7± 3.6) of MEC L3 bursts were preceded by myoclonic move-ments and followed by eSPWs within a 300 ms time window, respectively. The time lags of the MEC L3 bursts from the move-ments and eSPWs bursts were −90.8 ± 6.0 and 27.5 ± 4.8 ms, respectively. Taken together, these results indicate that the majority of MEC L3 bursts and hippocampal eSPWs co-occur, with the MEC L3 bursts preceding eSPWs by ~30 ms, and that these MEC L3 burst/eSPW sequences are typically preceded by myoclonic twitches with a time lag of ~90 ms. Noteworthy, myo-clonic movements were much more frequent than cortical events, with only ~10% of them co-occurring with the entorhi-nal–hippocampal events (Fig.1A and Supplementary Tables 1–3). MEC L3 bursts and hippocampal eSPWs correlated not only in time but also in amplitude. As shown in Fig. 2C, small-amplitude MEC L3 bursts were associated with small-small-amplitude eSPWs, whereas small-amplitude MEC L3 bursts, notably those associated with the large sharp potential at the burst onset, were associated with larger amplitude eSPWs (rS= 0.55 ± 0.08;
n = 4 rats, P < 0.001; Fig2D). MEC L3 burst-triggered LFP in hip-pocampus was characterized by a negativity peak below- and a reversal at the level of the CA1pcl as well as by sr and sl-m cur-rent sinks (Fig.2E). These occurred with a delay of 48.8 ± 12.5 ms after the MEC L3 bursts (n = 4 rats). The CSD profile of MEC L3 burst-triggered hippocampal LFP signals was remarkably similar to that of the eSPWs detected independently (Fig.2E,F). The minority of eSPWs that were not associated with the MEC L3 bursts (23% of the total number of eSPWs) was smaller in amplitude but had a CSD profile similar to the profile of the eSPWs associated with MEC L3 bursts (Supplementary Fig. 2). However, these eSPWs were still associated with an increase in neuronalfiring and LFP signals in MEC L3 remaining subthresh-old for our detection paradigm (Supplementary Fig. 2). This sug-gests that the co-occurrence probability of MEC L3 bursts and eSPWs (77% in MEC L3 burst—eSPW pairs and 88% in MEC L3 burst—eSPW pairs) is actually higher than what was assessed with our relatively conservative detection threshold.
We also found that the amplitude of MEC bursts and hippo-campal eSPWs mildly but significantly correlated with the amplitude of preceding movements (MEC: Spearman’s rs= 0.30 ±
0.10;P < 0.05 in four of the five animals; eSPWs: Spearman’s rs=
0.30± 0.11; P < 0.05 in five animals) and that movements followed by MEC bursts and hippocampal eSPWs were almost twice as ample than “blank” movements (n = 5 P4–6 rats, P < 0.05; Supplementary Fig. 3). However, the amplitudes of movements with or without MEC bursts and hippocampal eSPWs largely over-lapped and there was no real threshold for movements to elicit cortical events (Supplementary Fig. 3).
Single unit behavior during MEC L3 bursts and eSPWs
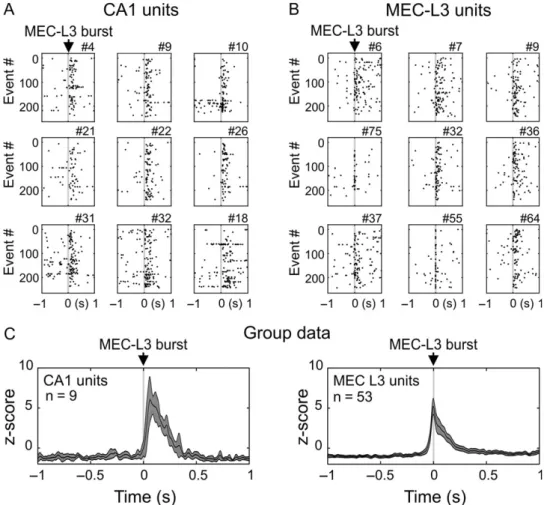
We then investigated whether activity of single units in MEC L3 and CA1pcl was modulated in relation to MEC L3 bursts (Fig.3; see Materials and Methods and Supplementary Fig. 4 for the single unit detection procedure and Supplementary Table 4 for unit features and relation to population events). This analysis was restricted to sessions with simultaneous CA1 and MEC L3 recordings (n = 4 pups). To assess single unit modulation by MEC L3 events, we performed PETHs aligned to MEC L3 bursts. Significance was estimated by expressing peak firing rates as z-scores with respect to shuffled surrogate data (see Materials and Methods). All units in CA1 (n = 9) and MEC L3 (n = 53) showed a significant firing increases during MEC L3 events
(Fig.3A,B), as characterized by remarkably high Z-scores (CA1 Z = 13.10 ± 1.53; MEC L3 Z = 11.44 ± 0.81) with the peak firing attained at 16.2± 0.8 ms for MEC L3 units and 91.7 ± 14.1 ms for CA1 units. Raster plot examples of nine CA1 and nine MEC L3 units recorded simultaneously are shown in Fig.3A,B, respec-tively. Averaged PETHs for all recorded units in each group are shown in Fig.3C. On this representation, MEC L3 units peaked approximately −5 ms before MEC L3 burst times while CA1
units peaked ~60 ms after. While peak times from averaged PETHs differed from the average peak times of individual PETHs, the delay between MEC L3 and CA1 units of ~70 ms was within the same range. On average, MEC L3 unitsfired in 17.8 ± 1.7% of MEC L3 events, with a rate of 0.21± 1.73 action potential per event.
Next, we explored how single unit activity in different regions was modulated in relation to CA1 eSPWs (Figs4and5
Figure 1. Activity bursts in MEC layer 3 precede early hippocampal sharp waves in neonatal rats. Recording sites of the DiI-stained multielectrode arrays overlaid on a cresyl violet stained sagittal MEC slice (A) and coronal hippocampal slice (B) in a P5 pup. (C) Simultaneous LFP recordings (black traces) in MEC (recording site # 31 on A), CA1 pyramidal cell layer (pcl), stratum radiatum (sr) and lacunosum-moleculare (sl-m) from the recording sites # 3, 5 and 10 in (B), respectively. Bottom, movement recording averaged over three piezo channels. Action potentials from individual clustered unit are represented by vertical lines in distinct colors. eSPWs are indicated by red triangles, MEC L3 burst times by blue circles, and myoclonic movements by green circles. (D) A MEC L3 burst/eSPW complex from panel (C) (red asterisk) and eSPW-triggered LFP average (right) on expanded time scale. Right, eSPW-triggered average traces for the whole session. The circles below average traces show group averages of delays between MEC L3 bursts and eSPWs (blue; mean± SD; n = 198 events recorded from four P4–6 rats), and between movement onset and eSPW (green; mean± SD; n = 180 events recorded from four P4–6 rats). (E) eSPW-triggered raster plots (top) and PETHs (middle-bottom) for forelimb movements (left) and MEC L3 bursts (right). Bottom and middle PETHs are identical, but on a different time scale.Z-scores are computed from shuffled data. Circles at the bottom plots show Z-score peak value and time (mean ± SD) from four P4–6 animals.
and Supplementary Table 4). In addition to the recordings shown above, this dataset included recordings made from dor-sal hippocampus without MEC electrode (n = 8 rats; P2–7) and MEC L3 without hippocampal units (n = 1 rat; P5). Altogether, we analyzed the activity of 36 cells in CA1 pyramidal cell layer, 34 cells in CA3 pyramidal cell layer, 30 cells in DG and 58 cells in MEC L3 (see Materials and Methods for cell selection criteria
and numbers). As above, we plotted PETHs aligned this time to eSPWs trough in CA1sl-m. We found that the firing rate of a large proportion of cells increased during eSPWs. There were, however, region-specific differences in the percentage of cells increasing theirfiring during eSPWs, as well as in the level of modulation of cellfiring during eSPWs and the timing of spikes in relation to eSPWs (Figs4and5and Supplementary Table 4). Figure 2. Relationships between MEC layer 3 activity bursts and early hippocampal sharp waves. (A) From top to bottom: LFP trace from MEC L3 (black) and associated spectrogram; MEC L3 (blue) and CA1 (red) multi-unit activity; simultaneous CA1 pyramidal cell layer (pcl) and stratum lacunosum-moleculare (sl-m) LFPs; piezo-recordings from both forelimbs and one hind limb. (B) MEC L3 burst-triggered raster plots (top) and PETHs (middle-bottom) for forelimb movements (left) and CA1 eSPWs (right). Bottom and middle PETHs are identical, but on a different time scale. Circles at the bottom plots showZ-score peak value and time (mean ± SD) from four P4–6 animals. (C) Examples of small (left) and large (right) amplitude individual MEC L3 bursts. Below, associated LFP power in the beta-gamma range (blue) and multiple unit activity (red) of the 25% smallest and 25% largest MEC L3 bursts (outlined by brackets on panelD). (D) Relationships between MEC L3 burst and CA1 eSPW amplitude for this animal. (E) The CSD profiles of MEC L3-triggered potentials in the CA1 hippocampus for 25% smallest (left) and 25% largest MEC L3 bursts (middle). Right, CSD profile of all eSPWs detected through the entire recording session. (F) The CSDs of the small and large MEC L3 burst-triggered hippocampal LFP and eSPW at the time indicated by the vertical dashed lines on (E).
The proportion of cells that showed a significant firing increase (see Materials and Methods) with regard to eSPWs was signifi-cantly different across structures (χ2= 22.75, df = 3, P < 0.0001;
Fig.5A). This proportion was particularly low in CA3 where it only reached 45.2% as compared to 72.2%, 70% in CA1 and DG and 87.9% in MEC L3, where it was the highest. CA3 proportions were significantly lower than in MEC L3 (post hoc comparison, Fisher’s exact test, P = 0.0001) but not significantly different from CA1 or DG, as comparisons failed to reach significance after Bonferroni correction (CA1-CA3: P = 0.015; DG-CA3: P = 0.026 NS: because six comparisons were performed, B-F correc-tion requiresP < 0.008 to reach significance). All other compari-sons were not significant, even without correction.
Considering significantly activated cells, z-scores at the peak differed between groups (Kruskal–Wallis test—unequal var-iances,P = 0.018). Post hoc comparisons (Dunn’s multiple com-parisons test) revealed that CA3z-scores (mean Z = 3.58 ± 0.33) were lower than for MEC L3 (Z = 6.59 ± 0.51; P < 0.05). All other comparisons did not reach significance (CA1 Z = 5.77 ± 0.61; DG Z = 5.54 ± 0.55). To summarize, CA3 had the lowest proportion of units that were significantly activated by eSPWs. About half of CA3 units that were significantly activated also had lower firing peaks. This effect is also revealed in Fig.4showing raster plots and PETHs for one example cell per structure (Fig.4A) and in Fig.4B showing PETHs averaged across all cells. Still selectively considering significantly activated cells, peak firing time lag with regard to eSPW differed between structures (ANOVA: F(3.108) =
16.83,P < 0.0001; Figs4B and5B) with MEC L3 cells reaching a peak 6.1± 8.5 ms before eSPWs. This time lag was significantly different (Tuckey’s multiple comparison test) from CA1, CA3 and DG peaks which occurred on average 76.7± 10.6 ms (P < 0.001), 86.43± 16.9ms (P < 0.001) and 58.09 ± 13.19 ms (P < 0.001) after eSPWs, respectively. Time lag differences are also visible on averaged PETHs (Fig.5B). Peak time comparisons between hippo-campal subfields did not reach significance.
MEC L2
In one P4 animal, one silicone probe was positioned in MEC L2, and concomitant recordings in hippocampus were performed with another silicone probe together with the piezo-movement detections (Supplementary Fig. 5). In this animal, highly corre-lated activity in MEC L2 and hippocampus was also reliably pre-ceded by myoclonic twitches as described above for the MEC L3. This is evidenced by the MEC L2-triggered hippocampal LFP and its CSD profile (Supplementary Fig. 5D), eSPWs and movement raster plots (Supplementary Fig. 5F), a robust correlation between the amplitudes of MEC L2 events and eSPWs (Supplementary Fig. 5E; rS= 0.72, P < 0.001), and, finally, by cross-correlation
analy-sis of MUA, which showed very high levels and a peakfiring of CA1 hippocampal units 15 ms after MEC L2 units (Supplementary Fig. 5H). Also, in this animal the two isolated MEC L2 single units showed a robust participation in MEC L2 population bursts (Supplementary Fig. 5G). Despite general similarity in MEC L2 and Figure 3. MEC L3 and CA1 single unit activity in relation to the MEC L3 bursts. MEC L3 bursts triggered raster plots from individual cells recorded simultaneously in CA1 pyramidal cell layer (A) and MEC L3 (B) (nine cells in each region). Each dot represents an action potential, and each line represents a MEC L3 burst. Time 0: MEC L3 burst time. (C) PETH (mean ± SEM) for all cells recorded in each region. Z-scores are computed on the basis of shuffled data.
L3 behaviors, MEC L2 bursts were associated with a negative potential through the entire time course of the burst (Supplementary Fig. 5C), unlike in MEC L3, where this slow enve-lope was less prominent or even reversed in polarity to positive.
CSD profile of the eSPWs
The activation of L2 and L3 MEC units suggests that there is a co-activation of the perforant and temporoammonic inputs to hippocampus during MEC burst/eSPW sequences. Consistent with this hypothesis, the CSD analysis of hippocampal eSPWs revealed two main sinks in CA1 hippocampus located insr (Sink 1, likely generated by a trisynaptic loop MEC L2→ DG → CA3 [+L2 → CA3] → CA1 sr) and in the vicinity of hippocampal fissure (Sink 2, likely generated by the temporoammonic pathway MEC
L3→ CA1 sl-m) (Ylinen et al. 1995;Buzsaki 2015) (Fig.6A,B). Sink 1 was located 74± 7 μm (n = 24/28 rats) and Sink 2 262 ± 13 μm (n = 28/28 animals; Fig.6C) bellow the pcl border. Because absolute values of the recording electrodes’ depth varied between the ani-mals depend on the silicone probe position, we also calculated the depth of Sinks 1 and 2 normalized to the distance between the CA1pcl (=0) and the hippocampal fissure (=−1). In these nor-malized coordinates, Sink 1 and Sink 2 depths were found corre-spondingly at−0.24 ± 0.02 (n = 24 rats) and −0.83 ± 0.04 (n = 28 animals) of the normalizedpcl – fissure distance (Supplementary Fig. 6A). On the temporal scale, there was variability in the rela-tive occurrence of Sinks 1 and 2 from one eSPWs to another in a given animal and also between animals. On average, however, these two sinks occurred without any significant delay from each other (delay between Sinks 1 and 2: 11.8± 6.2 ms; t-test Figure 4. Single unit activity in hippocampus and MEC L3 in relation to the early hippocampal sharp waves. (A) Raster plots (top) and PETHs of individual cells aligned to eSPW times. CA1 and MEC L3 cells were recorded simultaneously. (B) Average PETHs from all selected cells in each structure expressed as a z-score from shuffled data. Insets are zoomed versions at an expanded time scale.n, number of cells.
Figure 5. Single unitfiring properties with regards to eSPWs. (A) Percentage of units with significant PETH peaks (z > 1.65). (B) Average time of peak firing of single units relative to eSPWs. (C) Average z-scores at peak firing. Error bars correspond to standard error of the mean.
against zero mean hypothesis:t = −1.90; P = 0.07; n = 24 rats; Supplementary Fig. 6B). These two sinks were also comparable in size with a mean Sink 1 to Sink 2 intensity ratio of 1.17± 0.16 (t = 7.33; P < 0.001; n = 24 rats; Supplementary Fig. 6C).
We further compared the CSD profiles of eSPWs with the responses evoked by electrical stimulation of the two main inputs to CA1: CA3 (n = 13 P2–7 rats) and the EC (n = 15 P2–7 rats). With this aim, we stimulated the VHC and the angular Figure 6. CSD profile of the eSPWs, VHC and AB-evoked responses in the neonatal rat hippocampus. Left, recording sites of the DiI-stained multielectrode arrays (top microphotographs) and ventral hippocampal commissure (VHC,A) and angular bundle (AB, B) stimulation sites (bottom microphotographs) overlaid on a cresyl violet stained coronal sections. On the right, a schematic drawing of cell bodies and dendrites across hippocampal layers. Middle panels, corresponding localfield potential (black traces) overlaid on the color-coded CSD map of the VHC-evoked (A) and AB-evoked (B) responses and eSPWs. Right plots show CSD at the peak of the VHC-(red) and evoked (blue) responses and the eSPWs (black). Note that the two main Sinks 1 and 2 of the eSPWs match the depth of the sinks of the VHC and AB-evoked responses in the CA1sr and sl-m, respectively. (C) Group data on the CSD profiles of the eSPWs’ Sinks 1 (black circles) and 2 (open circles), and sinks of VHC-(red triangles) and AB- (blue triangles) evoked responses in each animal. Data from the animals where only eSPWs were recorded are shadowed. In four animals Sink 1 was not observed (x). Right, group averages± SD from 17 P2–7 rats.
bundle (AB), respectively. The examples of typical responses evoked by VHC and AB stimulation with their depth profiles are shown in Fig.6A,B. The VHC stimulation evoked a negative LFP potential peaking at 11.9± 0.4 ms after stimulus (n = 13 rats). The CSD analysis of VHC-evoked responses revealed a sink located insr, 76 ± 9 μm below the pyramidal cell layer. The loca-tion of this VHC-evoked sink did not differ from the localoca-tion of eSPWs Sink 1 (−79 ± 12 μm paired t-test; df = 10; t = 0.16; P = 0.87; Fig.6C). The responses evoked by AB stimulation occurred 21.7± 2.7 ms after the stimulus and were often organized in doublets (n = 15 rats). The CSD analysis of AB-evoked responses revealed a main sink located in sl-m and at around fissure, −270 ± 14 μm below the pyramidal cell layer (n = 15 rats), and the location of this sink matched the location of eSPWs Sink 2 (−284 ± 15 μm; df = 14; t = 1.385; P = 0.19; Fig.6C). This supports the involvement of the temporoammonic MEC L3→ CA1 sl-m inputs from the EC in the generation of Sink 2 during eSPWs. In addition, the response evoked by the AB stimulation typically contained a sink in sr matching the position of eSPW Sink 1 (Fig.6B), suggesting a co-activation of the perforant input from L2.
Discussion
The mainfindings of the present study are that during the neo-natal period, activities in the MEC and the hippocampus are highly synchronous; that the MEC drives activity in the hippo-campus and that this synchronization is preceded by myo-clonic movements. In addition, we provide evidence that eSPW generation in CA1 involves a co-activation of intrahippocampal inputs from CA3 and inputs originating from the EC. These con-clusions are based on the following observations. First, myo-clonic movements preceded activity bursts in the superficial MEC, which in turn preceded a vast majority of the hippocam-pal eSPWs. Second, neurons in superficial layers of the MEC fired before hippocampal dentate, CA3 and CA1 neurons. Third, CSD analysis of eSPWs revealed two main sinks: one in thesr, where Schaffer collaterals contact the apical dendrites of CA1 pyramidal cells, and a second sink in thesl-m, where the inputs from the EC establish synapses on the distal dendrites of CA1 pyramidal cells. Fourth, responses evoked by electrical stimula-tion of the VHC and AB were characterized by main sinks matching thefirst and second eSPW sinks, respectively.
Circuitry mediating eSPWs
We propose a wiring diagram of correlated entorhinal–hippo-campal activity in neonatal rats (Fig.7), in which the EC drives the hippocampus and the early entorhinal–hippocampal com-munication is embedded into a large-scale bottom-up circuit processing somatosensory feedback resulting from neonatal movements. Myoclonic movements (1) generate sensory feed-back (2), which triggers activity bursts (early gamma and spindle-burst oscillations) in the primary somatosensory cortex (S1) (3) (Khazipov et al. 2004b; Yang et al. 2009; Mohns and Blumberg 2010;Akhmetshina et al. 2016;Inacio et al. 2016). S1 activity is further conveyed via long-range connections to the MEC where it ignites an activity burst (4). MEC L2/3 bursts are further conveyed from the MEC to the hippocampus through two streams: (i) the temporoammonic pathway from MEC L3 to the distal apical dendrites of CA1 pyramidal cells (5) generates asl-m sink and (ii) perforant path from MEC L2 to the dentate gyrus (DG) (6) and CA3 (7). Neuronal excitation in CA3 is ampli-fied by a recurrent excitatory CA3 network similarly to what occurs during adult SPWs (Ylinen et al. 1995; Csicsvari et al.
2000;Buzsaki 2015). Excitation of CA3 pyramidal cells activates Schaffer collaterals and generates a sr sink (8). Thus, both inputs from EC and CA3 are co-activated during MEC bursts/ eSPWs and their co-activation drives excitation of CA1 neurons. While this model predicts a delay between thesl-m and sr sinks due to additional synapses, it appears to be non-significant within the relatively long duration of the eSPWs. Whether exci-tation of CA1 cells during eSPWs further drives their output neocortical (including deep MEC layers, yellow arrow in Fig,7) and subcortical structures remains an open question for future investigations. Further reconstruction of this circuitry will also require incorporation of the intrinsic and long-range GABAergic interneurons that are critically involved in the generation of coordinated activities in entorhinal–hippocampal networks (Freund and Buzsaki 1996; Klausberger and Somogyi 2008;
Melzer et al. 2012; Le Magueresse and Monyer 2013; Buzsaki 2015;Basu et al. 2016).
Driver role of myoclonic movements
A remarkable feature of the entorhinal–hippocampal activity in the neonatal rats was that the activity bursts in this network were often preceded by myoclonic movements. This is in agree-ment withfindings of Blumberg and colleagues, who have pre-viously shown that startles evoke eSPWs (Karlsson et al. 2006), that twitches and somatosensory stimulations activate CA1 units (Mohns and Blumberg 2010), and that activation of CA1 units following twitches/stimulations is disrupted after para-hippocampal lesions that severed connections between the neocortex and hippocampus (Mohns and Blumberg 2010). Based on thesefindings, it has been suggested that somatosen-sory activation of hippocampus in neonatal animals involves activation of the input from neocortex to hippocampus via the EC (Mohns and Blumberg 2010). We provide direct evidence to this hypothesis by showing that activity bursts in superficial layers of the MEC are preceded by myoclonic movements, and that these MEC bursts further drive eSPWs in the hippocampus. We suggest that correlated activity in the neonatal entorhinal– hippocampal network described in the present study is a part of the large-scale bottom-up circuit that is activated during neonatal movements. In the future, it would be of interest to determine whether specific neuronal assemblies in the MEC and hippocampus are activated during different parts of body movements and different types of movements (startles vs. twitches). Future directions would also consist in determining whether activity in sensory cortices of different modalities (e.g., retinal wave driven spindle-bursts and slow activity transients in visual cortex (Hanganu et al. 2006, 2007; Colonnese and Khazipov 2010;Ackman et al. 2012) or cochlear-driven activity in auditory cortex (Babola et al. 2018)) influence early entorhi-nal–hippocampal activity.
eSPWs versus adult SPWs
Certain aspects of eSPWs remarkably resemble those of adult SPWs. However, some previous and present results indicate that these two activity patterns significantly differ. First, while neurons in superficial layers of the MEC strongly increase their firing before hippocampal eSPWs in pups, there is little to no activity change in these layers during adult SPWs, although inputs from the EC may bias the occurrence of adult SPWs (Isomura et al. 2006;Sullivan et al. 2011). Instead, adult hippo-campal SPWs are associated with a significant increase of firing in deep layers of the EC, which is driven by CA1 input (Chrobak
and Buzsaki 1994;Chrobak et al. 2000). Second, adult SPWs are not associated with a sink in CA1 sl-m. Third, in contrast to eSPWs, movements do not trigger adult SPWs (Buzsaki 2015). Fourth, SPW-associated fast oscillations (ripples) are not pres-ent until the end of the second postnatal week, reaching fre-quency and amplitude similar to adults by P20 (Buhl and Buzsaki 2005). The main difference in the generative mecha-nisms is that adult SPWs are generated within the hippocampal circuit whereas eSPWs integrate the external input from the MEC with the internal hippocampal circuit, yet with a relatively weak participation of CA3 units compared to the MEC, CA1 and DG units. Therefore, we propose that eSPWs are a distinct developmental network activity pattern, a prototype of the SPWs which should lose its MEC drive during maturation to transform towards an adult SPW generated purely in intrahip-pocampal circuit. Developmental transformation from eSPWs to adult SPWs may involve several mechanisms. First, the recurrent CA3 connections are sparse during thefirst postnatal week. CA3 pyramidal cells display short local axon arbors and possess very few branches. In addition, their spurt only occurs during the second postnatal week (Gomez-Di et al. 1997), during which an increase in CA3 excitability is observed in various epi-lepsy models (Swann and Brady 1984; Gomez-Di et al. 1997;
Khazipov et al. 2004a;Mohns et al. 2007). Second, the feedfor-ward inhibitory circuits, which involve perisomatic projecting interneurons are immature during the first postnatal week (Khazipov et al. 2013). Both in the hippocampus and neocortex, perisomatic interneurons develop fast-spiking phenotypes, incorporate into the network and form electrical and chemical synapses from the end of thefirst postnatal week onwards.The development of these cells continues during thefirst postnatal month (Du et al. 1996;Chattopadhyaya et al. 2004;Daw et al.
2007;Huang et al. 2007;Doischer et al. 2008;Okaty et al. 2009;
Wang and Gao 2010;Goldberg et al. 2011;Pangratz-Fuehrer and Hestrin 2011;Le Magueresse and Monyer 2013).
In addition to the electrographic resemblance between eSPWs and adult SPWs, the presence of a current sink insr but not insl-m led investigators to consider eSPWs as adult SPWs. The most likely explanation whysl-m sink was overlooked in the previous studies may be two-fold. First, in pups, the dis-tances between thepcl and the sr, and between the pcl and sl-m from are much shorter than in the adult brain. Second, the large distance between electrodes in linear arrays may compro-mise the identification of current sinks separated by a short distance. To account for these biases, we performed histologi-cal reconstructions of electrode locations in all recordings, extensive functional layer mapping with VHC and AB stimula-tion, and we used, in a majority of recordings, higher density (50 μm separation distance) silicone probes. Previous studies located the main eSPW sink ~ 300μm below the pyramidal layer (Leinekugel et al. 2002;Mohns et al. 2007). While this depth cor-responds tosr in adults, it corresponds to sl-m in the neonates. Interestingly, the second, deep sink location that we identified insl-m (~300 μm) matched the depth of the eSPW sinks reported in previous studies (Leinekugel et al. 2002;Mohns et al. 2007), whereas the sr current sink found in the present study was only ~100μm below the pcl.
Physiological roles
Explorative behaviors and cognitive functions that are supported by the EC and hippocampus, grid and place cells, and relevant physiological patterns of theta oscillations and adult SPWs, are not present during the neonatal period (Wills et al. 2010;Wills and Cacucci 2014;Tan et al. 2017). Similarly to other brain regions, where a variety of immature activity patterns participate in the elaboration of neuronal circuits (Blankenship and Feller 2010;
Hanganu-Opatz 2010; Colonnese and Khazipov 2012; Luhmann and Khazipov 2018), movement-triggered MEC-hippocampal dis-charges likely contribute to the development of circuits within the entorhinal–hippocampal loop by means of synchronization of neuronal activity and activity-dependent plasticity. Ourfindings are consistent with, and provide functional support to the hypoth-esis that MEC provides an activity-dependent instructive signal that drives maturation sequentially and unidirectionally through the intrinsic circuits of the entorhinal–hippocampal network dur-ing the postnatal period (Donato et al. 2017). Many other networks in the brain operate in a similar bottom-up fashion including reti-nal wave driven activities in visual thalamus-cortex (Hanganu et al. 2006, 2007; Colonnese and Khazipov 2010; Ackman et al. 2012;
Zhang et al. 2012), cochlear burst-driven activity in auditory system (Tritsch et al. 2007; Wang and Bergles 2015; Wang et al. 2015;
Babola et al. 2018) and activities in somatosensory cortex, the latter being driven by sensory feedback from spontaneous movements (Khazipov et al. 2004b;Yang et al. 2009;Mohns and Blumberg 2010;
Akhmetshina et al. 2016;Inacio et al. 2016).
The experiments described here illustrate how, in the early stages of development, neuronal activity in the brain depends on body-derived signals. Activity in phylogenetically older structures, such as the spinal cord (which initiates twitches (Robinson et al. 2000;Petersson et al. 2003;Inacio et al. 2016)), is the main source of drive in newer parts of the brain early in development. With the maturation of the long-range excitatory connections, self-organized patterns emerge and these central circuits can disengage from external dependence. As a result of this internalization process, the body movement and EC-driven Figure 7. Proposed network model of the movement-triggered co-activation of
entorhinal and hippocampal neuronal circuits in the neonatal rat. Spontaneous neonatal movements (twitches and startles) (1) activate sensory feedback (2), which triggers thalamocortical oscillations (EGOs and spindle-bursts) in S1 cortex (3). This information is further transferred to the EC superficial layers where it trig-gers the activity bursts (4). These EC bursts are further conveyed to hippocampus in parallel (i) through the temporoammonic pathway from MEC layer 3 to the dis-tal apical dendrites of CA1 pyramidal cells (5) to generate Sink 2 of the eSPWs in sl-m and (ii) through the perforant path from MEC layer 2 to the dentate gyrus (DG) (6) and CA3 (7). Excitation of CA3 pyramidal cells activates Schaffer collaterals and generates Sink 1 of eSPWs insr (8). Note that sequential activation of various structures in this scheme follows the bottom-up information transfer from the spinal cord to hippocampus. The scheme of entorhinal–hippocampal circuit is adapted from Diba’s site with modifications (http://neuralcircuits.uwm.edu/ neural-circuits-of-the-hippocampus/; last accessed on November 258, 2018).
eSPWs become self-organized SPWs. This ontogenetic para-digm largely recapitulates evolution from simple brains, which are mainly driven, in a reflex manner, by external environmen-tal and body-derived signals to complex cognitive brains endowed with an ability to sustain self-organized, long-lasting neuronal sequences without reliance on external cues and, therefore, to support cognitive operations such as memory, planning, and imagination (Buzsaki et al. 2014).
Supplementary Material
Supplementary material is available atCerebral Cortex online.
Authors
’ Contributions
R.K. and P.P.L.S. designed the research. G.V., S.J., A.N., V.R. and R.M. performed the research. G.V., S.J., A.N., R.K. and P.P.L.S. analyzed the data. G.L.H., R.K. and P.P.L.S. wrote the paper.
Funding
Ministry of Education and Science of the Russian Federation (5-100 to Kazan Federal University, 6.5364.2017/9.10 to G.V., 6.2313.2017/4.6 to A.N., V.R. and R.K.); Russian Foundation for Basic Research (17-04-02083-a to G.V.); National Institutes of Health (R01NS076763 to P.P.L.S. and RO1NS073083 to G.L.H.).
Notes
We thank Drs. J. Csicsvari and X. Leinekugel for their valuable advice through the development of this study, R. Bourboulou, G. Marti and J. Epsztein for their help in Cluster Cutting analysis and Drs. G.Buzsaki, R.Cossart, M. Blumberg, F. Donato and A. Sirota for helpful comments on the manuscript. Part of the results presented in this paper has been published in the thesis of S. Janackova (University Paris Descartes).Conflict of Interest: The authors declare no conflict of interest.
Signi
ficance statement
During development, spontaneous patterns of correlated neu-ronal activity participate in the formation of neuneu-ronal circuits. In the entorhinal–hippocampal circuit, which is critically involved in spatial navigation and learning and memory, sev-eral correlated activity patterns have been separately described in each structure. We found that in neonatal ratsin vivo, activ-ity in the entorhinal–hippocampal circuit is highly synchro-nized, with entorhinal bursts driving early hippocampal sharp waves. Also, entorhinal–hippocampal population discharges were reliably triggered by spontaneous myoclonic body move-ments. Thus, correlated activity in the developing entorhinal– hippocampal network is embedded into a large-scale bottom-up circuit that processes somatosensory feedback resulting from neonatal movements. Such correlated activity likely instructs the development of connections between the neocor-tex and hippocampus.
References
Ackman JB, Burbridge TJ, Crair MC. 2012. Retinal waves coordi-nate patterned activity throughout the developing visual system. Nature. 490:219–225.
Akhmetshina D, Nasretdinov A, Zakharov A, Valeeva G, Khazipov R. 2016. The nature of the sensory input to the neonatal rat barrel cortex. J Neurosci. 36:9922–9932.
Babola TA, Li S, Gribizis A, Lee BJ, Issa JB, Wang HC, Crair MC, Bergles DE. 2018. Homeostatic control of spontaneous activ-ity in the developing auditory system. Neuron. 99:511–524. Basu J, Zaremba JD, Cheung SK, Hitti FL, Zemelman BV,
Losonczy A, Siegelbaum SA. 2016. Gating of hippocampal activity, plasticity, and memory by entorhinal cortex long-range inhibition. Science. 351:aaa5694.
Blankenship AG, Feller MB. 2010. Mechanisms underlying spon-taneous patterned activity in developing neural circuits. Nat Rev Neurosci. 11:18–29.
Buhl DL, Buzsaki G. 2005. Developmental emergence of hippo-campal fast-field “ripple” oscillations in the behaving rat pups. Neuroscience. 134:1423–1430.
Buzsaki G. 2015. Hippocampal sharp wave-ripple: a cognitive biomarker for episodic memory and planning. Hippocampus. 25:1073–1188.
Buzsaki G, Moser EI. 2013. Memory, navigation and theta rhythm in the hippocampal-entorhinal system. Nat Neurosci. 16:130–138.
Buzsaki G, Peyrache A, Kubie J. 2014. Emergence of cognition from action. Cold Spring Harb Symp Quant Biol. 79:41–50. Chattopadhyaya B, Di Cristo G, Higashiyama H, Knott GW,
Kuhlman SJ, Welker E, Huang ZJ. 2004. Experience and activity-dependent maturation of perisomatic GABAergic innervation in primary visual cortex during a postnatal criti-cal period. J Neurosci. 24:9598–9611.
Chrobak JJ, Buzsaki G. 1994. Selective activation of deep layer (V– VI) retrohippocampal cortical neurons during hippocampal sharp waves in the behaving rat. J Neurosci. 14:6160–6170. Chrobak JJ, Lorincz A, Buzsaki G. 2000. Physiological patterns in
the hippocampo-entorhinal cortex system. Hippocampus. 10:457–465.
Colonnese MT, Khazipov R. 2010.“Slow activity transients” in infant rat visual cortex: a spreading synchronous oscillation patterned by retinal waves. J Neurosci. 30:4325–4337. Colonnese M, Khazipov R. 2012. Spontaneous activity in
devel-oping sensory circuits: Implications for resting state fMRI. Neuroimage. 62:2212–2221.
Csicsvari J, Hirase H, Czurko A, Mamiya A, Buzsaki G. 1999. Oscillatory coupling of hippocampal pyramidal cells and interneurons in the behaving Rat. J Neurosci. 19:274–287. Csicsvari J, Hirase H, Mamiya A, Buzsaki G. 2000. Ensemble
pat-terns of hippocampal CA3–CA1 neurons during sharp wave-associated population events. Neuron. 28:585–594.
Daw MI, Ashby MC, Isaac JT. 2007. Coordinated developmental recruitment of latent fast spiking interneurons in layer IV barrel cortex. Nat Neurosci. 10:453–461.
Deng JB, Yu DM, Li MS. 2006. Formation of the entorhino-hippocampal pathway: a tracing study in vitro and in vivo. Neurosci Bull. 22:305–314.
Doischer D, Hosp JA, Yanagawa Y, Obata K, Jonas P, Vida I, Bartos M. 2008. Postnatal differentiation of basket cells from slow to fast signaling devices. J Neurosci. 28:12956–12968. Donato F, Jacobsen RI, Moser MB, Moser EI. 2017. Stellate cells
drive maturation of the entorhinal–hippocampal circuit. Science. 355:eaai8178.
Du J, Zhang L, Weiser M, Rudy B, McBain CJ. 1996. Developmental expression and functional characterization of the potassium-channel subunit Kv3.1b in parvalbumin-containing interneur-ons of the rat hippocampus. J Neurosci. 16:506–518.
Fernandez-Ruiz A, Oliva A, Nagy GA, Maurer AP, Berenyi A, Buzsaki G. 2017. Entorhinal-CA3 dual-input control of spike timing in the hippocampus by theta-gamma coupling. Neuron. 93:1213–1226.
Freeman JA, Nicholson C. 1975. Experimental optimization of current source-density technique for anuran cerebellum. J Neurophysiol. 38:369–382.
Freund TF, Buzsaki G. 1996. Interneurons of the hippocampus. Hippocampus. 6:347–470.
Goldberg EM, Jeong HY, Kruglikov I, Tremblay R, Lazarenko RM, Rudy B. 2011. Rapid developmental maturation of neocorti-cal FS cell intrinsic excitability. Cereb Cortex. 21:666–682. Gomez-Di CC, Smith KL, Rice FL, Swann JW. 1997. Axonal
remo-deling during postnatal maturation of CA3 hippocampal pyramidal neurons. J Comp Neurol. 384:165–180.
Hanganu IL, Ben Ari Y, Khazipov R. 2006. Retinal waves trigger spindle bursts in the neonatal rat visual cortex. J Neurosci. 26:6728–6736.
Hanganu IL, Staiger JF, Ben Ari Y, Khazipov R. 2007. Cholinergic modulation of spindle bursts in the neonatal rat visual cor-tex in vivo. J Neurosci. 27:5694–5705.
Hanganu-Opatz IL. 2010. Between molecules and experience: role of early patterns of coordinated activity for the develop-ment of cortical maps and sensory abilities. Brain Res Rev. 64:160–176.
Huang ZJ, Di Cristo G, Ango F. 2007. Development of GABA innervation in the cerebral and cerebellar cortices. Nat Rev Neurosci. 8:673–686.
Inacio AR, Nasretdinov A, Lebedeva J, Khazipov R. 2016. Sensory feedback synchronizes motor and sensory neuronal networks in the neonatal rat spinal cord. Nat Commun. 7:13060. Isomura Y, Sirota A, Ozen S, Montgomery S, Mizuseki K, Henze
DA, Buzsaki G. 2006. Integration and segregation of activity in entorhinal–hippocampal subregions by neocortical slow oscillations. Neuron. 52:871–882.
Kadir SN, Goodman DF, Harris KD. 2014. High-dimensional clus-ter analysis with the masked EM algorithm. Neural Comput. 26:2379–2394.
Karlsson KA, Mohns EJ, di Prisco GV, Blumberg MS. 2006. On the co-occurrence of startles and hippocampal sharp waves in newborn rats. Hippocampus. 16:959–965.
Khalilov I, Dzhala V, Medina I, Leinekugel X, Melyan Z, Lamsa K, Khazipov R, Ben-Ari Y. 1999. Maturation of kainate-induced epileptiform activities in interconnected intact neo-natal limbic structures in vitro. Eur J Neurosci. 11:3468–3480. Khazipov R, Khalilov I, Tyzio R, Morozova E, Ben Ari Y, Holmes
GL. 2004a. Developmental changes in GABAergic actions and seizure susceptibility in the rat hippocampus. Eur J Neurosci. 19:590–600.
Khazipov R, Minlebaev M, Valeeva G. 2013. Early gamma oscilla-tions. Neuroscience. 250:240–252.
Khazipov R, Sirota A, Leinekugel X, Holmes GL, Ben Ari Y, Buzsaki G. 2004b. Early motor activity drives spindle bursts in the developing somatosensory cortex. Nature. 432: 758–761.
Khazipov R, Zaynutdinova D, Ogievetsky E, Valeeva G, Mitrukhina O, Manent JB, Represa A. 2015. Atlas of the post-natal rat brain in stereotaxic coordinates. Front Neuroanat. 9:161. 10.3389/fnana.2015.00161.
Klausberger T, Somogyi P. 2008. Neuronal diversity and tempo-ral dynamics: the unity of hippocampal circuit operations. Science. 321:53–57.
Le Magueresse C, Monyer H. 2013. GABAergic interneurons shape the functional maturation of the cortex. Neuron. 77: 388–405.
Leinekugel X, Khazipov R, Cannon R, Hirase H, Ben Ari Y, Buzsaki G. 2002. Correlated bursts of activity in the neonatal hippocampus in vivo. Science. 296:2049–2052.
Luhmann HJ, Khazipov R. 2018. Neuronal activity patterns in the developing barrel cortex. Neuroscience. 368:256–267. Marguet SL, Marguet SL, Le-Schulte VT, Merseburg A, Neu A,
Eichler R, Jakovcevski I, Ivanov A, Hanganu-Opatz IL, Bernard C, et al. 2015. Treatment during a vulnerable devel-opmental period rescues a genetic epilepsy. Nat Med. 21: 1436–1444.
Melzer S, Michael M, Caputi A, Eliava M, Fuchs EC, Whittington MA, Monyer H. 2012. Long-range-projecting GABAergic neu-rons modulate inhibition in hippocampus and entorhinal cortex. Science. 335:1506–1510.
Mizuseki K, Sirota A, Pastalkova E, Buzsaki G. 2009. Theta oscil-lations provide temporal windows for local circuit computa-tion in the entorhinal-hippocampal loop. Neuron. 64: 267–280.
Mohns EJ, Blumberg MS. 2008. Synchronous bursts of neuronal activity in the developing hippocampus: modulation by active sleep and association with emerging gamma and theta rhythms. J Neurosci. 28:10134–10144.
Mohns EJ, Blumberg MS. 2010. Neocortical activation of the hip-pocampus during sleep in infant rats. J Neurosci. 30: 3438–3449.
Mohns EJ, Karlsson KA, Blumberg MS. 2007. Developmental emergence of transient and persistent hippocampal events and oscillations and their association with infant seizure susceptibility. Eur J Neurosci. 26:2719–2730.
Moser MB, Rowland DC, Moser EI. 2015. Place cells, grid cells, and memory. Cold Spring Harbor Perspect Biol. 7. pii: a021808.
Namiki S, Norimoto H, Kobayashi C, Nakatani K, Matsuki N, Ikegaya Y. 2013. Layer III neurons control synchronized waves in the immature cerebral cortex. J Neurosci. 33: 987–1001.
Okaty BW, Miller MN, Sugino K, Hempel CM, Nelson SB. 2009. Transcriptional and electrophysiological maturation of neo-cortical fast-spiking GABAergic interneurons. J Neurosci. 29: 7040–7052.
Oliva A, Fernandez-Ruiz A, Buzsaki G, Berenyi A. 2016. Role of hippocampal CA2 region in triggering sharp-wave ripples. Neuron. 91:1342–1355.
Pangratz-Fuehrer S, Hestrin S. 2011. Synaptogenesis of electri-cal and GABAergic synapses of fast-spiking inhibitory neu-rons in the neocortex. J Neurosci. 31:10767–10775.
Pennartz CM, Lee E, Verheul J, Lipa P, Barnes CA, McNaughton BL. 2004. The ventral striatum in off-line processing: ensem-ble reactivation during sleep and modulation by hippocam-pal ripples. J Neurosci. 24:6446–6456.
Petersson P, Waldenstrom A, Fahraeus C, Schouenborg J. 2003. Spontaneous muscle twitches during sleep guide spinal self-organization. Nature. 424:72–75.
Robinson SR, Blumberg MS, Lane MS, Kreber LA. 2000. Spontaneous motor activity in fetal and infant rats is organized into discrete multilimb bouts. Behav Neurosci. 114:328–336. Rossant C, Rossant C, Kadir SN, Goodman DF, Schulman J,
Hunter ML, Saleem AB, Grosmark A, Belluscio M, Denfield GH, et al. 2016. Spike sorting for large, dense electrode arrays. Nat Neurosci. 19:634–641.
Roth FC, Beyer KM, Both M, Draguhn A, Egorov AV. 2016. Downstream effects of hippocampal sharp wave ripple oscillations on medial entorhinal cortex layer V neurons in vitro. Hippocampus. 26:1493–1508.
Schmitzer-Torbert N, Jackson J, Henze D, Harris K, Redish AD. 2005. Quantitative measures of cluster quality for use in extracellular recordings. Neuroscience. 131:1–11.