Palestinian Public Perceptions
on Their Living Conditions
The Role of International and Local Aid
during the second Intifada
Report V, December 2002
Riccardo BOCCO
Matthias BRUNNER
Isabelle DANEELS
Frédéric LAPEYRE
Jamil RABAH
IUED - Graduate Institute of Development Studies, University of Geneva
A study funded by
SDC - Swiss Agency for Development and Cooperation, UNDP, UNICEF,
UNRWA and the UN World Food Program
INTERNATIONAL AND LOCAL AID
DURING THE SECOND INTIFADA
Report V
An Analysis of Palestinian Public Opinion
in the West Bank and the Gaza Strip
on their Living Conditions
(July – November 2002)
The poll has been conducted in cooperation with the
JMCC, Jerusalem Media and Communication Centre
Geneva, December 2002
Cover photo:
Palestinian Woman outside her house in Bethlehem, Fall 2002 Source: http://www.palestinemonitor.org
FOREWORD AND ACKNOWLEDGEMENTS
This study is the 5th report conducted by the Graduate Institute of Development Studies (IUED) of the University of Geneva since the beginning of the Intifada al-Aqsa in September 2000, on the impact of local and international aid on the living conditions of the civilian population in the Occupied Palestinian Territories (OPT). The SDC (Swiss Agency for Development and Cooperation), who has been supporting the reports since its inception, has been joined by several UN Agencies (UNDP, UNRWA, UNICEF and WFP) to co-fund this report.
The period under scrutiny in this report covers the second half of the year 2002. During this same period, a number of international organisations, NGOs, private and public local research centres, and Palestinian Authority institutions have been publishing several important reports on topics that complement the data of our survey. Due to time constraints, this time we have not been able to produce a proper synthesis of this literature, as we did in our previous reports. However, at the end of this report we have included several references that the reader can consult easily, since most of the bibliographical items are available on the internet.
The references selected allow for weighing the Palestinian public opinion (Birzeit University 2002a, 2002b; IPCRI 2002; JMCC 2002a, 2002b; PSR 2002a, 2002b);, the Israeli public opinion (La Paix Maintenant 2002), or both (Search for Common Ground 2002) on issues related to the crisis, to the role and impact of the suicide bombers and the Israeli military strategies, to the Jewish settlers' in the OPT, to the reform of Palestinian institutions, to the role of international mediators and the possibility of resuming negotiations.
Other reports document the humanitarian laws' breaches in the OPT (Amnesty International 2002; B'Tselem 2002b, 2002c; Halper 2002), the restrictions on press freedoms (Deguine 2002; Miftah 2002), the security conditions of the civilian population (Bertini 2002; Halileh 2002; HIC-OPT 2002c; OCHA-OPT 2002a, 2002b), the growth of poverty (The Palestine Monitor 2002b; Sa'ad 2002; UNDP 2002) the access to education and health (CPT, EAPPI, QPSW, UCP 2002; Giacaman et al. 2002; HIC-OPT 2002b; PCBS 2002; USAID 2002); the impact of the Israeli closures' policies on the Palestinian economy and the living conditions of the civilian population (ARIJ 2002; B'Tselem 2002a; UNSCO 2002).
Furthermore, while some studies assess the impact and damages of the Israeli military occupation (HIC-OPT 2002a; Deconinck 2002; The Palestine Monitor 2002a), other reports allow for following up the analyses and plans of action of the UN Agencies in the field (United Nations 2002; UNRWA 2002a, 2002b, 2002c). Finally, a number of qualitative studies analyse more in-depth the coping strategies of the Palestinian rural populations under occupation (Oxfam 2002), the need for psychological support for the Palestinian population (Salignon et al. 2002; Lachal & Moro 2002) the impact of the Palestinian suicide bombers in Israel (Human Rights Watch 2002; Meldrum 2002).
As usual, during the phase of preparation of the questionnaire, the team discussed the content of the new poll with the different stakeholders. Because of the situation prevailing in the OPT, this time the scope of the questionnaire has been expanded to
include a substantive number of questions that could offer more specific data on poverty, food and children. In this regard, it is the aim of this study to be of use to the Palestinian authority, many UN and other international agencies, as well as local NGOs. The findings provide a wider picture of Palestinian public perceptions on their living conditions. For the survey conducted for this report a sample of was utilised. The IUED assigned a small team of experts for the project, composed of Dr. Riccardo Bocco (professor of political sociology and research director at the IUED) as team leader, Mr. Matthias Brunner (lecturer on polls' methodology at the Department of Political Science, University of Geneva), Dr. Isabelle Daneels (political scientist and associate researcher at the IUED), Dr. Frédéric Lapeyre (professor of economy at the Institute of Development Studies, University of Lovanium, Belgium) and Mr. Jamil Rabah (poll specialist and consultant for the SDC Gaza and West Bank Office). The poll's questionnaire (see Annex I for the English version and Annex II for the Arabic version) was drafted by the above-mentioned experts' team and reviewed by a number of stakeholders who pointed out variables pertinent to drawing an objective assessment of the needs and living conditions of the Palestinian population in the West Bank and the Gaza Strip. We are particularly grateful to Mrs Diane Pezzini (Programme Officer, UNICEF, Jerusalem), Mrs Monica Awwad (UNICEF, Jerusalem), Mr. Sami Mushasha (Public Information Officer, UNRWA), Dr. Elena Mancusi (Programme Officer, UNRWA), Mr. Sufyian Mushasha (UNDP, Jerusalem), Mr. Guy Siri (Deputy Director of UNRWA Operations & Field Technical Officer, West Bank Field Office, Jerusalem), Mr. Fritz Froehlich (deputy director, of the SDC Gaza and West Bank Office), Dr. Rémy Leveau (professor of Political Science, Institut Français de Relations Internationales, Paris), and Dr. Elia Zureik (professor of sociology at Queen's University, Kingston, Canada).
The IUED subcontracted the JMCC (Jerusalem Media and Communication Centre) for conducting the poll in early November 2002. More than 60 fieldworkers interviewed 1377 people, under the supervision of Mrs Manal Warrad and Mr. Khader Abu Sway .
The team work was conducted between Geneva, Bruges, Jerusalem and Ramallah. We are particularly grateful to the "anonymous" JMCC Palestinian fieldworkers: without their contribution this study could not be written. In Geneva, Mrs Sandra Cavaliere worked hours in data cleaning, preparatory data analysis and research. The data for this report were collected by the JMCC, while the data cleaning, weighting and interpretation are the sole responsibility of the authors of this report.
LIST OF ACRONYMS
ARIJ Applied Research Institute in JerusalemEGP Employment Generation Programmes
GS The Gaza Strip
GSRC Gaza Strip refugee camps
HDIP Health Development Information Project
IDF Israeli Defence Forces
IUED (French acronym for) Graduate Institute of Development Studies,
University of Geneva
JMCC Jerusalem Media and Communications Centre
MIFTAH Palestinian Initiative for Global Dialogue and Democracy
MOPIC Ministry of Planning and International Cooperation, PNA
NIS New Israeli Shekel
OAPT Occupied and Autonomous Palestinian Territories
OCHA UN Office for the Coordination for the Humanitarian Affairs
OPT Occupied Palestinian Territories
PCBS Palestinian Central Bureau of Statistics
PECDAR Palestinian Economic Council for Development and Reconstruction
PNA Palestinian National Authority
PRCS Palestine Red Crescent Society
SDC Swiss Agency for Development and Cooperation
UNESCO United Nations Education, Science, and Culture
Organization
UNICEF United Nations Children and Education Fund
UNRWA United Nations Relief and Works Agency for the
Palestine Refugees in the Near East
UNSCO United Nations Special Coordinator’s Office in Palestine
UNWFP United Nations World Food Program
WB The West Bank
TABLE OF CONTENTS
FOREWORD AND ACKNOWLEDGEMENTS ... 3
LIST OF ACRONYMS ... 5
TABLE OF CONTENTS ... 6
OBJECTIVES AND METHODOLOGY... 8
OBJECTIVES... 8
METHODOLOGY... 9
DESCRIPTION OF THE EXPLANATORY VARIABLES... 10
PART 1. SOCIO-ECONOMIC CONDITIONS... 12
1.1.GENERAL OVERVIEW OF THE SOCIO-ECONOMIC SITUATION... 12
1.2.THE NATURE AND EVOLUTION OF POVERTY... 14
1.2.1. Evolution in household income ... 14
1.2.2. The extent of material deprivation... 16
1.2.3. Subjective financial satisfaction poverty line ... 21
1.2.4. Subjective well-being and factors affecting it ... 25
1.3.THE EVOLUTION OF THE LABOR MARKET... 29
1.3.1. The employment status ... 29
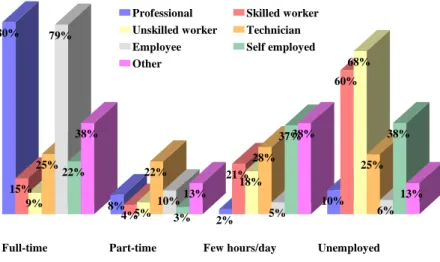
1.3.2. Type of employer and work occupation ... 35
1.3.3. Employment and poverty risks ... 38
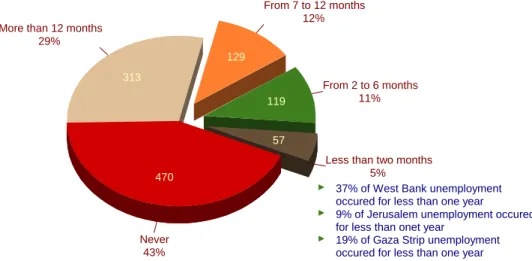
1.3.4. The dynamic of unemployment over the past six months... 40
1.4.GROWING POVERTY AND VULNERABILITY: THE LIMITS OF COPING STRATEGIES... 44
1.4.1. Evolution of daily expenses... 45
1.4.2. Strategies for managing the hardship ... 46
1.4.3. Strategies pertaining to the labor market ... 47
PART 2. FOOD ... 50
2.1.NEED FOR FOOD... 50
2.1.1. Change in household food consumption... 51
2.1.2. The most needed food items in the household ... 52
2.2.SOURCE OF FOOD... 54
2.3.FOOD DISTRIBUTION... 55
2.3.1. Food recipients... 55
2.3.2. Source of food assistance ... 59
2.3.3. Types of provided food assistance... 60
2.3.4. Frequency of food assistance ... 61
2.4.VALUE OF FOOD ASSISTANCE... 61
PART 3. HEALTH AND EDUCATION ... 63
3.1.HEALTH AND EDUCATION IN GENERAL... 63
3.2.HEALTH... 67
3.2.1. Medical care ... 70
3.2.2. Health coverage ... 74
3.3.EDUCATION... 78
3.3.1. The overall situation ... 81
3.3.2. Educational attainment according to place of residence... 81
3.3.3. Education and place of work ... 82
3.3.4. Education and income... 84
PART 4. WOMEN AND CHILDREN... 86
4.1.IMPACT OF THE INTIFADA ON WOMEN... 86
4.1.1. In general ... 86
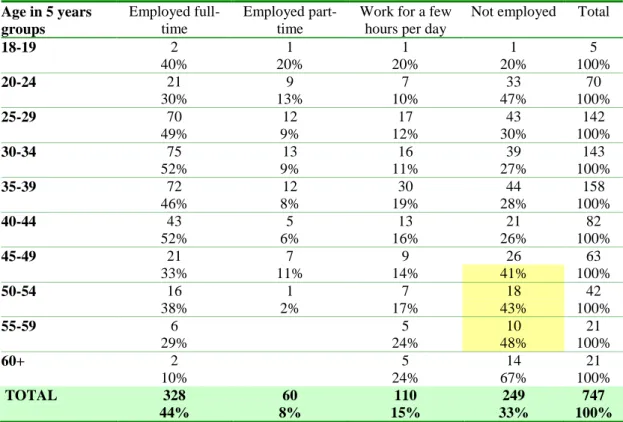
4.1.2. Women and employment ... 89
4.2.IMPACT OF THE INTIFADA ON CHILDREN... 94
4.2.1. Children and employment ... 94
4.2.2. Children and education ... 96
4.2.3. Children and the Intifada ... 97
4.2.4. Children and parental behavior ... 100
4.3.CONCLUSION... 103
PART 5. ASSISTANCE DELIVERED IN GENERAL ... 104
5.1.DISTRIBUTION OF ASSISTANCE... 104
5.2.TYPES OF ASSISTANCE:FOOD,FINANCIAL AND COUPONS... 108
5.3.VALUE OF ASSISTANCE... 111
5.4.SOURCE OF ASSISTANCE... 113
5.5.EMPLOYMENT ASSISTANCE... 116
PART 6. UNRWA ... 119
6.1.THE DISTRIBUTION OF REFUGEES IN THE SAMPLE... 119
6.2.UNRWA ASSISTANCE... 120
6.2.1. Assistance according to refugee status ... 120
6.2.2. Assistance according to place and area of residence... 121
6.2.3. Assistance according to poverty ... 124
6.3.TYPES OF ASSISTANCE DELIVERED... 126
6.3.1. Food assistance ... 127
6.3.2. Financial and employment assistance ... 128
6.3.3. Education and Health ... 128
6.3.4. Other services ... 131
6.4.VALUE OF ASSISTANCE... 131
6.5.SATISFACTION WITH UNRWA’S SERVICES... 132
6.6.IMPORTANCE AND EFFECTIVENESS OF UNRWA SERVICES... 134
PART 7. THE IMPACT OF AID AND PALESTINIANS’ PERCEPTIONS... 136
7.1.INDIVIDUAL NEEDS FOR ASSISTANCE... 136
7.2.COMMUNITY NEEDS FROM PALESTINIANS’ POINT OF VIEW... 138
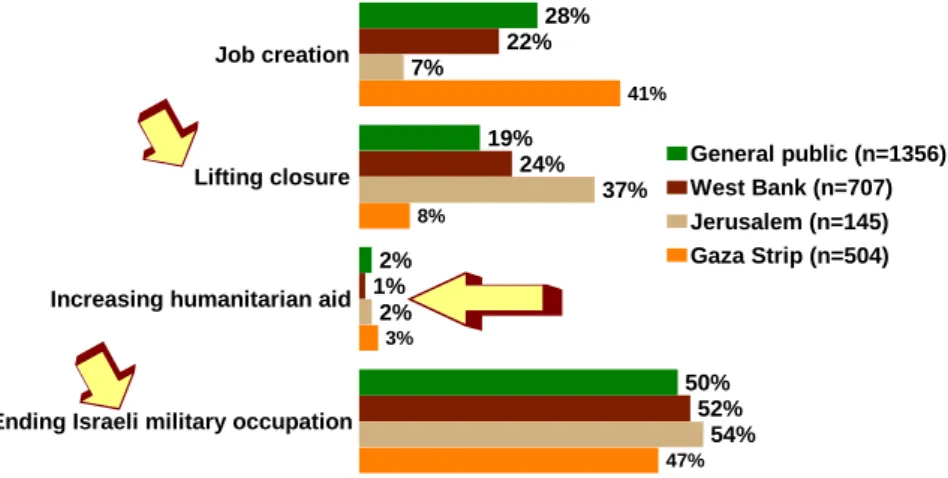
7.3.ASSISTANCE PRIORITIES FROM PALESTINIANS’ POINT OF VIEW... 140
7.4.SATISFACTION WITH THE PROVIDED ASSISTANCE... 141
7.5.IMPACT OF ASSISTANCE FROM PALESTINIANS’ POINT OF VIEW... 145
REFERENCES ... 148
LIST OF TABLES ... 152
LIST OF FIGURES ... 153
ANNEX I : COPY OF THE QUESTIONNNAIRE IN ARABIC ... 157
ANNEX II: COPY OF THE QUESTIONNAIRE IN ENGLISH ... 173
OBJECTIVES AND METHODOLOGY
Objectives
The questionnaire for the study (see Annex I and II) was elaborated in a way that could offer data on Palestinians in the West Bank and the Gaza Strip on seven main topics that correspond to the seven parts of the report:
A portrait of the socio-economic conditions for assessing change in the evolution of poverty (poverty according to household size, evolution of household income, material deprivation and subjective well-being). The labor market and employment situation (including the place of work, occupation and the effects of the Intifada on jobs) are also under scrutiny, as well as the coping strategies of the Palestinian population (including the evolution of the households’ expenses; the nature of the expenses that were cut; the strategies for managing the hardship; the coping mechanisms for the future).
Part 1. Socio-economic Conditions
Several questions pertain to food. They cover perceived effectiveness of food distribution, type and source of food assistance provided, changes in food consumption patterns and types of food required.
Part 2. Food
Additional questions relate to health and education. They concern assistance received, priorities, access to basic services and educational attainment.
Part 3. Health and Education
Other questions concern Women and Children. The effect of the Intifada on children, parents’ responses, psychological support, children’s work and women’s contribution to the household’s income are investigated in this part.
Part 4. Women and Children
An overview of the assistance delivered according to type, value and source with emphasis on employment generation programs.
Part 5. Assistance Delivered in General
An assessment of UNRWA’s strategies during the past months, the type of assistance provided by the UN Agency (in particular food aid, employment generation and financial assistance), the patterns of aid distribution and its
effectiveness, as well as the satisfaction of its beneficiaries.
Part 6. UNRWA
Finally, as usual, a review of the impact of the assistance delivered for measuring the perceptions of the Palestinians is provided. This part includes an analysis of the people’s perceptions on individual and community assistance, aid priorities as well as the visibility, importance and effectiveness of the assistance delivered.
Part 7. The Impact of Aid and Palestinians’ Perception
A representative sample of 1,377 Palestinians over the age of 18 was interviewed face-to-face in early November 2002. In the West Bank (including East Jerusalem) 870 Palestinians were interviewed, and 507 were interviewed in the Gaza Strip. The sampling and data collection was done in the same way as for the previous polls (Bocco, Brunner and Rabah 2001a and 2001b; Bocco, Brunner, Daneels and Rabah 2001).1 However, this time, there was no over-sampling of the Gaza Strip refugee camps.
Methodology
In order to indicate the extent to which the data collected were representative, a full comparison of the results with some available official figures was made in two of our previous reports (Bocco, Brunner and Rabah, 2001a: 5-6 and 2001b: 12-15). These reports are available on the website of the IUED (the Graduate Institute of
Development Studies of the University of Geneva: www.iued.unige.ch). Such type of
analysis is not considered here due to the length of the report.
Although each part of this report has its own logic of analysis, all the questions of the poll that were analysed in this report were tested in their relationship with four important explanatory variables:
1
The April 2002 poll was though different in this regard because the situation forced us to interview the sample by phone (see Bocco, Brunner, Daneels and Rabah 2002).
Place of residence:
a) West Bank refugee camps b) West Bank outside camps c) Gaza Strip refugee camps d) Gaza Strip outside camps e) East Jerusalem Refugee Status: a) Refugees b) Non-refugees Area of residence: a) Cities b) Villages c) Refugee camps
Poverty (controlled by household size):
a) Those above the poverty line with a household income of NIS1600 or more.
b) Those below the poverty line with a household income of less than NIS
1600 but more than NIS 500.
Results were systematically tested for statistical significance at a 95% confidence
level.2 If no differentiation is shown or mentioned, this means that there was none.
Finally, whenever possible, consideration was given to data generated from studies and surveys that were made available recently and that cover the same period of time on some issues addressed in this report. We also compared our data with the findings presented in the previous reports to highlight the evolution of the situation since the beginning of the Second Intifada.
Description of the explanatory variables
Palestinian society is unique because refugees constitute up to 50% of its population. The territory is split between areas that are not geographically contiguous and this separation between the West Bank and the Gaza Strip renders coordination and economic cooperation very difficult. This situation enforces a set of legal and socio-economic structures that are not homogenous. The split between the two areas and the forced detachment of Jerusalem from them further complicates efforts at obtaining a uniform system that is essential and a prerequisite for developing a viable and efficient economic, social, and political system. In addition to the damaging consequences of the occupation, other social and internal barriers such as a very large population growth rate (around 6%) and a large number of dependent children (almost 50% are below the age of fifteen) supplement the political detriments that characterise and influence the living conditions of Palestinians in the West Bank and the Gaza Strip.
Figure 0.1 Place of Residence
The intended goal of the analysis in this report by the four explanatory variables is
to reflect the specificities of the
Palestinian population. The Palestinians in the OAPT are divided in three different areas: the West Bank, Jerusalem, and the Gaza Strip. Place of residence, as shown in figure 0.1, summarizes these different geographical areas. Of the entire data, 64% of the respondents are from the West Bank and Jerusalem and 37% are from the Gaza Strip.
According to the PCBS, approximately 2 million Palestinians live in the West Bank and Jerusalem, and about one million in the Gaza Strip. Refugees constitute about one third of the West Bank population and over 60% of the population in the Gaza Strip. The number of refugees residing in camps is estimated at approximately half a million of which about 130,000 live in 19 refugee camps in the West Bank, and about 370,000 reside in 8 refugee camps in the Gaza Strip.
2
For categorical or ordinal dependent variables we used Chi-square tests, for interval variables one-way analysis of variance.
West Bank 48% WBRC 5% Jerusalem 11%
The Gaza Strip 25% GSRC 12% N=657 N=64 N=149 N=344 N=163
Figure 0.2 Refugee status
As shown in figure 0.2, of all respondents, 51% said that they are refugees or descendents of refugees; of those, 49% are registered while 2% are not.
Throughout Palestine, the majority of refugees (registered and unregistered) live in the Gaza Strip (48%, see figure 0.3). On the opposite, almost two thirds (65%) of non refugees live in the West Bank. While 31% of all refugees live in camps, less than 1% of non refugees do. In both groups, on respondent out of ten lives in Jerusalem.
Figure 0.3 Place of Residence by Refugee Status
64% 1% 10% 24% 0% 34% 8% 10% 25% 23%
West Bank WBRC Jerusalem The Gaza Strip GSRC 0% 10% 20% 30% 40% 50% 60% 70%
Non refugees Refugees
According to area of residence, a bit more than one half of our sample (52%, N=722) lived in cities, 17% (N=229) in refugee camps and 31% in villages (N=426).
In the November 2001 report, we introduced the poverty variable to highlight the economic situation of the Palestinian households. Based on a question about household revenue, we split the respondents into three groups: Those above poverty line (NIS 1600 according to PCBS), those below it and the hardship cases which have a household revenue of NIS 500 or less.
One weakness of this variable resides in the fact that it does not take household size into account: A monthly income of NIS 500 is not the same for the average household of two adults and four children and for a single person household.
In the present report, we took household size and composition into consideration: Departing from the fact that the NIS 1600 and NIS 500 thresholds are defined for an average household of two adults and four children, we calculated those thresholds for each family composition. This new poverty variable will be analysed more thoroughly in section 1.2.2 related to “The extent of material deprivation” (pp.17-22).
49% 2% 49% N=653 N=33 N=651 Registered refugees Non-registered refugees Non refugees
PART 1. SOCIO-ECONOMIC CONDITIONS
The results of the survey conducted for this report show that the socio-economic conditions of the Palestinian people have continued to deteriorate sharply in the past 12 months. In the first section of this part, the focus will be on the evolution of poverty from an objective and subjective perspective; furthermore an assessment will be provided of the impact of the large-scale impoverishment process on people's perception of both their situation and the current situation in general. In the second section, the evolution of the labor market, the problems of access to decent jobs and their impact on people's well-being will be highlighted. Finally, in the third section, the main emphasis will be on the utilized coping strategies of Palestinian households in a context of growing poverty and vulnerability. First, however, it is necessary to give a general overview of the socio-economic situation in order to provide a framework for the analysis of this part of the report.
1.1. General overview of the socio-economic situation
The human and economic situation in the West Bank and the Gaza Strip has deteriorated considerably during the past six months. In Spring 2002, the Israeli military forces re-occupied West Bank cities and towns and most them are now under the direct control of the Israeli Army. Starting 29 March 2002, Israel military intervention brought unprecedented curfew and closure (Bocco, Brunner, Daneels and Rabah 2002). Israel had first imposed external and internal closures when the situation started to deteriorate in late September 2000, but steadily tightened them after April 2002. Curfews have been imposed in most major cities and towns of the West Bank (and some areas of the Gaza Strip). The curfew regime has changed several times since its implementation, but in mid-August 2002, for example, a total of 55 localities in the West Bank were under total or partial curfew (Bertini 2002:5). As a result of all these different measures of mobility restriction for goods and people, most of the productive activities in the West Bank have collapsed and many sectors have almost stopped to operate.
External and internal closures have also increased travel time and distance and in the same time the cost for commercial transportation. They are especially an urgent problem for perishable goods. UNSCO estimates that the total income losses in the first half of 2002 alone are more than $1 billion, with losses since September 2000 estimated at $3.3 billion (UNSCO 2002:2). The survey is not taking into account the impact of closure and confrontations on the 2002 olive-harvesting season. If it is a bad season (as is likely taking into account mobility restrictions, recurrent attacks from the settlers and large scale tree destruction), it will have a strong negative impact on the Palestinian economy, because it is a crucial economic activity as one quarter of the Palestinian agriculture sector is dedicated to olive production.
Therefore in a period of two years, the Palestinian economy passed from a process of economic recovery to a process of de-development characterized by the decline of private investment, the fall of production, the collapse of the private sector and a sharp decline of all economic activities. Indeed, in 1998 and 1999, the Palestinian economy enjoyed good growth performance with a Gross National Income (GNI) per capita estimated to have grown from $1707 to $1966 between 1997 and 1999. The
spiral of confrontation initiated in September 2000 and Israeli measures have led to both the breakdown of the Palestinian economy and a large-scale process of impoverishment characterized by a decline of 12% of the real GNI per capita in 2000 and by a further decline of 19% in 2001 - and this trend has continued in 2002 (UNCTAD 2002:5). Moreover, the high degree of uncertainty generated by the Israeli military occupation, damage and destruction to physical private and public infrastructure and severe closure have created an environment that is extremely business unfriendly. This situation explains why there are almost no new investments in productive activities since September 2000.
Problems of access to the domestic and export markets, increasing transportation costs, shortage of raw material, inability to run business or for the workers to have access to their work place and the sharp contraction of the domestic demands have all contributed to a deepening economic crisis in the occupied Palestinian territory. As illustrated in figure 1.1, below, 67% of the respondents stated that their business had suffered in the past six months. More than 60% specified that their business had suffered because they had been unable to reach their place of work, others said that their business suffered as a result of their inability to market products (55%) or their inability to work because of imposed curfews (55%). Still others indicated that their business had suffered in the past six months as a result of difficulties in purchasing raw material (47%) or because their inability to pay bank loans (28%). It is worth noting though, that despite the current destructive business environment, international aid continues to play a great role in keeping alive some economic activities in the West Bank and the Gaza Strip.
Figure 1.1 Impact on business in the past 6 months
67% 55% 47% 61% 28% 55% Business suffered
Inability to market products
Difficulties in purchasing raw material
Difficulty to reach the workplace
Inability to pay bank loans
Inability to work because of curfew
WBGS*
73% of the Jerusalem respondents said that their business has suffered
*EXCLUDING JERUSALEM
The socio-economic situation is especially discouraging when compared to the period prior to the outbreak of the second Intifada. It is marked by an increase in unemployment and poverty, and a decrease in wage levels and economic growth. As such, closures and curfews are having a devastating impact on the Palestinian population both from an economic point of view (inability to go to work or run business) and from a human point of view (strong feeling of humiliation).
Since the autumn of 2000, the poverty rate has reached a record level leading to a critical situation of mass poverty. The World Bank estimated that the ratio of the population living below the poverty rate increased from 21% in September 2000 to
33% by January 2001 (World Bank 2002:31). By January 2002, the PCBS estimated this ratio to be 66% (PCBS 2002a:8). This process of mass poverty is particularly dramatic in light of the fact that poverty had decreased in the period prior to September 2000, falling from 24% to 20% between 1996 and 1998 (Birzeit 2002a). Given the current very high level of poverty and extreme poverty, the continuation of the Israeli curfew and closure policy is leading to a dramatic humanitarian crisis as coping strategies are almost exhausted. The sharp increase of poverty is responsible for the growing level of malnutrition. Indeed, some 1.5 million Palestinian (nearly half the total population) receive now direct food assistance, which is five times more than two years ago (Bertini 2002:2).
Unemployment, the inability of workers to go to their workplace on a regular basis or the loss of work hours resulting from the increased travel time even for short distances are the main determinants of the sharp increase of poverty. Many of the workers have been confined to their place of residence and lost their main source of income. The collapse of the Palestinian economy led also to a rapid deterioration of the labor market. The unemployment rate according to the ILO standard increased from 10% mid-2000 to 26% at the end of 2001 (ILO 2002:11). The last PCBS labor force survey estimated that the unemployment rate increased from 33.6% in the second quarter of 2002 to 41.5% in the third quarter of 2002 (PCBS 2002b:1).
If conditions have worsened considerably for the larger part of the population, certainly some among them are in a particularly vulnerable situation. The mainstream poverty profile would be a young resident from the Gaza Strip and, in particular, from the Gaza refugee camps, unemployed or underemployed with a low skill/education level who would be member of a large size family. The current material deprivation dynamic tends to increase sharply the economic vulnerability, unemployment and poverty of the West Bank residents, especially among those residing in refugee camps, who are converging towards the same level of mass poverty as the residents of the Gaza Strip. It is worth mentioning that the vulnerable groups in the West Bank have the same characteristics as those in the Gaza Strip.
1.2. The nature and evolution of poverty
1.2.1. Evolution in household incomeHousehold income distribution has changed very significantly in the period between November 2001 and November 2002. Indeed, as indicated in table 1.1, below, whereas in November 2001, 40% of the Palestinian households had a monthly income that was lower than NIS 1600, this is the case for 56% of the households in November 2002. As will be discussed in greater detail below, this evolution translates into growing household income insecurity resulting for the greatest part from mass unemployment and working hour loss. Also apparent from the results in table 1.1, is that the current situation has hit the medium income households very hard, increasing their level of vulnerability. Whereas in November 2001, 48% of the households had an income ranging between NIS 1600-3000, in November 2002, merely 33% of the respondents are classified under this category.
Table 1.1 Household income evolution, November 2001 – November 2002
Frequency Valid % Cumulative % Frequency Valid % Cumulative %
Income November 2002 November 2001
Over NIS 5000 49 4% 4% 18 1% 1%
Between NIS 3000 - 5000 106 8% 12% 174 11% 13%
Between NIS 2000 - 3000 195 15% 27% 440 29% 41%
Between NIS 1600 - 2000 239 18% 45% 295 19% 60%
Between NIS 500 - 1600 550 42% 86% 428 28% 88%
Less than NIS 500 182 14% 100 % 182 12% 100%
Total 1321 100% 1537 100%
When examining household income distribution according to place of residence, two main findings stand out.
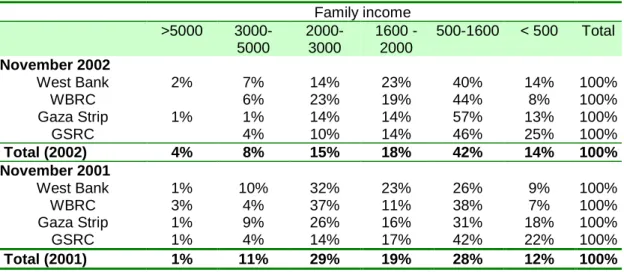
On the one hand, the income of households in the West Bank has been very significantly hit by the severe closure and Israeli military occupation. As indicated in table 1.2, below, between November 2001 and November 2002, the number of households with an income ranging between NIS 2000-3000 decreased from 32% to 14% in the West Bank (non-camp) and from 37% to 23% in the West Bank refugee camps. In return, West Bank non-camp households with an income ranging between NIS 500-1600 increased from 26% in November 2001 to 40% in November 2002. For West Bank camp residents, this proportion of households in this category increased from 38% to 44%. Finally, the proportion of West Bank non-camp households with an income of less than NIS 500 increased from 9% in November 2001 to 14% in November 2002.
On the other hand, households in the Gaza Strip, particularly those residing in the refugee camps, have a lower level of income than households in the West Bank. Moreover, as was the case in the West Bank, a drop of income has also affected households in the Gaza Strip. Whereas in November 2001, 26% of Gaza non-camp households and 14% of Gaza camp households had an income ranging between NIS 2000-3000, this proportion decreased respectively to 14% and 10%. Finally, it is worth noting that out of all the places of residence in the occupied Palestinian territory, the highest proportion of households with a very low income was found in the Gaza refugee camps (25%).
Table 1.2 Household income evolution according to place of residence, November 2001 - November 2002.
Family income >5000 3000-5000 2000-3000 1600 -2000 500-1600 < 500 Total November 2002 West Bank 2% 7% 14% 23% 40% 14% 100% WBRC 6% 23% 19% 44% 8% 100% Gaza Strip 1% 1% 14% 14% 57% 13% 100% GSRC 4% 10% 14% 46% 25% 100% Total (2002) 4% 8% 15% 18% 42% 14% 100% November 2001 West Bank 1% 10% 32% 23% 26% 9% 100% WBRC 3% 4% 37% 11% 38% 7% 100% Gaza Strip 1% 9% 26% 16% 31% 18% 100% GSRC 1% 4% 14% 17% 42% 22% 100% Total (2001) 1% 11% 29% 19% 28% 12% 100%
1.2.2. The extent of material deprivation
According to the Palestinian Central Bureau of Statistics (PCBS) last survey on the economic conditions of the Palestinian households and their standard of living, 66.56% of the Palestinian households are living below the poverty line (57.8% in the West Bank and 84.6% in the Gaza Strip) (PCBS 2002a:8-12). For the survey conducted for this report, the poverty threshold definition of the PCBS that applies to a reference family of 2 adults and 4 children of NIS 16513 has been adopted. The threshold for other types of families was developed by means of a formal equivalence scale used by the OECD that recognizes the different needs of adults and children
and in a very limited way the economies of scale.4
In comparison with previous studies, this report is introducing a new calculation of the poverty line (POV2) that links the poverty line to the family size. Logically, this different calculation leads to an increase of the number of people below the poverty line as compared to the method used in last surveys. However, the team kept both methods of calculating the poverty line in the survey of November 2002 for comparative analysis reasons. As such, in this report, the new poverty line (POV2) will be used for all static analysis, while the poverty line (POV1) that was used in previous reports will be used to compare the evolution in poverty since the report of December 2001.
The magnitude of the increase in poverty over the past 12 months suffices to illustrate the economic and social impact of the escalation of the crisis since April 2002. The results in figure 1.2, below, do not only illustrate how the poverty situation has dramatically deteriorated since the November 2001 survey, they also clearly indicate how the poverty rate has increased in varying degrees depending on the place of residence of the respondents.
3
In the questionnaire designed for this report, the number of NIS 1651 has been simplified to NIS 1600.
4
The equivalence scale is 1 for the first adult, 0.7 for the other adults from the household and 0.5 for the children. There are many other equivalence scales existing on the market that are more sensitive to the economies of scale within the household. However, the OECD one is simple to apply and widely used. We agree in principle with the need to adjust poverty threshold to take into account spatial difference (in particular between rural and urban areas) in the cost of basic needs, but the currently available data to implement that are not adequate because the sample is too small. If we are able to increase the sample in the future, we will include that dimension in the analysis.
Figure 1.2 Comparison in the poverty situation according to POV1 (November 2001 – November 2002) 34% 46% 10% 48% 65% 54% 52% 11% 70% 72% WB WBRC Jerusalem GS GSRC 0% 20% 40% 60% 80% November 2001 November 2002 60% 44% 40% 56% Nov Nov 2001 2002 0% 10% 20% 30% 40% 50% 60% 70%
Above poverty line Below poverty line
Comparison in the poverty situation (Nov 2001 and Nov 2002)
The poor according to place of residence (Nov 2001 and Nov 2002)
When considering the results according to the new poverty line (POV2) and as detailed in figure 1.3, below, the population of the occupied Palestinian territory is currently facing a critical situation of mass poverty with a poverty rate of 62%.5 Hereby, it is important to note the very high rate of hardship cases (28%), which underlines the present humanitarian crisis in the occupied Palestinian territory.
Figure 1.3 Poverty controlled by family size
As can be expected, family size is a key variable determining the poverty situation. Table 1.3, below, shows the relation between the family size and the rate of people below the poverty line and in hardship cases. The poverty rate increases when the family size increases. It is important to note that of the families with less than 7 members, the greatest part of the poor does not belong to the category of hardship cases. Meanwhile, for family consisting of 8 or more members, the poverty rate is much higher and the greatest part of the poor can be categorized as hardship cases. For example, for a family with 6 members the rate of people below the poverty line is 46% and the rate of hardship cases is 12%; those rates are respectively 26% and 69% for family with 10 members.
5
The poverty rate is given by the sum of rates of the respondents that can be categorized as below the poverty line and those in the category of hardship cases. The rate of people below the poverty line gives information about those who are poor, but do not live in extreme poverty.
Table 1.3 Poverty rate according to family size
Poverty (controlled by household size) Total Number of household members,
including children (below 18)
Above poverty line Below poverty line Hardship case
1 member 93% 7% 100% 2 members 76% 24% 100% 3 members 77% 17% 6% 100% 4 members 54% 36% 10% 100% 5 members 42% 46% 12% 100% 6 members 42% 46% 12% 100% 7 members 28% 39% 33% 100% 8 members 21% 29% 49% 100% 9 members 15% 32% 53% 100% 10 members 5% 26% 69% 100% 11 members 8% 46% 46% 100% 12 members 14% 40% 46% 100% 13 members 4% 35% 61% 100% 14 members 100% 100% 15 members 13% 38% 50% 100% 16 members 50% 50% 100% 17 members 50% 50% 100% 18 members 100% 100% 19 members 100% 100% 20 members 33% 67% 100% 21 members 100% 100% 22 members 100% 100% TOTAL 38% 34% 28% 100%
Further analysis of the poverty rate according to the place of residence, clearly points to a higher level of poverty and extreme poverty in the Gaza Strip (including its refugee camps) than in the West Bank. As indicated in figure 1.4, below, Jerusalem is characterized by a low poverty rate (8%) and almost no hardship cases. Meanwhile, in the Gaza Strip (non-camp) the poverty rate stands at 79%, of which 35% are hardship cases. In the West Bank (non-camp), the poverty rate reaches 62% with 27% hardship cases. Within the West Bank and the Gaza Strip, there is no significant difference regarding the poverty rate between refugee camps and non-refugee camps, albeit that the rate of hardship cases is much higher inside Gaza refugee camps (44%) than outside Gaza refugee camps (35%).
Figure 1.4 Poverty rate (POV2) according to place of residence
39% 37% 91% 21% 20% 38% 35% 35% 8% 44% 36% 34% 27% 27% 1% 35% 44% 28% West Bank WB - Refugee Camp Jerusalem Gaza
Gaza - Refugee Camp
oPt
0% 20% 40% 60% 80% 100% 120%
The analysis of the poverty rate according to districts shows the dramatic situation in the areas that have been the most affected by the curfews and the Israeli military occupation, particularly the Northwest of the West Bank (the Tulkarem-Jenin/Qalqilya area). The poverty rate is, for example, 84% in the Tulkarem district and 79% in the Jenin district. As indicated in table 1.4, below, the Jericho district in the Central West Bank is also distinguished by a very high poverty rate (78%). Meanwhile, the Bethlehem district in the South of the West Bank is with Jerusalem (8%) the district with the lower poverty rate (11%) and almost no hardship cases. Finally, in the Gaza Strip the poverty rate is higher than in the West Bank and it is in the North Gaza district (87%) and in the Rafah (80%) and Deir Al Balah (80%) districts where the poverty rate is the highest.
Table 1.4 Poverty rate (POV2) according to district
Poverty (controlled by household size) Total
Above poverty line Below poverty line Hardship case Hebron district 68 57 52 177 38% 32 % 29% 100% Jenin district 25 57 33 115 22% 50% 29% 100% Bethlehem district 52 5 1 58 90% 9% 2% 100% Ramallah district 50 35 18 103 49% 34% 18% 100% Jericho district 5 12 6 23 22% 52% 26% 100% Jerusalem district 123 9 1 133 93% 7% 1% 100% Nablus district 59 36 38 133 44% 27% 29% 100% Tulkarem district 14 40 36 90 16% 44% 40% 100%
South Gaza district 42 68 61 171
25% 40% 36% 100%
North Gaza district 12 47 32 91
13% 52% 35% 100%
Khan Younis district 21 28 43 92
23% 30% 47% 100%
Rafah district 14 28 27 69
20% 41% 39% 100%
Deir Al Balah district 13 31 22 66
20% 47% 33% 100%
oPt 498 453 370 1321
38% 34% 28% 100%
From a more general point of view, figure 1.5 shows that there are no differences between villages and cities regarding the risk of poverty and extreme poverty, but that this risk is much higher in refugee camps. Indeed, the poverty rate in refugee camps stands at 75% compared to 60% in cities and villages. Furthermore, whereas the rate of hardship cases reaches 39% in refugee camps, it is about 25% in cities and villages.
Figure 1.5 Poverty rate (POV2) according to area of residence 40% 25% 40% 34% 35% 35% 26% 39% 25% City Refugee camp Village
Above poverty line Below poverty line Hardship case
The next figure compares refugee and non-refugees according to poverty. As could be expected, refugees are more likely to be poor than non-refugees. The poverty rate of the former is 68% whereas it is 57% for the latter. However, the difference in hardship cases is less significant 29% compared to 27%.
Figure 1.6 Poverty rate (POV2) according to refugee status
32% 43% 38% 39% 30% 34% 29% 27% 28% Refugees Non-refugees Total population 0%% 20%% 40%% 60%% 80%% 100%%
Above poverty line Below poverty line Hardship case
From a gender perspective, it is clear in figure 1.7, below, that there are some significant differences in poverty rate, whereby men are more likely than women to stress poverty conditions. Indeed, whereas the poverty rate and hardship rate, as stated by male respondents, is respectively 67% and 31%, it is respectively 56% and 24% among female respondents.
Figure 1.7 Poverty rate (POV2) according to gender
32% 43% 36% 32% 31% 24% Male Female 0%% 20%% 40%% 60%% 80%% 100%%
Finally, when examining the poverty rate according to the age of the respondents, there is a very similar poverty rate in all the age groups (between 61% and 68%), except in the over 60 years group that is typified by a much lower poverty rate (39%). However, as illustrated in figure 1.8, below, it is worth noting that the 18-25 age group seems to be more vulnerable to extreme poverty as it is characterized by a significantly higher rate of hardship cases (38%) when compared to the 26-35 age group (21%), the 36-45 (29%), or the 46-60 group (33%).
Figure 1.8 Poverty rate (POV2) according to age group
33% 39% 37% 38% 61% 30% 40% 34% 29% 29% 38% 21% 29% 33% 10% 18-25 26-35 36-45 46-60 over 60
0%% Above poverty line20%% 40%%Below poverty line60%% Hardship case80%% 100%%
1.2.3. Subjective financial satisfaction poverty line
The main objective in this section is to give some additional information about the poverty profile by focusing attention on the respondents’ perceptions about the economic situation. Subjective poverty provides some extra information, such as mood variability and expectations regarding the future that can be combined with more conventional metrics of welfare.
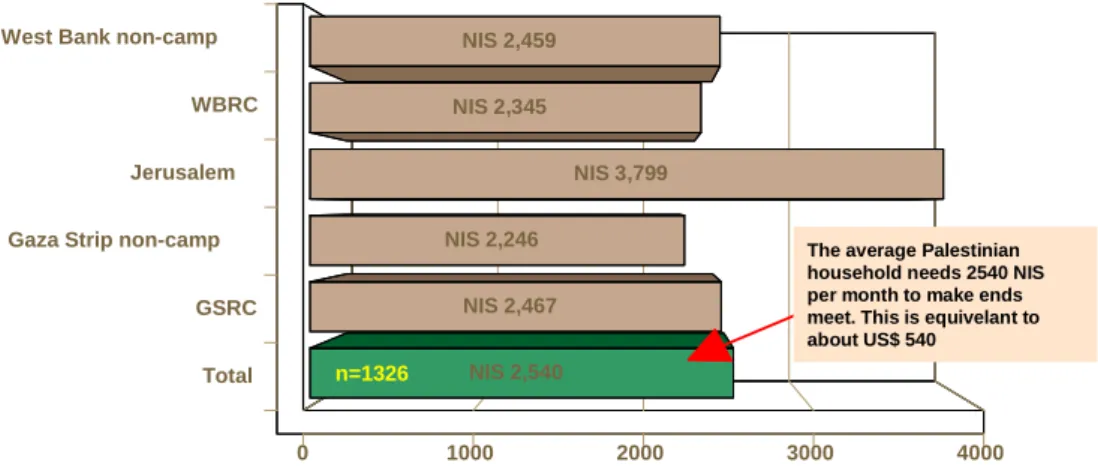
When respondents were asked as to the average amount of money they need to meet the basic necessities of the household, an average of 2540 NIS was calculated from the overall sample (this amount is equivalent to US $ 540). As shown in figure 1.9 below, the amount is more or less similar according to place of residence, with the exception of the Jerusalem respondents who stated an average monthly amount that is almost 50% higher than the overall average.
Figure 1.9 The average amount needed by the household to meet the basic necessities according to place
0 1000 2000 3000 4000
West Bank non-camp
WBRC
Jerusalem
Gaza Strip non-camp
GSRC Total NIS 2,459 NIS 2,345 NIS 3,799 NIS 2,246 NIS 2,467 NIS 2,540
The average Palestinian household needs 2540 NIS per month to make ends meet. This is equivelant to about US$ 540
When the interviewees were asked how close their household income is to the minimum amount needed to make ends meet, 23% of the respondents declared that their household income is slightly less than the amount needed to meet basic necessities, while 51% stated that their household income is much less than what they need. Furthermore, as illustrated in figure 1.10, below, only 6% of the respondents reported that their household income is slightly higher than the minimum needed, and a mere 3% said that their household income is much higher than the monthly amount needed to be able to afford basic life necessities. As such, from this information it is possible to deduce that the subjective poverty rate in the occupied Palestinian territory is 74%. The fact that the subjective poverty (74%) rate is about 12% higher than the poverty rate based on POV2 (62%) points to the widespread perception of poverty among the Palestinian population.
Figure 1.10 The extent to which the household income is close to the monthly amount needed to meet basic life necessities (Q48)
Much higher than this 3%
Slightly higher than this 6%
About the same 17%
Slightly less than this 23%
Much less than this 51%
Figure 1.11, below, shows some interesting results about subjective poverty according to the place of residence of the interviewees. In general, it is obvious that in all places of residence the subjective perception of severe income deprivation is much higher than the hardship rate based on POV2. The results indicate that there is no great difference in the perception of poverty between the Gaza non-camp residents (51%) and the West Bank non-camp residents (54%). However, the perception of poverty is much higher among refugee camp residents as 67% of the West Bank refugee camp respondents and 68% of the Gaza Strip refugee camp respondents declared that their household income was much less than the amount needed to meet basic necessities.
Figure 1.11 The extent to which the household income is close to the monthly amount needed to meet basic life necessities (Q48) according to place of residence
1% 27% 1% 3% 4% 5% 26% 2% 4% 6% 19% 13% 14% 16% 11% 17% 22% 15% 17% 30% 17% 23% 54% 67% 16% 51% 68% 51% West Bank WBRC Jerusalem Gaza GSRC TOTAL 0% 20% 40% 60% 80% 100% 120%
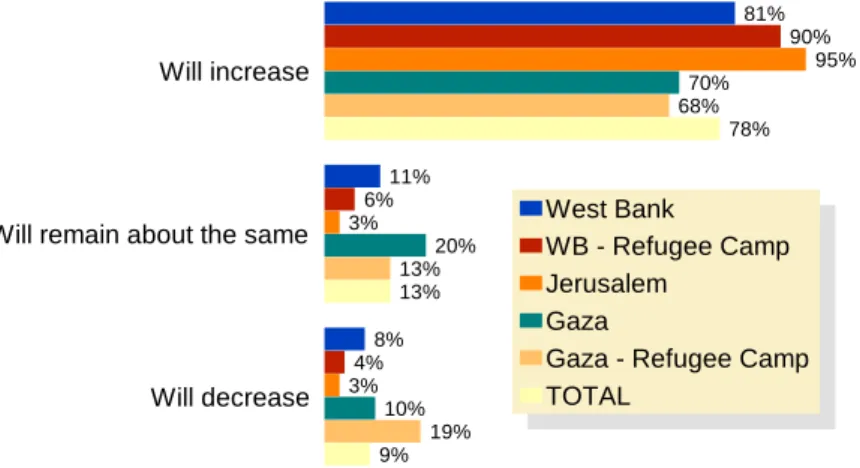
Gathering information about people’s expectations for the future is another important element to gauge a population’s perception of their economic and social situation. In general, when interviewees were asked how they expected poverty to evolve in the next six months, the large majority of 78% responded that they expected poverty to increase. There are, however, important differences in opinion according to the place of residence of the respondents. As illustrated in figure 1.12, below, West Bank respondents, whether residing in camps (90%) or outside camps (81%), are far more pessimistic about the future than compatriots in the Gaza Strip, whether residing in camps (68%) or outside camps (70%). The higher level of pessimism among West Bank respondents regarding the future evolution of poverty is most likely a result of the extremely strenuous closure policy and the higher level of military occupation that residents in the West Bank had to deal with over the past months. Finally, it is important to note the extraordinary high level of pessimism in Jerusalem, where 95% of the respondents expected poverty to increase in the next six months.
Figure 1.12 Expected evolution of poverty in the next 6 months according to place of residence
81% 11% 8% 90% 6% 4% 95% 3% 3% 70% 20% 10% 68% 13% 19% 78% 13% 9% Will increase
Will remain about the same
Will decrease
West Bank
WB - Refugee Camp Jerusalem
Gaza
Gaza - Refugee Camp TOTAL
The analysis so far has indicated that since the beginning of the Intifada the Palestinian population has had to adapt to large-scale social and economic transformations. Material deprivation and unemployment have reached record levels and the well-being of the population has deteriorated very rapidly. In such a context, it is important to try and determine the impact of those changes on social cohesion. In order to do so, interviewees were asked how they would evaluate their financial situation in comparison with the financial situation of others in their community. In general, the results indicate that the large majority of the respondents (68%) consider their financial situation to be similar to that of others in their community, and they seem to feel that the current difficult situation is affecting everybody in their community in the same manner.
Regarding the perception of the household’s financial situation, some differences in opinions can, of course, be detected depending on the variable used for the analysis. When looking at the issue of the household’s financial situation from a poverty perspective, for example, it is striking to find out that still 60% of hardship cases consider the financial situation of their household to be similar to that of others in their community. The results on the perception of the household’s financial situation according to the poverty rate are overviewed in more detail in figure 1.13, below.
Figure 1.13 Perception of household’s financial situation (Q77) according to poverty (POV2) 23% 73% 4% 11% 68% 21% 4% 60% 36%
Better off than the people in my community
About the same as the people in my community
Worse than the people in my community
0%% 20%% 40%% 60%% 80%% 100%%
Above poverty line Below poverty line Hardship case
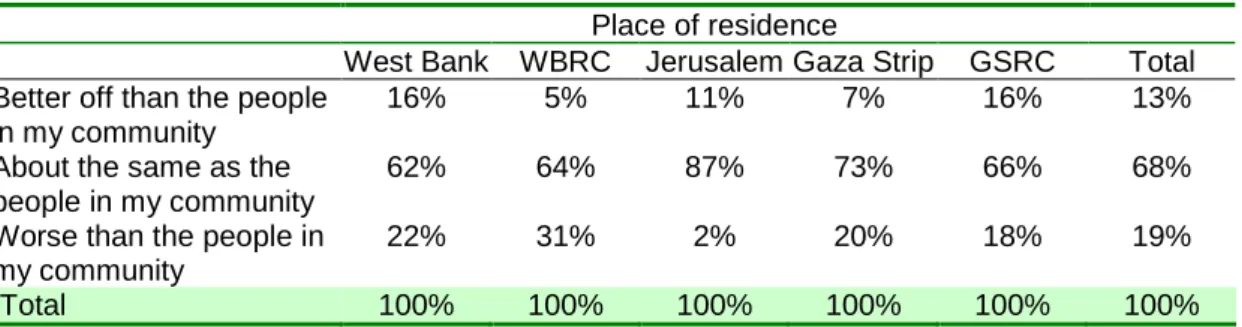
When examining the issue of the household’s financial situation according to the place of residence of the respondents, it is clear that the majority of the respondents consider their financial situation to be about the same as that of others in their community. It is worth noting, though, that the highest percentage of respondents estimating their household’s financial situation to be worse than that of others in their community, reside in the West Bank refugee camps (31%). In the Gaza Strip refugee camps, only 18% of the respondents thought that their household’s financial situation was worse than that of people in their community.
Table 1.5 Perception of household's financial situation according to place of residence Place of residence
West Bank WBRC Jerusalem Gaza Strip GSRC Total Better off than the people
in my community
16% 5% 11% 7% 16% 13%
About the same as the people in my community
62% 64% 87% 73% 66% 68%
Worse than the people in my community
22% 31% 2% 20% 18% 19%
Total 100% 100% 100% 100% 100% 100%
Finally, when taking into account the work category of the respondents, unskilled workers seem to consider themselves as a disadvantaged group from a financial perspective as 43% of them feel that their financial situation is worse than that of people in their community. Furthermore, the results in table 1.6, below, reveal that professionals and employees regard themselves as being in a more privileged financial position as respectively 39% and 25% think that they are better off than others in their community.
Albeit that some differences in opinions were detected in figure 1.13 and tables 1.5 and 1.6, above, depending on the subgroups under examination, it is important to stress that the majority of the respondents do not feel any economic differentiation in comparison to other people in their community. This is very significant as it implies that there is no evidence of social fragmentation as a result of the more than two-year-old crisis. On the contrary, there seems to be a strong feeling that everyone in the community is faced with, and has to cope with, external factors of poverty.
Table 1.6 Perception of household's financial situation according to occupation (Q6) Perception of household's financial situation
Better off than
the people in my community
About the same as the people in my community
Worse than the people in my community Total Professional 22 32 2 56 39% 57% 4% 100% Skilled worker 7 100 41 148 5% 68% 28% 100% Unskilled worker 6 57 47 110 6% 52% 43% 100% Technician 4 52 13 69 6% 75% 19% 100% Employee 74 200 20 294 25% 68% 7% 100% Self employed 12 54 14 80 15% 68% 18% 100% TOTAL 126 497 142 765 17% 65% 19% 100%
1.2.4. Subjective well-being and factors affecting it
It is doubtful whether monetary income is the only determinant of well-being in an environment, such as the one that Palestinian households live in, since last Israeli incursion to the occupied Palestinian territory. In a context marked by the development of transaction in kind, humanitarian aid, restrictions in access to basic goods and services, and material and immaterial deprivation, income is only one factor among others influencing individuals’ life satisfaction levels.
As will be remembered from sections 1.2.2 and 1.2.3, above, the poverty rate according to POV2 stands at 62% and the subjective financial dissatisfaction rate reaches 74%. When interviewees were asked to specify their level of satisfaction with the situation in general, it became clear that the subjective dissatisfaction rate with the situation is even more striking. Indeed, as illustrated in figure 1.14, below, 89% of the respondents stated that they were dissatisfied with the general situation. Of those 89% of dissatisfied respondents, an impressive 58% were very dissatisfied and 31% were somewhat dissatisfied.
Figure 1.14 Level of satisfaction in general
Very satisfied 1% Somewhat satisfied 10% Somewhat dissatisfied 31% Very dissatisfied 58%
When taking a closer look at the high level of dissatisfaction among Palestinians with the general situation according to place of residence, the negative impact of severe closures and curfews on the perception of the general situation cannot be denied. In general, it is very evident that Palestinians residing in the Gaza Strip - where mobility restrictions have been less severe and where the socio-economic situation has deteriorated less sharply during the last six months – are less dissatisfied with the general situation than Palestinians residing in the West Bank. Indeed, as indicated in figure 1.15, below, whereas 45% of the non-camp respondents in the Gaza Strip expressed their extreme dissatisfaction with the situation, this was the case for 66% of the non-camp respondents in the West Bank. Similarly, 56% of camp respondents in the Gaza Strip stated that they were very dissatisfied with the situation compared to 61% of the camp respondents in the West Bank. As such, it is safe to conclude from the results that the rate of very dissatisfied Palestinians is highly influenced by the dynamic of increasing poverty and the new reality of instability that has resulted from the Israeli military intervention.
Figure 1.15 Satisfaction by place of residence
1% 2% 1% 1% 10% 3% 12% 15% 23% 38% 41% 43% 28% 66% 61% 55% 45% 56% West Bank WB - Refugee Camp Jerusalem Gaza
Gaza - Refugee Camp
0%% 20%% 40%% 60%% 80%% 100%%
Very satisfied Somewhat satisfied Somewhat dissatisfied Very dissatisfied
When considering the main determinants of the level of dissatisfaction, it is not surprising that income and employment status play a crucial role. As illustrated in figure 1.16, below, among the very dissatisfied respondents, 69% were poor according to POV2 and 32% were hardship cases. However, even among the respondents with a household income above the poverty line, the level of dissatisfaction is very high as 48% of them are very dissatisfied. This high level of dissatisfaction among respondents above the poverty line could be indicative of the process of growing income insecurity for medium income households and could also point to the non-financial aspects of the level of dissatisfaction with the situation in general.
Figure 1.16 Level of satisfaction according to poverty (controlled by household size)
Above poverty line Below poverty line Hardship case 0% 5% 10% 15% 20% 25% 30% 35% 40% 45% 50% 43% 36% 21% 47% 27% 26% 46% 32% 22% 31% 37% 32% satisfaction Very satisfied Somewhat satisfied Somewhat dissatisfied Very dissatisfied Of all those above the poverty line, 48% are very disatisfied compared to 61% among those who are below the poverty line, and 66% among those classified as hardship cases
From an income perspective, the perception of households’ financial situation compared to other households in the community affects in a considerable manner the level of satisfaction with the situation in general. Indeed, 76% of the respondents who feel that their household’s financial situation is worse than that of others in their community are very dissatisfied with the general situation. The results in table 1.7, below, further indicate that only 53% of the respondents who feel that their household’s financial situation is about the same as that of other people in their community are very dissatisfied with the situation in general. As such, even if the perception of social fragmentation remains limited in the occupied Palestinian territory, the results point to a growing need for targeted policies in order to preserve social cohesion.
Table 1.7 Satisfaction with the situation in general (Q1) according to the perception of the household's financial situation (Q77)
Perception of household's financial situation Total
Better off than the
people in my community
About the same as the people in my
community
Worse than the people in my community Very satisfied 2% 1% 0% 1% Somewhat satisfied 10% 11% 7% 10% Somewhat dissatisfied 34% 35% 17% 32% Very dissatisfied 53% 53% 76% 57% Total 100% 100% 100% 100%
The level of dissatisfaction with the situation in general is also strongly linked with the employment status of the respondents. Indeed, as portrayed in figure 1.17, below, 73% of the unemployed and 64% of those working for only few hours per day declared they were very dissatisfied with the situation, compared to 48% of the full-time employed who declared the same. At this stage it is worth noting though, that there is no statistical significance between the level of dissatisfaction with the situation and the duration of unemployment of the respondents.
Figure 1.17 Satisfaction with the situation in general according to the employment situation 1% 13% 38% 48% Full time 8% 36% 56% Part time 2%6% 28% 64% Few hours 5% 21% 73% Unemployed 1%10% 31% 58% All respondents Very satisfied Somewhat satisfied Somewhat dissatisfied Very dissatisfied
Finally, it is clear that the respondents who are very dissatisfied with the situation in general are also far more pessimistic about the evolution of poverty in the next six months than the respondents who are less dissatisfied with the situation. The results in table 1.8, below, reveal that 67% of those who are very dissatisfied with the situation in general expect poverty to increase sharply in the next six months and a mere 11% of those respondents expect poverty to remain about the same. For the sake of comparison, among the respondents who are relatively satisfied with the situation, 42% expected poverty to increase sharply in the next six months and 22% expect poverty to remain about the same. It is worth mentioning here that the link between respondents’ level of dissatisfaction and their expectations concerning the evolution of poverty in the next six months represents a two-way street: on the one hand, respondents who are very dissatisfied have pessimistic expectations about the evolution of poverty in the next six months; on the other hand, respondents who have no hope for an improvement of their financial situation in the next six months, are very dissatisfied with the situation in general.
Table 1.8 Satisfaction with the situation in general (Q1) according to the expected evolution of poverty in the next six months (Q69)
Expected evolution of poverty in the next 6 months Total
Will increase sharply Will increase slightly Remain the same Will decrease slightly Will decrease sharply Very satisfied 5 2 6 13 38% 15% 46% 100% Somewhat satisfied 50 26 26 11 6 119 42% 22% 22% 9% 5% 100% Somewhat dissatisfied 201 84 47 29 11 372 54% 23% 13% 8% 3% 100% Very dissatisfied 468 105 74 21 33 701 67% 15% 11% 3% 5% 100% Total 724 217 153 61 50 1205 60% 18% 13% 5% 4% 100%
1.3. The evolution of the labor market
As was discussed earlier, the Israeli closure and curfew policies were intended to restrict the mobility of people and goods. The numerous checkpoints and the “back-to-back system” within the occupied Palestinian territory led to widespread disruption of all facets of life and have, in particular, dramatically increased the unemployment level. This situation climaxed since March 2002 when the Israeli army effectively re-occupied the West Bank.
1.3.1. The employment status
The Palestinians have had to face two major problems regarding the evolution of their labor market. Firstly, a mass unemployment problem which is resulting from both the collapse of their domestic economy due to the Israeli re-occupation, and their exclusion from the Israeli formal and informal labor market. Secondly, the Israeli imposed curfews and internal and external closures prevented most Palestinians from reaching their work place or running their business normally. Even the peasants were prevented access to their fields as result of these mobility restrictions or violence from armed settlers, so were the fisherman in the Gaza Strip who were restricted from fishing off the Gaza coast.
Under such conditions, it is not surprising to see that 56% of the respondents declared it was difficult or very difficult for them, or for their family members to go to work. As illustrated in figure 1.18, below, 14% declared that this was almost impossible. Villagers have been particularly hit by mobility restrictions as a result of their isolation and their inability to reach the work place. Indeed, 20% of them emphasized that it was almost impossible for them to go to work in the past 12 months and 61% stated that it was difficult or very difficult, whereas the rates where respectively 9% and 57% for cities and 17% and 43% for refugee camp residents.
Figure 1.18 The ability of household members to go to work in the past 12 months according to residence
9% 16% 20% 57% 43% 61% 34% 40% 19% City Refugee camp Village Almost impossible Difficult or very difficult Not difficult Almost impossible 170 14% Difficult 707 56% Not difficult 380 30% Total WBGS
The effects of mobility restrictions were felt in some places more than others. As illustrated in figure 1.19, below, West Bank refugee camp residents were the most