RACK1 Is an Interaction Partner of ATG5 and a Novel
Regulator of Autophagy
*
Secil Erbil‡1, Ozlem Oral‡2,3, Geraldine Mitou‡3,4, Cenk Kig‡, Emel Durmaz-Timucin‡, Emine Guven-Maiorov§¶5, Ferah Gulacti‡1,6, Gokcen Gokce‡1,7, Jörn Dengjel储, Osman Ugur Sezerman**, and Devrim Gozuacik‡8
From the‡Molecular Biology, Genetics and Bioengineering Program, Sabanci University, Orhanli-Tuzla, 34956 Istanbul, Turkey, the §
Department of Chemical and Biological Engineering and¶Center for Computational Biology and Bioinformatics, Koc University, 34450 Istanbul, Turkey, the储Department of Biology, University of Fribourg, Chemin du Musée 10, CH-1700 Fribourg, Switzerland, and the **Department of Biostatistics and Medical Informatics, School of Medicine, Acibadem University,
Atasehir, 34752 I˙stanbul, Turkey
Autophagy is biological mechanism allowing recycling of long-lived proteins, abnormal protein aggregates, and damaged organelles under cellular stress conditions. Following seques-tration in double- or multimembrane autophagic vesicles, the cargo is delivered to lysosomes for degradation. ATG5 is a key component of an E3-like ATG12-ATG5-ATG16 protein com-plex that catalyzes conjugation of the MAP1LC3 protein to lip-ids, thus controlling autophagic vesicle formation and expan-sion. Accumulating data indicate that ATG5 is a convergence point for autophagy regulation. Here, we describe the scaffold protein RACK1 (receptor activated C-kinase 1, GNB2L1) as a novel ATG5 interactor and an autophagy protein. Using several independent techniques, we showed that RACK1 interacted with ATG5. Importantly, classical autophagy inducers (starva-tion or mammalian target of rapamycin blockage) stimulated RACK1-ATG5 interaction. Knockdown of RACK1 or preven-tion of its binding to ATG5 using mutagenesis blocked autophagy activation. Therefore, the scaffold protein RACK1 is a new ATG5-interacting protein and an important and novel component of the autophagy pathways.
Autophagy is a highly conserved biological mechanism that is responsible for lysosome-dependent recycling of long-lived abnormal or misfolded proteins as well as dysfunctional or unnecessary organelles (such as depolarized mitochondria) (1). Under normal conditions, basal autophagy help maintain
cel-lular homeostasis. Autophagy is rapidly up-regulated following stress, including nutrient deprivation, accumulation of mis-folded proteins, mitochondrial depolarization, or exposure to toxic chemicals (2). Autophagy malfunctions were shown to contribute to several pathologies, such as neurodegenerative diseases, lysosomal storage disorders, and cancer (3).
The process starts with the nucleation and elongation of dou-ble-membrane structures called “autophagosomes” or “autophagic vesicles.” As they mature through fusion with late endosomes or lysosomes, vesicles give rise to “autolysosomes,” a hybrid compartment in which vesicle contents are degraded by the action of lysosomal hydrolases (4). So far, around 33 different core autophagy proteins (ATGs) were described (5). Among them, two ubiquitination-like reactions are key to autophagic vesicle membrane elongation as follows: ATG12-ATG5-ATG16L1 and ATG8 (MAP1LC3 or shortly LC3 in mammals). The first ubiquitination-like reaction results in the covalent conjugation of a Lys-130 residue of the ATG5 protein to a ubiquitin-like protein, ATG12. Following addition of ATG16L1 to the ATG12-conjugated ATG5, a larger complex of around 669 – 800 kDa forms (6). The ATG12-ATG5-ATG16L1 complex serves as an E3-like enzyme for the second ubiquity-lation-like reaction. Here, the LC3 protein is covalently attached to a lipid molecule, generally to a phosphatidyletha-nolamine contributing to the elongation of autophagic mem-branes (7, 8). Conversion of the free cytosolic form of LC3 (LC3-I) to the lipid-conjugated form (LC3-II) leads to its local-ization to dot-like autophagosome structures in the cytosol and changes its mobility in SDS-polyacrylamide gels (9). ATG5 and LC3 conjugations systems are required for the canonical autophagy pathway to proceed, and abnormalities result in autophagy defects (10).
mTOR9serine/threonine kinase is an important upstream regulator of the autophagy pathway. mTOR-containing protein complexes (namely mTORC1 and mTORC2) sense and inte-grate signals, including amino acid, growth factor, and ATP availability, and regulate cellular responses. mTORC1 complex regulates cellular growth and protein synthesis through
activa-*This work was supported in part by Scientific and Technological Research Council of Turkey (TUBITAK) 1001 Grant 107T153, the Sabanci University (to D. G.), and Swiss National Science Foundation Grant 31003A-166482/1 (to J. D.). The authors declare that they have no conflicts of interest with the contents of this article.
1Supported by a TUBITAK BIDEB 2211 Scholarship for Ph.D. studies. 2Present address: Nanotechnology Research and Application Center,
Sabanci University, Orhanli-Tuzla, 34956 Istanbul, Turkey.
3Both authors contributed equally to this work.
4Present address: Inserm UMR1037 CRCT, F-31000 Toulouse, France. 5Present address: Center for Cancer Research, NCI, National Institutes of
Health, Bldg. 542, Rm. 603, Frederick, MD 21702-1201.
6Present address: Duzce Ataturk Public Hospital, Aziziye Str. 81010 Duzce,
Turkey.
7Present address: Santa Farma Drug Co., Okmeydanı, Borucicegi Str. No. 16
Sisli 34382, Istanbul, Turkey.
8Recipient of IKU Prof. Onder Oztunali Science Award, TGC Sedat Simavi
Health Sciences Award, and Elginkan Foundation Technology Award. To whom correspondence should be addressed. Tel.: 90-216-4839617; E-mail: [email protected].
9The abbreviations used are: mTOR, mammalian target of rapamycin; r.m.s.d.,
root mean square displacement; Y2H, yeast two-hybrid; IP, immunopre-cipitation; BafA, bafilomycin A; MD, molecular dynamics; CNT, control; MEF, mouse embryonic fibroblast; N2A, Neuro2A; EBSS, Earle’s balanced salt solution; SILAC, stable isotope labeling with amino acids in cell culture.
Published in "Journal of Biological Chemistry 291(32): 16753–16765, 2016"
which should be cited to refer to this work.
tion of its downstream targets, including p70 S6 kinase (p70S6K) and 4EBP protein. mTORC1 activity directly inhibits the autophagy pathway through its effect on the ULK1/2 autophagy protein complex (11). In case of deprivation of the above-mentioned factors, mTOR activity is blocked, allowing the ULK1/2 complex to function. Hence, chemical inhibitors of mTOR activity, such as rapamycin or torin 1, strongly activate autophagy.
Recent studies showed that WD domain-containing pro-teins, such as ATG16L1, ALFY, and WIPI1, play significant roles in different stages of the autophagy pathway (12–16). In this study, we describe RACK1 (receptor-activated C-kinase 1, GNB2L1), a WD40 repeat protein with a seven-bladed -pro-peller structure, as an interaction partner of ATG5 and a novel autophagy protein. RACK1 was originally characterized as a scaffold/adaptor protein that binds to protein kinase C (PKC) isoforms (17). Since then, several non-PKC partners of RACK1 were described as well, and the protein was involved in the regulation of a variety of cellular functions, including prolifer-ation, migrprolifer-ation, apoptosis, angiogenesis, and protein transla-tion (18).
Here, we showed that RACK1-ATG5 interaction was regu-lated by autophagy-inducing signals, namely starvation and mTOR inhibition. Importantly, we provide evidence that RACK1 protein itself and the RACK1-ATG5 interaction were indispensable for autophagy induction. Using chemical inhibi-tors and genetic approaches, we mapped signaling events reg-ulating RACK1-ATG5 interaction downstream to the mTOR/p70 S6 kinase pathway. Therefore, our data show that RACK1 is a new and dynamic component of the core autophagy machinery.
Results
RACK1 Is a Novel ATG5 Interaction Partner—To discover
novel ATG5 interactors and autophagy-related proteins, we performed a yeast two-hybrid (Y2H) screen using ATG5 as a bait. At least three different clones of RACK1 (GNB2L1) were found to interact with the autophagy protein. The results of the Y2H screen will be described in detail elsewhere.10
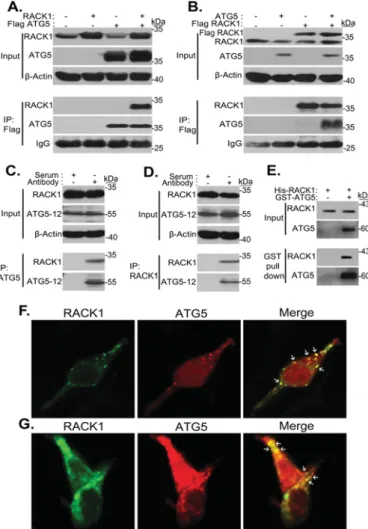
To confirm the interaction, we cloned full-length RACK1 cDNA into a mammalian expression vector. Following overex-pression experiments in HEK293T cells, we could show that immunoprecipitated ATG5 could pull down the RACK1 pro-tein (Fig. 1A). Conversely, RACK1 immunoprecipitation resulted in the pulldown of ATG5 (Fig. 1B). We could also con-firm the interaction between the endogenous proteins in mouse embryonic fibroblast (MEFs) cells (Fig. 1, C and D). Moreover, we could validate that the two proteins interacted directly in GST pulldown in vitro binding assays using recombinant pro-teins (Fig. 1E). Finally, examination of cells using confocal microscopy under basal fed conditions (culture in DMEM plus 10% FBS) showed that both proteins were partially colocalized in cytoplasmic dots (Fig. 1, F and G). All these data indicated
that RACK1 is a novel ATG5-interacting protein. Dynamic Nature of ATG5-RACK1 Interaction under Autophagy-inducing Conditions—To further confirm the
ATG5-RACK1 interaction, we performed gel filtration experi-ments with endogenous protein extracts using a gel filtration
10S. Erbil and D. Gozuacik, manuscript in preparation.
FIGURE 1. RACK1 is a novel ATG5 interactor. A, HEK293T cells were cotrans-fected with plasmids encoding FLAG-tagged ATG5 and/or non-tagged full-length RACK1 proteins. 48 h after transfection, IP were performed using FLAG beads. Anti-ATG5 and anti-RACK1 antibodies were used for immunoblotting.
Input, total cell extract; IgG, immunoglobulin G. Molecular mass is shown in
kilodaltons (kDa).-Actin was used as loading control. B, HEK293T cells were cotransfected with FLAG-RACK1 and/or non-tagged ATG5 constructs, and immunoprecipitations were performed using FLAG beads. C, endogenous ATG5 protein was immunoprecipitated from wild-type MEF cell extracts using anti-ATG5 antibodies that were coupled to protein A Plus beads. Anti-ATG5 and anti-RACK1 antibodies were used for immunoblotting. Serum, con-trol rabbit serum. D, endogenous RACK1 protein was immunoprecipitated from wild-type MEF cell extracts using anti-RACK1 antibodies that were cou-pled to protein G Plus beads. Anti-ATG5 and anti-RACK1 antibodies were used for immunoblotting. Serum, control mouse serum. E, GST pulldown assay. Glutathione-Sepharose beads that were bound to GST-ATG5 recombinant protein or not were incubated with His-RACK1 recombinant protein and washed. Input, immunoblotting of recombinant proteins; GST pulldown, pro-teins after pulldown. Note that His-RACK1 did not bind to beads alone. F, HEK293T cells were cultured on coverslides and cotransfected with GFP-tagged RACK1 (green) and Cherry-GFP-tagged ATG5 (red) constructs. 48 h post-transfection, cells were fixed and analyzed under a confocal microscope.
Merge, overlay of green and red signals. White arrows show yellow cytoplasmic
dots formed by RACK1 and ATG5 colocalization. G, non-transfected HEK293T cells were cultured on coverslides. After 72 h of incubation, cells were fixed, and endogenous RACK1 and ATG5 proteins were immunostained using anti-RACK1 and anti-ATG5 primary antibodies. Anti-mouse IgG Alexa Fluor 488 (green) or rabbit IgG Alexa Fluor 568 (red) were used as secondary anti-bodies, respectively. Cells were analyzed under a confocal microscope. Merge, overlay of green and red signals. White arrows show yellow cytoplasmic dots formed by RACK1 and ATG5 colocalization.
column with a separation range between 5 and 5000 kDa. In line with the published data (12, 19), the endogenous ATG12-5-16 complex was eluted from the column at 669 – 800-kDa frac-tions. Endogenous RACK1 protein was mostly absent in ATG12-5-16- containing fractions under fed conditions in HEK293T (Fig. 2A, CNT) and Neuro2A (N2A) (Fig. 2B, CNT) cells. Importantly, upon autophagy activation using an mTOR inhibitor, torin 1 (Fig. 2, A and B), the amount of RACK1 pro-tein that was recovered in fractions containing the ATG12-5-16 complex was significantly increased.
Tri-SILAC labeling and LC-MS/MS analysis was performed following immunoprecipitation of a FLAG-tagged ATG5 pro-tein from cells. Using this technique, we could confirm ATG5-RACK1 interaction under autophagy-stimulating conditions (Fig. 2I).
Immunoprecipitation assays supported the data as well. Indeed, the RACK1-ATG5 interaction was prominently
increased following treatment of cells with mTOR inhibitors rapamycin or torin 1 (Rapa, Torin, Fig. 3, A and C). Starvation of cells stimulated the interaction between two proteins as well (Stv, Fig. 3, B and C).
To check the intracellular localization of RACK1-ATG5 interaction following autophagy activation, we performed con-focal microscopy analyses. Treatment of cells with rapamycin or torin 1, or starvation led to an increase in the number of dot-like structures where ATG5 and RACK1 colocalized (Fig. 3D) Moreover, RACK1-positive dots colocalized with the autophagosome marker LC3 (Fig. 3E), indicating that these structures truly represent autophagosomes (20).
RACK1 Is Required for Autophagy Activation Following mTOR Inhibition and Starvation—Interaction of RACK1 with
an autophagy-related protein complex and in an autophagy stimulus-dependent manner indicated that RACK1 could be an important component of autophagy regulation. Alternatively, FIGURE 2. RACK1 is a novel component of a large ATG12-5-16 protein complex. A, non-transfected HEK293T cell were treated with torin 1 or DMSO carrier control, and total cell lysates were fractioned in a gel filtration column. Chromatography fractions (F1–13) were separated in SDS-polyacrylamide gels and immunoblotted using anti-ATG16, anti-ATG5, and anti-RACK1 antibodies. CNT, DMSO carrier control; TORIN, torin 1 treatment (250 nM, 3 h); ATG16, ATG16L1;
L, total cell lysate; F1 and F2,⬎800-kDa fractions; F3–6, 800–669-kDa fractions; F7–10, 669–443-kDa fractions; F11 and F12, 443–200-kDa fractions; F13, 200 –150-kDa fraction. No protein complexes were detected in lower molecular weight fractions. B, N2A cell were treated with torin 1 or DMSO carrier control, and total cell lysates were fractioned in a gel filtration column as in A. C, chromatogram showing peaks of the molecular weight marker mix (Sigma, catalog no. MWGF1000); Ve, elution volume. D, OD595absorbance confirmation of the peaks. E, standardization of the gel filtration column by Ve/V0. V0, void volume. F, curve
showing correlation of fractions with protein sizes in kDa. G and H, representative chromatograms obtained for HEK293T (G) and N2A (H) cell lines. I, Tri-SILAC-LC-MS/MS analyses. ATG5 enrichment compared with beads alone (upper panel); enrichment of RACK-ATG5 complex under torin-treated conditions compared with DMSO-treated control (lower panel) (mean⫾ S.D. of independent experiments, n ⫽ 3, *, p ⬍ 0.05).
RACK1 could be an autophagy target that was recruited to autophagosomes through its interaction with autophagy proteins.
To determine the importance of RACK1 in autophagy mech-anisms, we knocked down RACK1 using specific siRNAs and quantified autophagy activation levels using LC3 dot quantifi-cation analyses. In cells transfected with a control siRNA (CNT siRNA), mTOR inhibition or starvation strongly induced autophagy (around 4 –5 times basal levels). Strikingly, knock-down of RACK1 under the same conditions significantly atten-uated autophagy induction by these stimuli (Fig. 4, A and B). Moreover, knockdown of RACK1 prevented LC3-II formation and led to an accumulation of LC3-I in immunoblots. In line with this, p62 degradation that was observed in extracts from CNT siRNA-transfected cells was abolished following RACK1 down-regulation (Fig. 4A). Under these conditions, addition of bafilomycin A (an inhibitor of autophagosome-lysosome fusion blocking autolysosomal degradation) led to LC3-II accumula-tion in controls and could block p62 degradaaccumula-tion. In contrast, bafilomycin A did not cause further p62 or LC3-II accumula-tion in extracts from cells with RACK1 knockdown (Fig. 4A). All these results indicate that RACK1 is involved in upstream
stages before autophagosome-lysosome fusion and autolyso-some formation.
To detect whether RACK1 could be an autophagy target, we stimulated autophagy using rapamycin or starvation in the absence or presence of translation inhibitor cycloheximide or bafilomycin A, and we checked endogenous RACK1 protein levels (Fig. 4, C and D). None of these treatments resulted in RACK1 degradation even at longer incubation times (24-h ra-pamycin treatment or 8-h starvation), and independent of cycloheximide treatment, bafilomycin A treatment did not result in significant RACK1 accumulation. Therefore, RACK1 itself is not degraded by autophagy, but it is required for autophagy induction by classical autophagy stimuli, i.e. mTOR inhibition and starvation.
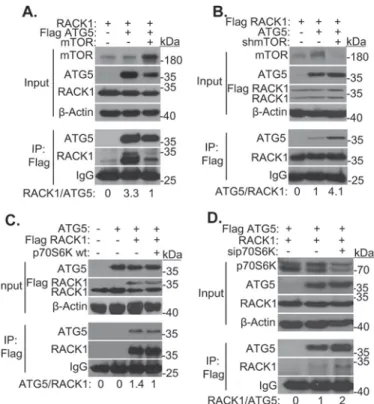
mTOR and p70S6K Regulate RACK1-ATG5 Interaction—
Because inhibition of mTOR resulted in an increase in RACK1-ATG5 interaction, we wondered whether RACK1-RACK1-ATG5 inter-action was regulated by mTOR itself or proteins that function downstream to mTOR.
We overexpressed mTOR protein and checked RACK1-ATG5 interaction in co-immunoprecipitation assays. Under these conditions, we observed that overexpression of the FIGURE 3. Dynamic nature of RACK1-ATG5 interaction under autophagy-inducing conditions. A, HEK293T cells were cotransfected with FLAG-ATG5 and/or non-tagged RACK1 constructs and treated or not with rapamycin (Rapa, 200 nM, 16 h) or torin 1 (Torin, 250 nM, 3 h). IP were performed using FLAG beads. Anti-ATG5 and anti-RACK1 antibodies were used for immunoblotting. Input, total cell extract; IgG, immunoglobulin G. Molecular mass is shown in kDa.-Actin was used as loading control. Band intensities were quantified using ImageJ. B, HEK293T cells were cotransfected with FLAG-RACK1 and/or non-tagged ATG5 constructs and starved in EBSS (2 h) or not. Anti-ATG5 and anti-RACK1 antibodies were used for immunoblotting. C, HEK293T cells were treated or not with rapamycin (Rapa, 200 nM, 16 h) or torin 1 (Torin, 250 nM, 3 h), or starved in EBSS (2 h). Endogenous ATG5 protein was immunoprecipitated from cell extracts using anti-ATG5 antibodies that were coupled to protein A Plus beads. Anti-ATG5 and anti-RACK1 antibodies were used for immunoblotting. Serum, control rabbit serum. D, HEK293T cells were cultured on coverslides. They were treated or not with rapamycin (Rapa, 200 nM, 16 h) or torin 1 (Torin, 250 nM, 3 h), or starved in EBSS (Stv, 2 h) or not. Then endogenous proteins were immunostained using anti-RACK1 and anti-ATG5 primary antibodies. Anti-mouse IgG Alexa Fluor 488 (green) and anti-rabbit IgG Alexa Fluor 568 (red) were used as secondary antibodies, respectively. Cells were analyzed under confocal microscope. CNT, non-treated cells; Merge, overlay of green and red signals. White arrows show yellow cytoplasmic dots with RACK1 and ATG5 colocalization. E, HEK293T cells were cultured on coverslides. Cells were treated or not with rapamycin (Rapa, 200 nM, 16 h) or torin 1 (Torin, 250 nM, 3 h), or starved in EBSS (Stv, 2 h) or not. Then endogenous proteins were immunostained by using anti-RACK1 and anti-LC3 primary antibodies. Cells were analyzed under a confocal microscope. CNT, non-treated cells; Merge, overlay of green and red signals. White arrows show yellow cytoplasmic dots with RACK1 and LC3 co-localization.
mTOR kinase resulted in a decrease in RACK1-ATG5 interac-tion (Fig. 5A). In line with data obtained using chemical inhib-itors, knockdown of mTOR using specific shRNAs resulted in an increase in RACK1-ATG5 interaction (Fig. 5B).
p70S6 kinase is a major serine/threonine kinase that func-tions downstream to mTOR. To check whether p70S6K played a role in the regulation of RACK1-ATG5 interaction, we first overexpressed a wild-type kinase (21). Indeed, overexpression of the kinase led to the dissociation of RACK1 from ATG5 (Fig. 5C). To further confirm that p70S6K protein itself was neces-sary for the observed effects on the interaction, we transfected cells with specific siRNAs. Indeed, knockdown of p70S6K pro-moted association of RACK1 with its partner ATG5 (Fig. 5D). All these results showed that RACK1-ATG5 interaction is reg-ulated by mTOR in a p70S6K-dependent manner.
Determination of RACK1 Amino Acid Residues That Are Critical for the Interaction—In a study searching for S6 kinase
targets using a phospho-proteomics screen, Jastrzebski et al. (22) found that four serine or threonine residues in RXX(S/T) consensus sequences on RACK1 could be phosphorylated in a rapamycin-sensitive and S6 kinase-dependent manner. When we compared RACK1 amino acid sequences from different organisms from yeast to man, we observed that three of these consensus sequences were highly conserved (consensus sequences containing residues Thr-39, Ser-63, and Thr-128) (Fig. 6A). We have mutated these Ser/Thr residues to alanine mimicking the dephosphorylated state (Fig. 6B), or to aspartic acid mimicking the phosphorylated state. We then performed ATG5 immunoprecipitation assays and checked its interaction with wild-type (WT) or alanine mutant RACK1 proteins FIGURE 4. RACK1 is required for mTOR inhibition and starvation-induced autophagy, but it is not an autophagy target. A, HEK293T cells were cultured on coverslides and transfected with siRACK1 or control siRNA (CNT siRNA). 48 h post-transfection, cells were treated or not (⫺) with rapamycin (Rapa, 200 nM, 16 h) or starved in EBSS (2 h) in the presence or absence of BafA (100 nM, 1 h). Endogenous LC3 proteins were immunostained using anti-LC3 primary antibodies and anti-rabbit IgG Alexa Fluor 488 secondary antibodies. LC3 dot positive cells were quantified as percentage of autophagic cells in total cell population (mean⫾ S.D. of independent experiments, n ⫽ 3, *, p ⬍ 0.05; **, p ⬍ 0.01). Endogenous protein expression levels were checked in cell extracts from the same experiments using anti-p62, anti-LC3, and anti-RACK1 antibodies. Molecular mass is shown in kilodaltons (kDa).-Actin was used as loading control. Band intensities were quantified using ImageJ. B, representative immunofluorescence pictures of LC3 quantification experiments in A. (⫺), non-treated cells. White
arrows show LC3 dots. C, HEK293T cells were treated with rapamycin (200 nM) for 12 or 24 h or with carrier DMSO (D, 24 h) or starved for 2, 4, or 8 h in EBSS or cultured in full medium (CNT) with or without of BafA (100 nM, 1 h) in the presence of translation inhibitor cycloheximide (0.5g/ml). Immunoblots were performed using anti-p62, anti-RACK1, or anti-LC3 antibodies.-Actin was used as loading control. D, HEK293T cells were treated with rapamycin (200 nM) for 12 or 24 h or with carrier DMSO (D, 24 h) or starved for 2, 4, or 8 h in EBSS or cultured in full medium (CNT) with or without of BafA (100 nM, 1 h) in the absence of translation inhibitor cycloheximide. Immunoblots were performed using anti-p62, anti-RACK1, or anti-LC3 antibodies.-Actin was used as loading control.
(T39A, S63A, or T128A mutants). As shown in Fig. 6C, although the interaction of ATG5 was prominently increased with RACK1 T39A and T128A mutants, S63A mutation com-pletely abolished RACK1-ATG5 binding.
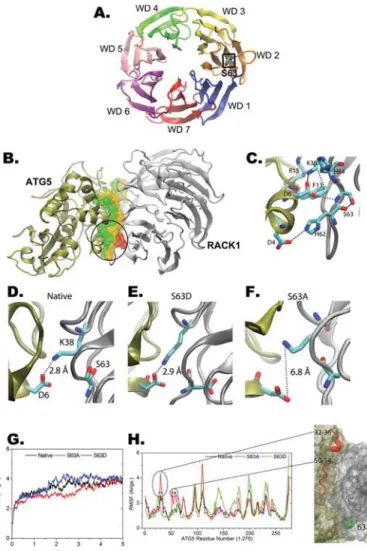
RACK1 Ser-63 residue is located in the WD40 repeat 2 region (Fig. 7A). We used docking and MD simulations to deci-pher molecular mechanisms of the interaction between RACK1 and ATG5, and particularly the role of Ser-63 in this interac-tion. Haddock (High Ambiguity-Driven protein-protein dock-ing) is among the most widely used protein-protein docking algorithms. The tool proved itself for prediction of structures of unknown protein-protein complexes. Using that tool, RACK1-ATG5 was modeled, and the residues found within 3 Å of the other subunit were selected as the binding interface (Fig. 7B, ATG5 residues are in green and RACK1 are in yellow). The predicted protein-protein complex structure was found to pos-sess a network of salt bridge interactions that were formed by Asp-4 –His-62, Asp-6 –Lys-38, Asp-163–His-64, of which neg-atively charged aspartic acids belong to ATG5, and positively charged residues (Lys and His) belong to RACK1 (Fig. 7C). Moreover, the backbone amide group of Ser-63 in RACK1 forms a hydrogen bond with one of the O␦ of Asp-6 in ATG5
(Fig. 7C). Along with this direct involvement of Ser-63 in RACK1-ATG5 interactions, Ser-63 might indirectly contribute to salt bridge interactions by taking part in positioning the his-tidines (62 and 64) of RACK1. Overall, the data presented here unveil a network of interactions in which a pivotal role for Ser-63 might be suggested.
Further structural information about the role of Ser-63 of RACK1 was collected from MD simulations of the native Ser-63 or S63A and S63D mutant complexes. The r.m.s.d. of backbone atoms of the complex converged to a plateau and oscillated less than the 2 Å range, suggesting equilibration of the protein com-plexes (Fig. 7G). Moreover, the simulation data showed that S63A mutation led to the loss of Asp-6-Lys-38 interaction, whereas the native and S63D complexes possessed the Asp-6-Lys-38 interaction (Fig. 7, D–F). In line with these observations, fluctuations of ATG5 in the S63A complex have increased, par-ticularly for the regions 32–36 and 50 –54, that were also found at the binding interface (Fig. 7H). Increased mobility of the interface in the S63A mutant indicated destabilization of the complex compared with native Ser-63 and S63D complexes (Fig. 7H). Overall, computational analyses confirmed the role played by Ser-63 and also provided insights into the molecular machinery of RACK1-ATG5 interaction.
RACK1-ATG5 Interaction Was Necessary for mTOR Inhibi-tion- or StarvaInhibi-tion-induced Autophagy—To check whether
RACK1-ATG5 interaction is important for autophagy activa-tion or not, we expressed wild-type, S63A, or S63D mutant RACK1 N2A cells (Fig. 8, A–D), and we quantified autophagy activation by torin 1 and starvation in the absence or presence of bafilomycin A. LC3 dot quantification under control condi-tions (pcDNA3 expression) showed that torin 1 and starvation led to a strong and clear autophagy activation (2 to 3 times basal level) (Fig. 8, A–D). Interestingly, although wild-type RACK1 or S63D mutant expression further increased the amplitude of torin 1 or starvation-induced autophagy and LC3-II formation on immunoblots, expression of the S63A mutant significantly and reproducibly inhibited LC3 dot numbers in cells and LC3-II formation in blots (Fig. 8, A–D). Bafilomycin A treat-ment under these conditions did not prominently lead to accu-mulation of LC3 dots, yet in blots an increase in LC3-II levels was observed in wild-type RACK1 or S63D mutants expressing cell extracts. No significant LC3-II accumulation was observed in the S63A mutant expressing cells following bafilomycin A treatment, underlining the fact that autophagosome formation was perturbed by this mutant.
We also tested whether wild-type RACK1 or its mutants could rescue autophagic activity in cells with RACK1 knock-down. However, the wild-type protein or the S63D mutant could reverse autophagy inhibition that was observed following RACK1 knockdown, and the S63A mutant did not show the same effect (Fig. 9, B and C). Inhibition of lysosomal protease activity with E64d/pepstatin A led to an accumulation of LC3-II in wild-type protein or the S63D mutant-transfected cells but not in cells expressing the S63A mutant (Fig. 9B). There-fore, the S63A mutant that does bind ATG5 was unable to rescue an autophagy defect caused by endogenous RACK1 down-regulation.
FIGURE 5. Role of mTOR-p70S6K pathway in the regulation of
RACK1-ATG5 interaction. A, HEK293T cells were cotransfected with FLAG-RACK1-ATG5
and/or non-tagged RACK1 constructs and/or an mTOR construct. IP were performed using FLAG beads. Anti-mTOR, ATG5, and RACK1 anti-bodies were used for immunoblotting. Input, total cell extract; IgG, immuno-globulin G. Molecular mass is shown in kilodaltons (kDa).-Actin was used as loading control. Band intensities were quantified using ImageJ. B, HEK293T cells were cotransfected with FLAG-RACK1 and/or non-tagged ATG5 con-structs and/or an shmTOR construct. IP were performed using FLAG beads. Anti-mTOR, anti-ATG5, and anti-RACK1 antibodies were used for immuno-blotting. C, HEK293T cells were cotransfected with FLAG-RACK1 and/or non-tagged ATG5 and/or p70S6K wild-type (WT) constructs. IP were performed using FLAG beads. Anti-p70S6K, anti-ATG5, and anti-RACK1 antibodies were used for immunoblotting. D, HEK293T cells were cotransfected with FLAG-ATG5 and non-tagged RACK1 constructs and/or sip70S6 RNAi. Anti-p70S6K, anti-ATG5, and anti-RACK1 antibodies were used for immunoblotting.
These results clearly showed that RACK1-ATG5 interaction is required for autophagy induction by classical autophagy inducing stimuli, i.e. mTOR inhibition and starvation.
Discussion
In this study, we showed that RACK1 protein is an interac-tion partner of the key autophagy protein ATG5. We confirmed this observation using various independent techniques, i.e. yeast two-hybrid, co-immunoprecipitation tests, confocal microscopy, SILAC analyses, and gel filtration assays, and we validated our results in three different cell lines (HEK293T, MEF, and Neuro2A). In fact, we showed that endogenous RACK1 was included in a previously reported autophagy-re-lated 669 – 800-kDa protein complex containing ATG12-5-16 (19).
Importantly, RACK1-ATG5 interaction was a dynamic one. Treatment of cells with classical autophagy inducers rapamycin and torin 1 (mTOR inhibitors) and starvation stimulated RACK1-ATG5 interaction in cytoplasmic dot-like structures, indicating that under autophagy-inducing conditions, the interaction occurred on ATG5 containing isolation mem-branes. Indeed in previous proteomics analyses, RACK1 was detected in isolated LC3-positive autophagic vesicles (23). To rule out the possibility that RACK1 protein itself could be an autophagy target, we performed kinetic autophagy experiments in the absence or presence of the protein translation inhibitor cycloheximide and bafilomycin A. We observed no significant degradation even at latest time points. Therefore, RACK1 is not
an autophagy target protein, and its association with the autophagy machinery should have a functional role.
In line with this idea, we observed that RACK1 was required for autophagic vesicle formation, and knockdown of RACK1 attenuated formation of LC3-positive autophagosomes. Inter-action of RACK1 with ATG5 was a key event in autophagy regulation. A mutant RACK1 that could no longer interact with ATG5 (the S63A mutant) blocked autophagy induced by mTOR inhibitors or starvation. Data presented here showed that RACK1 is an essential component of the autophagy machinery, and its interaction with ATG5 is a critical event that recruits it to the autophagy pathway.
The mTOR signaling pathway is one of the major regulators of autophagy. mTOR kinase complexes sense various upstream stimuli (ATP or amino acid depletion, growth factor depriva-tion, etc.) and serve as master regulators of cellular anabolic and catabolic pathways. For example, under nutrient- and growth factor-rich conditions, activation of mTOR complex 1 (mTORC1) results in the phosphorylation and activation of the p70S6K and eIF4BP (eukaryotic translation initiation factor-4E binding protein), stimulating protein synthesis and cell survival (24). Conversely, inhibition of mTOR strongly activates autophagic protein degradation. In our system, overexpression of the mTOR kinase or p70S6K led to the dissociation of the RACK1-ATG5 complex. In addition to data obtained using mTOR inhibitors rapamycin and torin 1, knockdown of the mTOR kinase itself or p70S6K stimulated RACK1-ATG5 asso-FIGURE 6. Determination of RACK1 amino acid residues that are critical for the interaction. A, Clustal Omega alignments of RACK1 protein sequences. Putative p70S6K target RXX(S/T) consensus sequences are highlighted in black boxes. Ser/Thr residue numbers are marked according to Homo sapiens protein sequences. RACK1 GenBankTM
reference sequences are as follows: H. sapiens, NP_006089; Mus musculus, NP_032169; Danio rerio, NP_571519; Drosophila
melanogaster, AAB72148; Caenorhabditis elegans, NP_501859; Saccharomyces cerevisiae, NP_013834. B, schematic depiction of RACK1 constructs. WD1–7,
WD40 domains 1–7. WT RACK1, wild-type RACK1. T39A, S63A, or T128A, mutant RACK1 constructs. Mutated residues were marked. C, HEK293T cells were cotransfected with FLAG-ATG5, non-tagged WT RACK1 or T39A, S63A, T128A RACK1 mutant constructs. IPs were performed using FLAG beads. Anti-ATG5 and anti-RACK1 antibodies were used for immunoblotting. Input, total cell extract; IgG, immunoglobulin G. Molecular mass is shown in kilodaltons (kDa).-Actin was used as loading control. Band intensities were quantified using ImageJ.
ciation. Our results indicate that RACK1-ATG5 association control is one of the mechanisms used by the mTORC1-p70S6 kinase pathway to regulate autophagy.
In fact, RACK1 Ser-63 and other residues, including Thr-39 and Thr-128, were previously suggested to be targets of S6 kinase isoforms (22). Conversion of Ser-63 to alanine (S63A mutation) on RACK1, mimicking a non-phosphorylated form,
was sufficient to abolish RACK1-ATG5 interaction and to inhibit mTOR-related or starvation-induced autophagy. More-over, the S63A mutant could not rescue autophagy inhibition following RACK1 knockdown. On the one hand, T39A/T39D or T128A/T128D mutants did not dissolve the RACK1-ATG5 complex. On the other hand, RACK1 T39A and T128A muta-tions did result in an increased interaction. Yet, different from the S63A mutant, expression of T39A and T128A mutants or their phospho-mimicking aspartic acid (T39D and T128D) forms did not lead to any change in the autophagic activity.11 These results indicated that, an optimum level of RACK1-ATG5 interaction is necessary and sufficient for autophagy.
Our results showed that both mTOR and p70S6K proteins were necessary for the regulation of RACK1-ATG5 interaction, and overexpression of kinase-active mTOR or p70S6K proteins had an inhibitory effect on complex formation. Nevertheless, our studies using mutants did not confirm autophagy-related relevance of a direct phosphorylation of RACK1 on previously reported p70S6K putative target residues (22). On the contrary, modification of a critical serine to a non-phosphorylatable form (S63A) was the only mutation that had a significant effect on autophagy activation. Therefore, further studies are required to determine kinase(s) or phosphate(s) that are downstream from mTOR and that regulate autophagy through modulation of this interaction. Overall, we showed that RACK1-ATG5 interaction is indispensable for autophagic activity.
Another question is about the role of RACK1 in the autophagy pathway. RACK1 is a scaffold/adaptor protein con-taining WD40 repeats that are important for protein-protein interactions. Of note, RACK1 was not required for ATG12-ATG5 or ATG12-5-16 protein complex formation.11 There-fore, RACK1 possibly functions in the recruitment of other rel-evant proteins to autophagic isolation membranes near ATG12-5-16 complexes. Future analyses, including SILAC assays, will allow the discovery of proteins whose interaction increases with RACK1 under autophagy-inducing conditions.
In fact, involvement of RACK1 was suggested in Drosophila studies where loss of RACK1 was associated with attenuated autophagy responses and glycogen storage defects (14). While our manuscript was in preparation, Zhao et al. (15) showed that RACK1 was required for hepatocyte autophagy and lipophagy. They also provided data about the contribution of RACK1 as a scaffold to VPS34 PI3K complex formation. It is possible that RACK1 plays a role at different stages of autophagosome bio-genesis. In our hands, an ATG5-binding deficient mutant of RACK1 was able to block autophagy, indicating that ATG5-related functions of the scaffold protein are also rate-limiting for autophagy activation.
In this study, we characterized RACK1 as a new ATG12-5-16 complex component and a novel mTOR-dependent hub in the regulation of basic autophagy pathways. Overall, we believe that our results will open the way to a more comprehensive understanding of autophagy pathway and its molecular control mechanisms.
11S. Erbil and D. Gozuacik, unpublished results.
FIGURE 7. RACK1-ATG5 interaction model. A, schematic representation of human RACK1 (Protein Data Bank code 4AOW). Each WD40 domain (WD1–7) is in a different color. The seven-bladed-propeller structure is shown. Loca-tion of the Ser-63 residue is marked in a square. B, schematic model of RACK1 (Protein Data Bank code 4AOW, silver color) and ATG5 (Protein Data Bank code 4GDK, tan color) interaction. Residues found within 3 Å of the other subunit are selected as binding interface that was rendered in the wire frame surface model (probe radius, 1.4 Å) by coloring ATG5 residues in green and RACK1 in
yellow. The region around the Ser-63 residue of RACK1 is shown in a red wire
frame and encircled. C, interaction network of predicted RACK1-ATG5 model.
D–F, native and mutated RACK1s (S63A and S63D) were energy-minimized
and equilibrated in MD simulations. Snapshots of the binding interface are shown with Ser-63, Asp-6, and Lys-38 in licorice models (C, cyan; O, red; N,
blue). Structural integrity of binding interface was probed by the distance of
the ionic interaction between Asp-6 of ATG5 and Lys-38 of RACK1. Although the wild-type (native) and S63D complexes possessed an intact binding sur-face with Asp-6 –Lys-38 ionic pairing (D and E), S63A showed an extension in Asp-6 –Lys-38 distance (F), implying a weakened interaction of RACK1 and ATG5. G, r.m.s.d. of the backbone atoms carbon, nitrogen, and␣-carbon.
Native, wild-type RACK1; S63A, S63A RACK1; S63D, S63D RACK1. H,
fluctua-tions of ATG5 during 5 ns of MD simulafluctua-tions. S63A RACK1 mutant displayed increased fluctuations at two distinct regions (residues from 32 to 36 and from 50 to 54), which are found at the binding interface (right panel), the observation that suggests that S63A RACK1 destabilizes the ATG5-RACK1 complex.
Experimental Procedures
Plasmid Constructs, siRNAs—To create the pGBKT7-ATG5
yeast two-hybrid bait construct, full-length human ATG5 cDNA insert in the pCI-ATG5 construct was cut with SmaI enzyme, blunted, and blunt-ligated into the pGBKT7 Y2H bait vector that was previously cut with NcoI and Klenow-filled. FLAG-tagged human ATG5 (RC235557), human RACK1 (SC116322), and FLAG-tagged human RACK1 plasmids (RC505092) were purchased from Origene. Wild-type (WT) p70S6K plasmid (8984) (21), WT mTOR plasmid (26036) (25), and shmTOR plasmid (1855) (26) were all provided by Add-gene. siRNA RACK1 (M-006876-01) and CNT-siRNA (D-001210-01-20) were purchased from Dharmacon.
Site-directed in Vitro Mutagenesis—Site-directed
mutagene-sis of Thr-39, Ser-63, and Thr-128 residues of RACK1 was performed using QuikChange site-directed mutagenesis kit according to the manufacturer’s instructions (Stratagene, cata-log no. 200519-5). The following primers were used for mutagenesis: S63D forward, ctgcggggtcacgaccactttgttagt, and S63D reverse, actaacaaagtggtcgtgaccccgcag; S63A forward, ctg-cggggtcacgcccactttgttagt, and S63A reverse, actaacaaagtgggcgtga-ccccgcag; T39D forward, ctctccgcctctcgagataaggacatcatcatgtgg, and T39D reverse, ccacatgatgatgtccttatctcgagaggcggagag; T39A forward, atcctctccgcctctcgagataaagccatcatcatgtggaaa, and T39A reverse, tttccacatgatgatggctttatctcgagaggcggagaggat; T128D for-ward, attgtctctggatctcgagataaagacatcaagctatggaat, and T128D FIGURE 8. RACK1-ATG5 interaction is necessary for mTOR inhibition- or starvation-induced autophagy in Neuro2A cells. Cells were cultured on cover-slides and transfected with the empty control vector pcDNA3 or wild-type (wt) or mutant RACK1 (S63A or S63D) constructs. A, 48 h post-transfection, Neuro2A cells were treated or not with torin 1 (Torin, 250 nM, 3 h) with or without BafA (100 nM, 1 h). Endogenous LC3 proteins were immunostained using anti-LC3 primary antibodies and anti-rabbit IgG Alexa Fluor 488 secondary antibodies. LC3 dot positive cells were quantified as percentage of autophagic cells in total cell population (mean⫾ S.D. of independent experiments, n ⫽ 3, *, p ⬍ 0.05). LC3 and RACK1 protein expression levels in cell lysates were checked in immunoblots using anti-LC3 and anti-RACK1 antibodies.-Actin was used as loading control. B, representative immunofluorescence pictures of LC3 quanti-fication experiments in A. White arrows show LC3 dots. C, 48 h post-transfection, Neuro2A cells were cultured in full medium (non-STV) or starved in EBSS (STV, 2 h) with or without BafA (100 nM, 1 h). Endogenous LC3 proteins were immunostained using anti-LC3 primary antibodies and anti-rabbit IgG Alexa Fluor 488 secondary antibodies. LC3 dot positive cells were quantified (mean⫾ S.D. of independent experiments, n ⫽ 3, **, p ⬍ 0.01; *, p ⬍ 0.05). LC3 and RACK1 protein expression levels in cell lysates were checked in immunoblots using anti-LC3 and anti-RACK1 antibodies.-Actin was used as loading control. D, representative immunofluorescence pictures of LC3 quantification experiments in C. White arrows show LC3 dots.
reverse, attccatagcttgatgtctttatctcgagatccagagacaat; and T128A forward, attgtctctggatctcgagataaagccatcaagctatggaat, and T128A reverse, attccatagcttgatggctttatctcgagatccagagacaat.
Y2H Screen—For screening, pGBKT7-ATG5 construct was
used as bait, and a thymus cDNA library in the pACT2 vector
was used as prey (Clontech). Screens were performed according to the protocols provided by the manufacturer. Briefly, constructs were transformed into the AH109 yeast strain, and interactions were monitored on selection plates lacking leucine, tryptophan, histidine, and/or adenine. After 3–5 days of selection, plasmid inserts in surviving col-onies were amplified using colony PCR, sequenced, and characterized.
Cell Culture—HEK293T human embryonic kidney cells and
MEFs were maintained in DMEM high glucose medium (Sigma, catalog no. 5671), and Neuro2A (N2A) mouse neuro-blast cells were maintained in DMEM low glucose medium (Sigma, catalog no. 5546) in a 5% CO2-humidified incubator at 37 °C. Culture media were supplemented with 10% heat-inacti-vated fetal bovine serum (Biowest, catalog no. S1810-500), anti-biotics (50 units/ml penicillin and 50g/ml streptomycin; Bio-logical Industries, catalog no. 03-031-1B), andL-glutamine (2
mM, Biological Industries, catalog no. BI03-020-1B). In
starva-tion experiments, cells were grown in Earle’s balanced salt solu-tion (EBSS; Biological Industries, BI02-010-1A). For chemical induction of autophagy, cells were incubated in media contain-ing torin 1 (250 nM, Tocris, catalog no. 4247) or rapamycin (200
nM, Sigma, catalog no. R0395) that were dissolved in DMSO
(Sigma, catalog no. VWRSAD2650). Cycloheximide (0.5g/ml, Sigma, catalog no. 01810) was used in degradation tests. Cal-cium phosphate transfection method was used for gene transfer into HEK293T cells according to standard protocols. N2A cells were transfected using polyethyleneimine (PolySciences Inc., catalog no. 23966) according to protocols that were described elsewhere (27).
Cell Lysate Preparation and Immunoblotting—Cells were
washed in PBS and collected by centrifugation, and lysates were prepared in RIPA buffer (25 mMTris, 125 mMNaCl, 1% Nonidet
P-40, 0.1% SDS, 0.5% sodium deoxycholate, 0.004% sodium azide, pH 8.0) containing complete protease inhibitors (Sigma, catalog no. P8340) and 1 mMPMSF (Sigma, catalog no. P7626).
Protein concentrations were determined using the Bradford assay (Sigma, catalog no. B6916). Immunoblotting procedure was described previously (28). Immunoblots were performed using antibodies against ATG5 (Sigma, catalog no. A0856), RACK1 (Santa Cruz Biotechnology, catalog no. sc-17754), ATG16L1 (MBL, catalog no. PM040), LC3B (Novus, catalog no. NB100-2331), mTOR (Cell Signaling, catalog no. 2972), p70S6K (Cell Signaling, catalog no. 9206S), p62 (Abnova, cata-log no. H00008878), LC3 (Novus, catacata-log no. 2331), and-actin (Sigma, catalog no. A5441). ImageJ software was used to quan-tify protein band intensities (29).
Immunoprecipitation Tests—For the immunoprecipitation
of FLAG-tagged proteins, whole cell lysates (1 mg) were incu-bated with an anti-FLAG M2 affinity gel (Sigma, catalog no. A2220). For the immunoprecipitation of endogenous RACK1 or ATG5, protein G Plus-agarose beads (Santa Cruz Biotech-nology, catalog no. sc-2002) or protein A Plus-agarose beads (Santa Cruz Biotechnology, catalog no. sc-2001) were cou-pled to 10 g/ml anti-RACK1 or anti-ATG5 antibodies, respectively. Normal rabbit serum (Santa Cruz Biotechnol-ogy, catalog no. sc-2027) or normal mouse serum (Santa Cruz Biotechnology, catalog no. sc-45051) was used as neg-FIGURE 9. Rescue experiments with RACK1 mutant constructs following
siRNA knockdown of RACK1. A, HEK293T cells were transfected with
siR-ACK1 or control siRNA (CNT siRNA). The effect of siRNAs was checked by immunoblotting using anti-RACK1 antibodies. Molecular mass is shown in kilodaltons (kDa).-Actin was used as loading control. Band intensities were quantified using ImageJ. B, HEK293T cells were grown onto coverslides and transfected with the empty control vector pcDNA3 or wild-type (wt) or mutant RACK1 (S63A or S63D) constructs. 48 h post-transfection, HEK293T cells were treated or not with torin 1 (Torin, 250 nM, 3 h) with or without E64D (E64D, 10g/ml, 1 h) and PepA (pepstatin A, 10 g/ml, 1 h). Endogenous LC3 proteins were immunostained using LC3 primary antibodies and anti-rabbit IgG Alexa Fluor 488 secondary antibodies. LC3 dot positive cells were quantified as percentage of autophagic cells in total cell population (mean⫾ S.D. of independent experiments, n⫽ 3, **, p ⬍ 0.01; *, p ⬍ 0.05). LC3 and RACK1 protein expression levels were detected by immunoblotting using anti-LC3 and anti-RACK1 antibodies.-Actin was used as loading control. C, representative immunofluorescence pictures of LC3 quantification experi-ments in A. White arrows show LC3 dots.
ative control. Samples were analyzed by immunoblotting as described.
GST Pulldown Assay—For the pulldown assays, 25l of
glu-tathione-Sepharose 48 beads (GE Healthcare, catalog no. 17-0756-01) in Tris-HCl (20 mM, pH 7.5) were initially incu-bated (overnight at 4 °C) with 5 ng of GST-tagged ATG5 recombinant protein (Abnova, H00009474). Following three washes in the same buffer, beads were incubated for 8 h at 4 °C with 5 ng of His-tagged RACK1 recombinant protein (Abcam, catalog no. ab119442). Samples were analyzed by immunoblot-ting as described.
Immunofluorescence Analyses—2⫻ 105cells were cultured on poly-L-lysine (Sigma, catalog no. P8920)-coated glass
cover-slides. Following 2 h of starvation in the EBSS medium and incubation for 3 h with torin 1 (250 nM, Tocris, catalog no. 4247)
or 16 h with rapamycin (200 nM, Sigma, catalog no. R0395), cells
were fixed in ice-cold 4% paraformaldehyde/PBS and permea-bilized in PBS with 0.1% BSA (Sigma, catalog no. A4503) and 0.1% saponin (Sigma, 84510). Immunostaining was per-formed using anti-RACK1 antibody (Santa Cruz Biotechnol-ogy, catalog no. sc-17754), anti-ATG5 antibody (Sigma, cat-alog no. A0856), or anti-LC3 antibody (Sigma, L7543) followed by incubation with anti-mouse IgG Alexa Fluor 488 (Invitrogen, catalog no. A11001), anti-rabbit IgG Alexa Fluor 488 (Invitrogen, catalog no. A11008), anti-rabbit IgG Alexa Fluor 568 (Invitrogen, catalog no. A11011). Coverslides were mounted onto glass slides, and samples were analyzed using a Carl Zeiss LSM 710 confocal microscope (Zeiss, Germany).
Quantitative LC3 Analyses—LC3 dot positivity was
quanti-fied following 2 h of starvation in the EBSS medium or 3 h of incubation with torin 1 (250 nM, Tocris, catalog no. 4247) or
16 h of incubation with rapamycin (200 nM, Sigma, R0395), in
the presence or absence of 1 h of incubation with E64D (10 g/ml, Santa Cruz Biotechnology, 201280), pepstatin A (10 g/ml, Sigma, catalog no. p5318), or bafilomycin A (100 nM,
Sigma, catalog no. B1793). 10 LC3 dots per cell were consid-ered as the threshold for basal autophagy. Minimum 150 cells were counted for each condition, and results were expressed as percentage of LC3 dot-positive cells in total cell population (30).
Gel Filtration Tests—For separation of proteins, a
Super-oseTM6 10/300 GL column (separation range 5–5000 kDa) was used (GE Healthcare, catalog no. 17-5172-01). Sigma molecular weight kit was used for the calibration of the system (Sigma, catalog no. MWGF-1000). Chromatography analyses were per-formed using an AKTA Prime FPLC system (AKTA FPLC UPC900/P920 System/Frac 900 fraction collector, GE Health-care). For separation of proteins, a modification of a previously reported protocol was used (12). Briefly, a chromatography col-umn was calibrated with sonicated balancing buffer (1:1, 0.05% glycerol PBS/RIPA buffer) to optimize flux, absorbance, and pressure parameters (pressure, 1.5 MPa; flux velocity, 0.5 ml/min; fraction volume, 0.5 ml; loop volume, 500l). Protein extracts from HEK293T or N2A cells (5–7.5 mg of protein) were loaded in a 500-l volume, and 500-l fractions were col-lected. The column was washed with 36 ml of deionized water (3⫻ column volume) and re-calibrated with sonicated
balanc-ing buffer after each sample. Immunoblottbalanc-ing of collected frac-tions was performed as described.
SILAC Labeling—Tri-SILAC labeling of FLAG-tagged
ATG5-expressing HEK293T cells was carried out using SILAC medium (DMEM without L-lysine and L-arginine (Thermo
Fisher Scientific, catalog no. 89985) supplemented with peni-cillin/streptomycin (100 units/ml, 100g/ml; PAN Biotech, catalog no. 06-07100),L-glutamine (PAN Biotech, catalog no.
P04-80100), and 10% dialyzed fetal calf serum (Gibco, 26400-044)). Heavy labeling was carried out with the addition of 42 g/ml L-arginine-13C615N4-hydrochloride (Arg-10)
(Sigma-Isotec, catalog no. 608033) and 40g/ml L-lysine-13C615N2
-hydrochloride (Lys-8) (Sigma-Isotec, catalog no. 608041). Medium labeling was performed following addition of 42 g/mlL-arginine-13C6-hydrochloride (Arg-6) (Cambridge
Iso-tope Laboratories Inc., Andover MA., catalog no. CLM-2265) and 40g/mL-lysine- 4,4,5,5-d4-hydrochloride (Lys-4)
(Sigma-Isotec, catalog no. 616192). Light labeling was achieved using corresponding non-labeled amino acidsL-arginine (Sigma,
cat-alog no. 11039) andL-lysine (Sigma, catalog no. L8662). All
three types of SILAC media were supplemented with 112g/ml
L-proline (Fluka, catalog no. 81709) (31). Labeling was
contin-ued for five cell doublings. Labels were swapped in independent experiments.
Liquid Chromatography (LC)-Tandem Mass Spectrometry (MS/MS) Sample Preparation—Labeled cells were collected by
centrifugation, washed in PBS, and lysed in a modified RIPA buffer (50 mMTris, pH 7.5, 150 mMNaCl, 1% Nonidet P-40, and
0.25% sodium deoxycholate) with complete protease inhibitors (Roche Applied Science, catalog no. 10269700). Protein con-centrations were determined using BCA assay (BCA kit, Pierce, catalog no. 23225). Overexpressed FLAG-tagged ATG5 was immunoprecipitated from 2.5 mg of whole cell lysates using an anti-FLAG M2 affinity gel (Sigma, catalog no. A2220). Beads were incubated at 75 °C for 30 min in Laemmli buffer (70% Tris/SDS, pH 6.8, 30% glycerol, 10% SDS, and bromphenol blue) with 1 mMDTT, then 5.5 mMiodoacetamide was added,
and samples were further incubated at room temperature for 30 min, allowing reduction and alkylation. Samples were separated by electrophoresis in 4 –12% Bis-Tris gels (NuPAGE威Novex, catalog no. NP0335) and using 20⫻ MOPS-SDS running buffer (NuPAGE威Novex, catalog no. NP001) with 0.07% antioxidant supplement (NuPAGE威Novex, catalog no. NP0005). The gel was incubated for 10 min in fixing solution (40% double dis-tilled H2O, 50% methanol, 10% acetic acid), and protein bands were visualized using NuPAGE威Novex Stainer solutions (NuPAGE威Novex, catalog nos. 46-7015 and 46-7016). Protein bands were cut from gels and washed in ABC buffer (100 mM
ammonium bicarbonate, pH 7.5) followed by incubation with ethanol (HPLC grade). Then, cold trypsin solution (Promega, catalog no. V511C) was added onto dried gel cubes followed by a 20-min incubation at room temperature and overnight incubation at 37 °C. Trypsin activity was blocked by adding 2% trifluoroacetic acid (TFA). Following ethanol washes, supernatants were concentrated using SpeedVac (ThermoScientific). Then Buffer A (0.5% acetic acid) and Buffer A/A* (75/25%; Buffer A*, 3% acetonitrile, 0.3% TFA) was added at a 3:1 ratio. Peptides were eluted
from StageTips with C18 material (3M Empore catalog no. 2215) using Buffer B (0.5% acetic acid, 80% acetonitrile) (32). Eluted samples were concentrated using SpeedVac, and ready-to-inject peptide samples were obtained following addition of 10l of Buffer A/A*.
LC-MS/MS—Nanoscale HPLC was performed using either
an Agilent 1200 or an Eksigent NanoLCultra connected on line to an LTQ-Orbitrap XL (Thermo Scientific) setup and a 15-cm in-house-packed fused silica emitter microcolumn (SilicaTip PicoTip; New Objective) filled with reverse-phase ReproSil-Pur C18-AQ beads with the size of 3.5 m and inner diameter of 20 m (Dr. Maisch, GmbH, Germany). Peptides were separated over a linear gradient of 10 –30% acetonitrile in 0.5% acetic acid with a flow rate of 250 nl/min. A full-scan acquisition was carried out in the FT-MS part of the mass spectrometer in the range of m/z 350 –2000 with an automatic gain control target value of 106 and at a resolution of 60,000 at m/z 400. AGC target value was set to 5000, ion selection thresholds were set to 1000 counts, and a maxi-mum fill time of 100 ms was used to sequentially perform MS/MS on the five most intense ions in the full scan (Top5) in the LTQ in a data-dependent mode. Wide band activation was enabled with an activation q⫽ 0.25 applied for 30 ms at a normalized collision energy of 35%. Unassigned or single charged ions were excluded from MS/MS. Dynamic exclu-sion was applied to reject ions from repeated MS/MS selec-tion for 45 s.
MS Data Analysis—LC-MS/MS raw files, belonging to three
biological replicates, were processed altogether in MaxQuant version 1.4.0.8 with default parameters using UniProt human database (33). MaxQuant was used to filter the identifications for a false discovery rate below 1% for peptides, sites, and pro-teins using forward-decoy searching. Match between runs was enabled.
Molecular Dynamics Simulations—MD simulations were
performed using the predicted complex structure of RACK1-ATG5 obtained from docking step and its RACK1 mutants S63A and S63D. The protein complexes were placed in water boxes with dimensions of 115⫻ 75 ⫻ 80 Å3, and then the systems were ionized with a 100 mMNaCl solution to a
neu-tral state. The resulting systems composed of⬃63,000 atoms were used in MD simulations using the NAMD program (34) with the CHARMM22 parameters (35, 36), which included a correction map for backbone atoms (37, 38). Water mole-cules within the system were treated explicitly using the TIP3P model (39). An NPT ensemble was used in MD sim-ulations with periodic boundary conditions, and the long range Coulomb interactions were computed using the parti-cle-mesh Ewald algorithm. Pressure was maintained at 1 atm, and temperature was maintained at 310 K using the Langevin pressure and temperature coupling. A time step of 2 fs was used in all MD simulations. The systems are fully energy-minimized in 20,000 steps and equilibrated under constant temperature and volume for 5 ns. Visual molecular dynamics was used for the analysis of trajectories and visu-alization of all of the structures. The r.m.s.d. for the back-bone atoms (carbon, nitrogen, and␣-carbon) and residue-wise root mean square fluctuations of C␣ atoms were
calculated as measures of equilibration and flexibility, respectively.
Author Contributions—D. G. supervised and coordinated the study
and wrote the paper with S. E. S. E. performed the experiments shown in Figs. 1– 6, 8, and 9. O. O. and G. M. contributed to the experiments shown in Fig. 1, C and D. C. K. contributed to the opti-mization of gel filtration-FPLC tests. E. D. T. and O. U. S. carried out three-dimensional modeling and docking studies. E. G. M. contrib-uted to three-dimensional modeling studies. G. G. and F. G. per-formed Y2H screens and initial co-IP confirmations. J. D. supervised SILAC analyses that were performed by S. E. All authors reviewed the results and approved the final version of the manuscript.
Acknowledgments—Human pCI-ATG5 vector was kindly provided by Noboru Mizushima and Cherry-tagged ATG5 construct by Jae-Won Soh. Wild-type p70S6K (Addgene, catalog no. 8984) and p70S6K-F5A-E389-R3A (Addgene, catalog no. 8991) plasmids were kindly provided by John Blenis. WT mTOR (Addgene, catalog no. 26036) and shmTOR (Addgene, catalog no. 1855) plasmids were kindly provided by Fuyuhiko Tamanoi and David Sabatini, respec-tively. The N2A cell line was a kind gift from Mathieu Bollen.
References
1. Gozuacik, D., and Kimchi, A. (2004) Autophagy as a cell death and tumor suppressor mechanism. Oncogene 23, 2891–2906
2. Levine, B., and Klionsky, D. J. (2004) Development by self-digestion: mo-lecular mechanisms and biological functions of autophagy. Dev. Cell 6, 463– 477
3. Rubinsztein, D. C., Mariño, G., and Kroemer, G. (2011) Autophagy and aging. Cell 146, 682– 695
4. Xie, Z., and Klionsky, D. J. (2007) Autophagosome formation: core ma-chinery and adaptations. Nat. Cell Biol. 9, 1102–1109
5. Walker, S., Chandra, P., Manifava, M., Axe, E., and Ktistakis, N. T. (2008) Making autophagosomes: localized synthesis of phosphatidylinositol 3-phosphate holds the clue. Autophagy 4, 1093–1096
6. Mizushima, N., Yoshimori, T., and Ohsumi, Y. (2011) The role of Atg proteins in autophagosome formation. Annu. Rev. Cell Dev. Biol. 27, 107–132 7. Ohsumi, Y., and Mizushima, N. (2004) Two ubiquitin-like conjugation
systems essential for autophagy. Semin. Cell Dev. Biol. 15, 231–236 8. Hanada, T., Noda, N. N., Satomi, Y., Ichimura, Y., Fujioka, Y., Takao, T.,
Inagaki, F., and Ohsumi, Y. (2007) The Atg12-Atg5 conjugate has a novel E3-like activity for protein lipidation in autophagy. J. Biol. Chem. 282, 37298 –37302
9. Kabeya, Y., Mizushima, N., Ueno, T., Yamamoto, A., Kirisako, T., Noda, T., Kominami, E., Ohsumi, Y., and Yoshimori, T. (2000) LC3, a mamma-lian homologue of yeast Apg8p, is localized in autophagosome mem-branes after processing. EMBO J. 19, 5720 –5728
10. Mizushima, N., and Levine, B. (2010) Autophagy in mammalian develop-ment and differentiation. Nat. Cell Biol. 12, 823– 830
11. Levine, B., and Kroemer, G. (2008) Autophagy in the pathogenesis of disease. Cell 132, 27– 42
12. Mizushima, N., Kuma, A., Kobayashi, Y., Yamamoto, A., Matsubae, M., Takao, T., Natsume, T., Ohsumi, Y., and Yoshimori, T. (2003) Mouse Apg16L, a novel WD-repeat protein, targets to the autophagic isolation membrane with the Apg12-Apg5 conjugate. J. Cell Sci. 116, 1679 –1688 13. Tooze, S. A., Dooley, H. C., Jefferies, H. B., Joachim, J., Judith, D., Lamb,
C. A., Razi, M., and Wirth, M. (2015) Assessing mammalian autophagy.
Methods Mol. Biol. 1270, 155–165
14. Erdi, B., Nagy, P., Zvara, A., Varga, A., Pircs, K., Ménesi, D., Puskás, L. G., and Juhász, G. (2012) Loss of the starvation-induced gene Rack1 leads to glycogen deficiency and impaired autophagic responses in Drosophila.
Autophagy 8, 1124 –1135
Han, K., Cheng, Q., Shen, B., Chen, Y., Zhang, W. J., Ma, Y., and Zhang, J. (2015) RACK1 promotes autophagy by enhancing the Atg14L-Beclin 1-Vps34-Vps15 complex formation upon phosphorylation by AMPK. Cell
Rep. 13, 1407–1417
16. Zhu, J., Chen, X., Song, Y., Zhang, Y., Zhou, L., and Wan, L. (2016) Deficit of RACK1 contributes to the spatial memory impairment via upregulating BECLIN1 to induce autophagy. Life Sci. 151, 115–121
17. Csukai, M., Chen, C. H., De Matteis, M. A., and Mochly-Rosen, D. (1997) The coatomer protein⬘-COP, a selective binding protein (RACK) for protein kinase Cepsilon. J. Biol. Chem. 272, 29200 –29206
18. Li, J. J., and Xie, D. (2015) RACK1, a versatile hub in cancer. Oncogene 34, 1890 –1898
19. Ishibashi, K., Fujita, N., Kanno, E., Omori, H., Yoshimori, T., Itoh, T., and Fukuda, M. (2011) Atg16L2, a novel isoform of mammalian Atg16L that is not essential for canonical autophagy despite forming an Atg12–5-16L2 complex. Autophagy 7, 1500 –1513
20. Shibutani, S. T., and Yoshimori, T. (2014) A current perspective of au-tophagosome biogenesis. Cell Res. 24, 58 – 68
21. Schalm, S. S., and Blenis, J. (2002) Identification of a conserved motif required for mTOR signaling. Curr. Biol. 12, 632– 639
22. Jastrzebski, K., Hannan, K. M., House, C. M., Hung, S. S., Pearson, R. B., and Hannan, R. D. (2011) A phospho-proteomic screen identifies novel S6K1 and mTORC1 substrates revealing additional complexity in the signaling network regulating cell growth. Cell. Signal. 23, 1338 –1347 23. Dengjel, J., Hoyer-Hansen, M., Nielsen, M. O., Eisenberg, T., Harder,
L. M., Schandorff, S., Farkas, T., Kirkegaard, T., Becker, A. C., Schroeder, S., Vanselow, K., Lundberg, E., Nielsen, M. M., Kristensen, A. R., Akimov, V., et al. (2012) Identification of autophagosome-associated proteins and regulators by quantitative proteomic analysis and genetic screens. Mol.
Cell. Proteomics 11, M111.014035
24. Chantranupong, L., Wolfson, R. L., and Sabatini, D. M. (2015) Nutrient-sensing mechanisms across evolution. Cell 161, 67– 83
25. Sato, T., Nakashima, A., Guo, L., Coffman, K., and Tamanoi, F. (2010) Single amino-acid changes that confer constitutive activation of mTOR are discovered in human cancer. Oncogene 29, 2746 –2752
26. Sarbassov, D. D., Guertin, D. A., Ali, S. M., and Sabatini, D. M. (2005) Phosphorylation and regulation of Akt/PKB by the rictor-mTOR com-plex. Science 307, 1098 –1101
27. Oral, O., Cıkım, T., Zuvin, M., Unal, O., Yagci-Acar, H., Gozuacik, D., and Kos¸ar, A. (2015) Effect of varying magnetic fields on targeted gene delivery
of nucleic acid-based Molecules. Ann. Biomed. Eng. 43, 2816 –2826 28. Itah, Z., Oral, O., Perk, O. Y., Sesen, M., Demir, E., Erbil, S., Dogan-Ekici,
A. I., Ekici, S., Kosar, A., and Gozuacik, D. (2013) Hydrodynamic cavita-tion kills prostate cells and ablates benign prostatic hyperplasia tissue. Exp.
Biol. Med. 238, 1242–1250
29. Nanes, B. A. (2015) Slide Set: Reproducible image analysis and batch pro-cessing with ImageJ. BioTechniques 59, 269 –278
30. Korkmaz, G., Tekirdag, K. A., Ozturk, D. G., Kosar, A., Sezerman, O. U., and Gozuacik, D. (2013) MIR376A is a regulator of starvation-induced autophagy. PLoS ONE 8, e82556
31. Dengjel, J., Kratchmarova, I., and Blagoev, B. (2010) Mapping protein-protein interactions by quantitative proteomics. Methods Mol. Biol. 658, 267–278
32. Rappsilber, J., Mann, M., and Ishihama, Y. (2007) Protocol for micro-purification, enrichment, pre-fractionation and storage of peptides for proteomics using StageTips. Nat. Protoc. 2, 1896 –1906
33. Cox, J., and Mann, M. (2008) MaxQuant enables high peptide identifica-tion rates, individualized p.p.b.-range mass accuracies and proteome-wide protein quantification. Nat. Biotechnol. 26, 1367–1372
34. Phillips, J. C., Braun, R., Wang, W., Gumbart, J., Tajkhorshid, E., Villa, E., Chipot, C., Skeel, R. D., Kalé, L., and Schulten, K. (2005) Scalable molec-ular dynamics with NAMD. J. Comput. Chem. 26, 1781–1802
35. Brooks, B. R., Brooks, C. L., 3rd, Mackerell, A. D., Jr., Nilsson, L., Petrella, R. J., Roux, B., Won, Y., Archontis, G., Bartels, C., Boresch, S., Caflisch, A., Caves, L., Cui, Q., Dinner, A. R., Feig, M., et al. (2009) CHARMM: the biomolecular simulation program. J. Comput. Chem. 30, 1545–1614 36. MacKerell, A. D., Bashford, D., Bellott, M., Dunbrack, R. L., Evanseck, J. D.,
Field, M. J., Fischer, S., Gao, J., Guo, H., Ha, S., Joseph-McCarthy, D., Kuchnir, L., Kuczera, K., Lau, F. T., Mattos, C., et al. (1998) All-atom empirical potential for molecular modeling and dynamics studies of pro-teins. J. Phys. Chem. B 102, 3586 –3616
37. Feig, M., MacKerell, A. D., Jr., and Brooks, C. L. (2003) Force field influ-ence on the observation of-helical protein structures in molecular dy-namics simulations. J. Phys. Chem. B 107, 2831–2836
38. MacKerell, A. D., Jr., Feig, M., and Brooks, C. L., 3rd. (2004) Improved treatment of the protein backbone in empirical force fields. J. Am. Chem.
Soc. 126, 698 – 699
39. Jorgensen, W. L., and Madura, J. D. (1983) Quantum and statistical me-chanical studies of liquids. 25. Solvation and conformation of methanol in water. J. Am. Chem. Soc. 105, 1407–1413