HAL Id: hal-01635818
https://hal.univ-lorraine.fr/hal-01635818
Submitted on 15 Nov 2017HAL is a multi-disciplinary open access archive for the deposit and dissemination of sci-entific research documents, whether they are pub-lished or not. The documents may come from teaching and research institutions in France or abroad, or from public or private research centers.
L’archive ouverte pluridisciplinaire HAL, est destinée au dépôt et à la diffusion de documents scientifiques de niveau recherche, publiés ou non, émanant des établissements d’enseignement et de recherche français ou étrangers, des laboratoires publics ou privés.
projectile penetration
Hanbing Bian, Yun Jia, Christophe Pontiroli, Jian-Fu Shao
To cite this version:
Hanbing Bian, Yun Jia, Christophe Pontiroli, Jian-Fu Shao. Numerical modelling the elastoplastic damage behaviour of dry and saturated concrete targets subjected to rigid projectile penetration. International Journal for Numerical and Analytical Methods in Geomechanics, Wiley, In press. �hal-01635818�
For Peer Review Only
Numerical modelling the elastoplastic damage behaviour of dry and saturated concrete targets subjected to rigid
projectile penetration
Journal: International Journal for Numerical and Analytical Methods in
Geomechanics
Manuscript ID Draft
Wiley - Manuscript type: Research Article Date Submitted by the Author: n/a
Complete List of Authors: Bian, Hanbing; Université de Lorraine, MIM Jia, Yun; University of Lille I, LML
Pontiroli, Christophe; CEA-DAM, GRAMAT Shao, Jianfu; Universite Lille 1, Polytech-lille
Keywords: water saturation, elastoplasticity, damage, pore collapse, concrete, high confining pressure
For Peer Review Only
Numerical modelling the elastoplastic damage behaviour of dry and
saturated concrete targets subjected to rigid projectile penetration
Hanbing Bian a,b, Yun Jia a*, Christophe Pontirolic and Jian-Fu Shaoa a- LML, Polytech’Lille, Cité scientifique, 59655 Villeneuve d’Ascq, France
b- LEM3, Université de Lorraine, Ile du Saulcy, 57045 Metz, France c- CEA, DAM, GRAMAT, F-46500, Gramat, France
* Corresponding author, Email: yun.jia@polytech-lille.fr Tel:+33 320336276 Fax: +33 320434626
Abstract:
The objective of the present paper is to present a numerical study on the influence of free water content on the penetration performance of concrete targets. Numerical analysis has been performed by using the finite element code Abaqus/Explicit in which a coupled elastoplastic damage model is specially developed for saturated and unsaturated concretes under a wide range of confining pressures. The proposed model is used to simulate both triaxial compression tests and penetration tests realized on saturated and dry concrete samples. Comparisons of available test results and numerical simulations show that the proposed model is able to predict satisfactorily the mechanical behaviour of saturated and dry concretes as well as the main observed patterns of penetration test performed on saturated concrete target. The proposed model is then used for the numerical prediction of penetration tests performed on dry concrete targets. Finally, the influence of free water content, tensile damage and softening behaviour on the penetration performance of concrete target is analyzed numerically by performing a series of parametric study. The numerical predictions and discussions can help engineers to enhance their understandings on the influence of hydraulic conditions on structural vulnerability of structures in concrete subjected to near-field detonations or impacts.
Key words: water saturation, mechanical behaviour, elastoplasticity, damage, pore collapse, concrete, high confining pressure
1. Introduction 2 3 4 5 6 7 8 9 10 11 12 13 14 15 16 17 18 19 20 21 22 23 24 25 26 27 28 29 30 31 32 33 34 35 36 37 38 39 40 41 42 43 44 45 46 47 48 49 50 51 52 53 54 55 56 57 58
For Peer Review Only
Massive concrete elements are widely used in various engineering applications from residential structures to bridges, hydraulic dams and nuclear power plants. Once they are formed, they are generally submitted in an environment with lower relative humidity comparing with its initial fully saturated states. Due to its relative small permeability, for a very long period of time, their cores could remain quasi-saturated even though their facings dry very quickly. Meanwhile, during the lifetime of these engineering structures, massive concrete elements may be subjected to some accidental or intentional extreme loadings, such as ballistic impact, vehicle shocking or explosion. In the framework of vulnerability study of concrete infrastructure to near-field detonations or impacts, it is necessary to study the influence of water content on the mechanical behaviour of concrete subjected to projectile impact.
When a massive concrete structure is subjected to a rigid projectile, three successive phases are generally observed [1, 2]: scabbing/cratering, tunneling and spalling. As a result, concrete is subjected to complex triaxial stress states, characterized by a high-intensity stress and strain rates. However, the experimental characterizations of concrete behaviour under such complex triaxial conditions are very limited due to the difficulties existing in the creation of a controlled loading path in dynamic triaxial compression. With recent theoretical developments and computational techniques, numerical simulations using nonlinear Lagrangian codes [3-10] become now the most provocative and comprehensive approach to study the projectile penetration of engineering structures. In this approach, not only the behaviour of projectile but also the response of concrete structure during the penetration of projectile can be studied in detail by implementing appropriate constructive models for projectile and concrete in the numerical codes. In the present study, a constitutive model will be proposed for concrete and implemented in the finite element code Abaqus/Explicit to describe the mechanical behaviour of saturated and unsaturated concretes subjected to projectile impact.
In order to identify different phenomena incorporated in the constitutive model, various experimental programs have been performed to study the concrete behaviour under high intensity stress and strain rates. Gran and Frew [11] have observed a maximal mean stress of order 1GPa in the near field of projectile trajectory, when a rigid impact penetrates into an concrete target with the impact velocity of 315m/s. Concrete behaviour under such level of stress is only recently studied by some researchers [12-18]. The experimental investigation [19-26] exhibits that an elastoplastic damage model is needed for the description of concrete behaviour. 2 3 4 5 6 7 8 9 10 11 12 13 14 15 16 17 18 19 20 21 22 23 24 25 26 27 28 29 30 31 32 33 34 35 36 37 38 39 40 41 42 43 44 45 46 47 48 49 50 51 52 53 54 55 56 57 58 59
For Peer Review Only
In the literature, different elastoplastic damages have been proposed for concrete [6, 27-32]. In these models, plastic deformation is coupled with induced damage. It is then possible to describe the material response under both tensile and compressive stresses with low and moderate confining pressures. However, the important volumetric compaction observed under high confinement is not incorporated. Recently, based on some recent experimental studies realized under the confining pressure up to 650MPa [14, 16], some elastoplastic damage models have been proposed for concrete [33-35]. Zhou et al. [33] have proposed a constitutive model to describe the main features of mechanical behaviour of saturated concrete under a wide range of confining pressure. In this model, damage mechanism is coupled with two plastic deformation mechanisms: the plastic pore collapse mechanism related to the volumetric compaction observed under high confining pressure and the plastic shearing mechanism developed under low and moderate confining pressures. Yang et al. [34] have studied the influence of water saturation on the concrete behaviour under very high confining pressure. However, the applications of these models are limited in quasi-static conditions. In view of this, Bian et al. [35] have tried to study the mechanical behaviour of saturated concrete subjected to projectile impact by using a simplified Zhou’s model [33]. The interaction between the elastoplastic damage behaviour of saturated concrete and the projectile penetration processes is demonstrated via a series of parametric studies. Lastly, Forquin et al. [36] have realized a numerical study on the influence of free water content on the ballistic performances of plain concrete targets. They have concluded that a constitutive model, which is capable of describing satisfactory the compressive and tensile behaviour of concrete as well as the effect of water content, is necessary to get a good understanding on the ballistic performances of concrete targets. In view of this, based on the research works of Yang et al. [34] and Bian et al. [35], a constitutive model will be proposed and implanted in the finite element code Abaqus/Explicit for the description of mechanical behaviour of saturated and dry concrete subjected to projectile impact.
In the first part, the penetration tests performed with different projectile velocity are presented. The coupled elastoplastic damaged model developed for saturated and dry concretes is then briefly introduced in the second part. It is implemented in the finite element code Abaqus/Explicit. The performance of proposed model is firstly examined at the material scale by simulating a series of conventional triaxial compression tests under various confining pressures and water contents. Afterward, it is verified at the structure scale by the simulation of projectile penetration tests performed with saturated concrete target. Finally, the proposed 2 3 4 5 6 7 8 9 10 11 12 13 14 15 16 17 18 19 20 21 22 23 24 25 26 27 28 29 30 31 32 33 34 35 36 37 38 39 40 41 42 43 44 45 46 47 48 49 50 51 52 53 54 55 56 57 58
For Peer Review Only
model is used to numerically analyze the penetration behaviour of projectile in dry concrete target.
2. Summary of experimental results from penetration tests
The penetration tests have been performed by CEA-Gramat. The used concrete is a standard concrete mixture, called R30A7 concrete, with a 28-days compressive strength as 30MPa. The composition of this concrete is given in the thesis of Vu [16]. In the penetration tests, an ogive-nose projectile with the mass as 2.4 kg is used to hit the center of cylindrical concrete target (with a diameter of 80cm and a thickness of 80cm) with different projectile velocities. The nose radius to diameter ratio of projectile is equal to 5.77, with a diameter of 52 mm. In the rigid projectile, an accelerometer recorder system was installed to record the projectile’s acceleration during the penetration tests. Moreover, in order to well capture the interaction processes between the projectile and target, the experimental equipment is completed by the high velocity video cameras. A topographic laser system is also used to record the dimensions of crater created by cratering and tunneling mechanisms during the projectile penetration. As it will take several years for the total desiccation of a concrete target with a thickness of 800mm, the penetration tests have been performed only on the saturated samples. The targets used in the penetration tests have been casted and conserved in the water until the performance of laboratory tests. During the penetration test, the concrete target is confined in a steel ring with a thickness of 15mm.
Figure 1. Gas launcher and rigid projectile with its acceleration recorder system
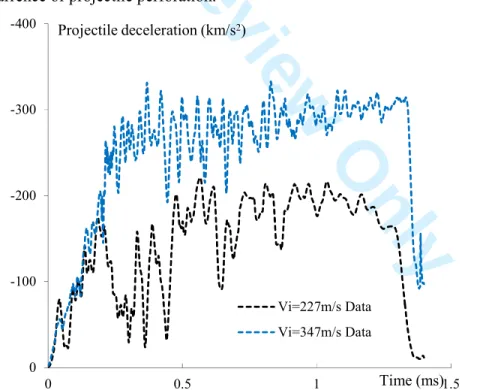
The projectile deceleration responses in the penetration tests with two projectile velocities are presented in Figure 2. Generally, three successive phases are observed in two tests. At the beginning of penetration processes (during the first 0.3ms, i.e. projectile head penetration phase), the projectile is decelerated significantly. Afterward, with the penetration of the whole projectile head into concrete target (i.e. tunneling phase), a steady deceleration 2 3 4 5 6 7 8 9 10 11 12 13 14 15 16 17 18 19 20 21 22 23 24 25 26 27 28 29 30 31 32 33 34 35 36 37 38 39 40 41 42 43 44 45 46 47 48 49 50 51 52 53 54 55 56 57 58 59
For Peer Review Only
rate of projectile is observed during the period from 0.3ms to 1.4ms. Finally, due to the transformation of the projectile dynamic energy into the deformation and damage of the concrete target, the projectile is finally stopped in the concrete target. Moreover, the comparison of two penetration tests exhibits that the amplitude of projectile deceleration increases with the initial velocity of projectile (V ): in the test with a smaller initial velocity i
(V =227m/s), a smaller projectile deceleration is observed at the beginning of penetration i
tests; on the other hand, a more important projectile deceleration is obtained in the penetration test with a greater projectile velocity (V =347m/s). In consistence with the previous i
deceleration observation, a greater penetration depth is obtained in the test with V =347m/s i
(Figure 3).
The final dimensions of carter obtained by the topographic laser system are shown in Figure 4. An important crushing of material is observed on the front face of concrete target while no cratering phenomenon is observed on its rear face. Moreover, one notes that the cratering depth is composed of 80% of the total penetration depth. Therefore, a good description of crushing of material (i.e. compressive damage) is very important for the description of mechanical behaviour of concrete subjected to the projectile penetration without the occurrence of projectile perforation.
-400 -300 -200 -100 0 0 0.5 1 1.5 Vi=227m/s Data Vi=347m/s Data Projectile deceleration (km/s2) Time (ms)
Figure 2. Projectile deceleration versus time in the penetration tests with two different projectile velocities (V =227m/s and i V =347m/s) i
2 3 4 5 6 7 8 9 10 11 12 13 14 15 16 17 18 19 20 21 22 23 24 25 26 27 28 29 30 31 32 33 34 35 36 37 38 39 40 41 42 43 44 45 46 47 48 49 50 51 52 53 54 55 56 57 58
For Peer Review Only
0 0.1 0.2 0.3 0 0.5 1 1.5 Vi=227m/s Data Vi=347m/s Data Time (ms) Penetration depth (m)Figure 3. Penetration depth versus time in the penetration tests with two different projectile velocities (V =227m/s and i V =347m/s) i
(a) 2 3 4 5 6 7 8 9 10 11 12 13 14 15 16 17 18 19 20 21 22 23 24 25 26 27 28 29 30 31 32 33 34 35 36 37 38 39 40 41 42 43 44 45 46 47 48 49 50 51 52 53 54 55 56 57 58 59
For Peer Review Only
Cratering depth
(b)
Figure 4. Front face (a) and topographic analysis (b) of concrete target after impact in the penetration tests with V =347m/s i
Aforementioned, concrete is subjected to complex triaxial stress states, characterized by high-intensity stresses and strain rates. Concrete behaviour under such level of stress is only recently studied by some researchers [12-18]. The experimental investigation [19-26] exhibits that an elastoplastic damage model is needed for the description of concrete behaviour. Under low and moderate confining pressures, the failure process of concrete is generally characterized by plastic deformation and stiffness degradation induced by growth of microcracks. However, under high confining pressure, the degradation of material stiffness is significantly reduced and plastic deformation becomes the dominant inelastic mechanism. Moreover, an important volumetric compaction related to the phenomenon of pore collapse is observed. On the other hand, the mechanical behaviour of concrete is also very sensitive to the presence of pore water. By comparing the triaxial compression tests performed with different water saturations, one can note that the material strength and its failure surface depend strongly on the water content. The material strength increases generally on drying. According to the failure surface, under high confining pressure, the failure stresses of saturated samples are quasi-independent on the applied confining pressure; while a continuous increasing in failure stresses is observed in dry materials with increasing of confining pressure (Figure 5). Moreover, the pore collapse processes is also influenced by the water saturation (Figure 6). 2 3 4 5 6 7 8 9 10 11 12 13 14 15 16 17 18 19 20 21 22 23 24 25 26 27 28 29 30 31 32 33 34 35 36 37 38 39 40 41 42 43 44 45 46 47 48 49 50 51 52 53 54 55 56 57 58
For Peer Review Only
0 300 600 900 1200 -1100 -800 -500 -200 100 q(MPa) p(MPa) Dry SaturatedFigure 5. Shear plastic failure surfaces for dry and saturated concretes (Experimental data from [16]) 0 100 200 300 400 500 600 700 0 2 4 6 8 10 Pc(MPa) εv(%) Saturated Dry
Figure 6. Evolution of mean stress p versus volumetric strain εvin hydrostatic compression tests with dry and saturated samples
2 3 4 5 6 7 8 9 10 11 12 13 14 15 16 17 18 19 20 21 22 23 24 25 26 27 28 29 30 31 32 33 34 35 36 37 38 39 40 41 42 43 44 45 46 47 48 49 50 51 52 53 54 55 56 57 58 59
For Peer Review Only
Meanwhile, some experimental tests have also been performed to study the behaviour of dry and wet concretes under a wide range of strain rates. The researchers [19-26] have revealed that the water content is one of the main factors influencing the dynamic behaviour of concrete as well as the penetration resistance of concrete structures. Moreover, it is generally observed that the effect of strain rate on tensile strength of dry/saturated concrete is more important than that on the compression strength of material. As the emphasis of this work is put on the elastoplastic behaviour of concrete targets during the penetration of rigid projectile without the occurrence of perforation, the influence of strain rate on the behaviour of concrete at different water saturations is neglected in the present study. A constitutive model, based on the experimental results obtained under static /quasi-static conditions, will be used in the present study to analyze the influence of free water content on the penetration performance of concrete target. According to the experimental investigation and from a phenomenological point of view, constitutive model should take into account the following phenomena: the damage, the plastic deformation, the pore collapse processes observed under high confining pressures, the effect of confining pressure on the peak stress as well as the effect of pore water. An elastoplastic damage model is then needed for the description of concrete behaviour.
3. Combinations of plasticity and damage in saturated and unsaturated concrete
In the context of engineering applications, the massive concrete elements may be subjected to drying and wetting. As indicated in the experimental results [16, 26], the mechanical behaviour of concrete is very sensitive to the water saturation. The main factor of this dependency is the variation of capillary pressure created by the change of hydraulic conditions. Elastic response, failure strength as well as plastic behaviour are affected by capillary effects. However, in the present work, we only consider the influence of water saturation on the mechanical behaviour of concrete. Hydraulic responses (variation of fluid pressure with mass change and skeleton deformation) will not be detailed here.
In this study, the assumption of small strains is adopted and the total strain increment tensor dεis decomposed into an elastic part dεe and a plastic partdεp:
e p d
ε
=dε
+dε
(1) 2 3 4 5 6 7 8 9 10 11 12 13 14 15 16 17 18 19 20 21 22 23 24 25 26 27 28 29 30 31 32 33 34 35 36 37 38 39 40 41 42 43 44 45 46 47 48 49 50 51 52 53 54 55 56 57 58For Peer Review Only
As two plastic mechanisms are observed respectively under low and high confining pressures, the plastic part dεpis also divided into two parts, a shear plastic partdεps and a plastic pore collapse partdεpc:
p ps pc
d
ε
=dε
+dε
(2)The concrete is assumed as an isotropic porous medium saturated by liquid water (noted by indexlq) and gas mixture (noted by indexgz). The gas mixture is a perfect mixture of dry air (noted by index da ) and vapor (noted by indexva). Denoting pα the pressure of the fluid phase α (
α
=lq va da, , ), the pressure of gas mixture pgz is expressed by the following relation:gz vp da
dp =dp +dp (3)
The capillary pressure pcpis defined as follow:
cp gz lq
dp =dp −dp (4)
Based on the previous works of Coussy [37], the equivalent pore pressureπ can be determined by the following function:
( )
gz lq cp cp
d
π
=dp −S p dp ;π =∫
dπ (5)lq
S denotes water saturation. For the sake of simplicity, it is assumed thatSlqdependents only
on the capillary pressure under isothermal condition through the water retention curveSlq
( )
pcp .Generally, the microcracks developed in concrete are distributed in some preferential orientations and then lead to an induced anisotropic damage of materials, for instance: crushing of material observed on the front face and splitting cracks/dust ejection occurred on the rear face of concrete target. However, in the penetration tests without the occurrence of perforation, crushing of material (i.e. compression damage) is the principal mode of damage. The topographic analysis (Figure 4) exhibits that the damage zone is located around the trajectory of projectile and is quasi symmetric with respected to the projectile trajectory. For the sake of simplify and putting the emphasis on the influence of water content on the mechanical behaviour of concrete, isotropic damage is adopted in the present work and characterized by a scalar variableω . Inspired by the previous research work of Mazars and Lemaitre [38-43], the effective elastic moduli of damaged concrete are defined by the following relations: 2 3 4 5 6 7 8 9 10 11 12 13 14 15 16 17 18 19 20 21 22 23 24 25 26 27 28 29 30 31 32 33 34 35 36 37 38 39 40 41 42 43 44 45 46 47 48 49 50 51 52 53 54 55 56 57 58 59
For Peer Review Only
( ) (
1)
0,( ) (
1)
0G ω = −ω G K ω = −ω K (6)
0
K and G denote respectively the drained bulk and shear moduli of intact concrete. 0
Therefore, the elastic stiffness tensor of damaged material C
( )
ω
can be written as:( ) (
)
0( )
( )
1 2 3
C ω = −ω C = G ω K + K ω J (7)
The fourth order tensor C is the elastic stiffness of intact material. Two isotropic and 0
symmetric fourth order tensors K J, are defined as:
(
)
2,
ijkl ij kl ijkl ik jl il jk
J =δ δ / 3, I = δ δ +δ δ K= −I J (8)
I is the symmetric fourth order unit tensor. δ denotes the second order unit tensor.
Using the equivalent pore pressure (5), the poroelastic constitutive relations for damaged concrete can be written as:
( )
: e( )
0: e 0 s K d C b d C d K σ = ω ε − ω πδ− ε + πδ ω (9)( )
b ω is the Biot coefficient of damaged material and can be expressed by the following
theoretical relation [37, 43]:
( )
1( )
s K b K ωω = − , with Ksdenoting the bulk modulus of solid
matrix. In the following, the specific formulations are presented respectively for modelling of plastic deformation and induced damage.
3.1 Plasticity characterization
In the literature, different kinds of approaches have been proposed for modelling poromechanical behaviour of saturated and unsaturated geomaterials. Among these approaches, two basic concepts have been widely used: the generalized effective stress model [37, 44, 45] and the so-called Barcelona model [46]. As the Barcelona concept is fully based on the experimental evidences, this approach is adopted in the present work for the poroplastic description of concrete. The plastic functions will be expressed as functions of the net stress σ′ = −σ pgzδ and water saturationSlq, which is assumed to depend only on the capillary pressure under isothermal condition by the relationSlq
( )
pcp . Moreover, in order to capture the pressure dependence of compressive damage and describe quantitatively the porosity variation related to the pore collapse process, an extended version of the model 2 3 4 5 6 7 8 9 10 11 12 13 14 15 16 17 18 19 20 21 22 23 24 25 26 27 28 29 30 31 32 33 34 35 36 37 38 39 40 41 42 43 44 45 46 47 48 49 50 51 52 53 54 55 56 57 58For Peer Review Only
presented by Yang et al. [34] will be used to describe the mechanical responses of concrete under different water states.
3.1.1 Plastic shear characterization
Based on the experimental data [12-17] obtained in various loading paths, a curved yield surface is necessary to take into account its strong pressure dependence. Inspired by the constitutive model proposed by Pietruszczak et al. [27] and Yang et al. [34], the following yield function is used:
(
)
(
)
( )
( )
1 3 2 , , , 0 1 ps s lq s lq r c F S q p c c S p p ω ω γ ω α ′ = + − = − σ σσ σ (10)( )
( )
3 1 ; ; 2 3 3 tr q s s s p tr σ σ δ σ ′ ′ ′ ′ ′ ′ = = − = (11)In the equationpis the mean effective stress and q denotes the deviatoric effective stress.
r
p is a unit pressure as pr =1MPa. c denotes the cohesion coefficient of material. The 3
parameter c is an equivalent friction coefficient. The parameter 1 c defines the nonlinearity of 2
yield surface. The values of parametersc c c can be determined from the best fitting of the 1, 2, 3 failure surface in the
(
p q plan by using the peak stress obtained in a series of triaxial ,)
compression test performed with different confining pressures (Figure 5). Moreover, the experimental investigation exhibits that the curvature of the deviatoric yield surface is dependent on the water saturation (Figure 5). This dependency is here interpreted by the fact that the parameter c is expressed as a function of water saturation: 2( )
2 2 2 ( 2 2 ) exp 1 lq lq s s d c lq S c S c c c S ξ = − − − − (12) The parameters 2 cξ controls the evolution of c with water saturation. 2 c2s and c2d are
respectively the values of c in fully saturated and dry concretes. For the description of 2
coupling between damage evolution and plastic deformation, it is assumed that the induced damage is entirely responsible for material softening. This can be taken into consideration as:
( )
0 1 10 0 1 1 cω
ω ω
cω
− = − − (13) 2 3 4 5 6 7 8 9 10 11 12 13 14 15 16 17 18 19 20 21 22 23 24 25 26 27 28 29 30 31 32 33 34 35 36 37 38 39 40 41 42 43 44 45 46 47 48 49 50 51 52 53 54 55 56 57 58 59For Peer Review Only
0
ω is the value of global damage coefficient corresponding to the peak stress in the uniaxial compression test. The function ω ω− 0 is used to describe the decrease of material strength observed after the peak stress. The bracket x means that only the positive value will be taken into consideration: x =0if x≤0and x =xifx>0. c is the value of 10 c in the intact 1
material.
Based on the experimental investigation, the plastic hardening law is proposed as follows: 1 exp( ps) s α = − −ζγ (14) 2 3 ps ps ps p d e d e γ =
∫
χ ,( )
; 3 3 ps r r ps ps p r q p p p tr e pε
ε
δ χ
− − + = − = (15)The parameter ζ controls the rate of plastic hardening and can be identified from the evolution of αs versus the equivalent plastic shear strainγps. The function
χ
p is introducedin order to better describe the strong pressure sensitivity of plastic hardening.
In order to describe the plastic volumetric transition from compression to dilatation with increasing of applied deviatoric stress, a non-associated plastic flow rule is used:
(
, , ,)
1 ln(
0)
0 , 3 1 f ps s lq s f Q σ γ ω S q ω ω µ I I I I p c ω − ′ = + − = = − − (16)The parameterI defines the intersection of the plastic potential surface with the0 paxis. The boundary between compressive domain and dilatancy one is defined by the condition
0
s
Q p
∂ ∂ = and can be expressed as following:
(
)
1 0 1 f s s s f L q ω ω µ p C ω − = − − − = − (17)The parameter
µ
s defines the slope of the boundary between compressive and dilatancy zones. It can be fitted by drawing the stress sate at the volumetric transition point in the(
p q−)
plan [34].For the loading history where only the plastic shear mechanism is developed in concrete without the damage evolution, the plastic flow rule is written as:
ps s s Q d
ε
dλ
σ
∂ = ′ ∂ (18) 2 3 4 5 6 7 8 9 10 11 12 13 14 15 16 17 18 19 20 21 22 23 24 25 26 27 28 29 30 31 32 33 34 35 36 37 38 39 40 41 42 43 44 45 46 47 48 49 50 51 52 53 54 55 56 57 58For Peer Review Only
0 3 1 1 2 3 s s s s s Q Q q Q p I q p qµ
Iδ
σ
σ
σ
∂ ∂ ∂ ∂ ∂ = + = + + ∂ ∂ ′ ′ ′ ∂ ∂ ∂ (19)The plastic multiplier dλscan be determined by the plastic consistency condition:
( )
(
)
2 2 0 : : 2 : : : : : 3 lq s s gz cp lq cp s s s s s s s ps s S F F c C d dp dp c S p d F Q F Q Q C K K ω ε δ σ λ α α γ σ σ σ σ ∂ ∂ − +∂ ∂ ∂ ∂ ∂ ′ ∂ = ∂ ∂ ∂ ∂ ∂ ∂ − ∂ ∂ ′ ′ ′ ′ ∂ ∂ ∂ ∂ (20)3.1.2 Plastic pore collapse characterization
Inspired by the plastic model proposed by Gurson et al. [47, 48], the following plastic yield function is used to take into account the pore collapse mechanism observed under high confining pressure:
(
)
2 2 2 3 , , , 2 cosh 1 0 2 c lq q p F σ σ φ S φ φ σ σ ′ = + − − = (21)φ
represents the porosity of concrete. The coefficientσ
( )
Slq represents the plastic yield stress of concrete solid matrix for the plastic pore collapse mechanism, which dependents on the mechanical properties of solid grains and the water saturation. Based on the experimental investigation from hydrostatic compression tests, a plastic isotropic hardening law is proposed:( )
( ) 0 1 ( ) pc lq M B S pc n lq M S a e ε σ =σ + ε (22)In which,
ε
Mpc =tr( )
ε
pc is the plastic volumetric strain, mainly due to pore collapse process. It has been taken as the internal hardening parameter. σ0denotes the initial yield stress of solid matrix. a n, and B are three hardening parameters. These four parameters (σ0, , ,a n B) could be identified directly from a hydrostatic compression test. The parameter σ0 can bedetermined from the transition point from linear to non-linear part. Afterward, other three parameters , ,a B n can be determined by the best fitting of the εv− pc curve.
As indicated in the experimental data, the kinetics of plastic pore collapse process is affected by the capillary effect. Therefore, the parameterB, controlling the hardening kinetics of plastic pore collapse, is expressed as a function of water saturation (Figure 6). For the 2 3 4 5 6 7 8 9 10 11 12 13 14 15 16 17 18 19 20 21 22 23 24 25 26 27 28 29 30 31 32 33 34 35 36 37 38 39 40 41 42 43 44 45 46 47 48 49 50 51 52 53 54 55 56 57 58 59
For Peer Review Only
reason of simplicity, an exponential function as that for compressive strength of material is proposed for the parameterB:
( )
( ) exp 1 lq lq s s d b lq S B S B B B Sξ
= − − − − (23)The function B S
( )
lq varies from the asymptotic value for saturated concrete B to the sasymptotic value for dry concreteBd . The parameter ξb controls the evolution of parameter Band can be determined by plotting the variation of parameter B obtained at different water saturations.
Furthermore, assuming that the plastic compressibility of solid grains may be neglected and inspired by the research works of Gatuingt et al. [49, 50], the porosity change, mainly due to the plastic pore collapse mechanism, is expressed as following:
(
1)
(
pc)
d
φ βφ
= −φ
tr dε
(24)The parameter β controls the evolution of porosity with the pore collapse plastic deformation. It can be determined by drawing the evolution of porosity versus the applied hydraulic stress in a hydrostatic compression test.
As the plastic pore collapse mechanism consists to describe the volumetric compaction observed under high confinement, for the sake of simplicity, a non-associated flow rule is used and the plastic potential is expressed as following:
(
)
2 2 3 , , , 2 cosh 2 c lq q p Q σ σ φ S φ σ σ ′ = + (25)For the loading history where only the plastic pore collapse mechanism is developed in concrete, the plastic flow is written by:
pc c c Q d
ε
dλ
σ
∂ = ′ ∂ (26) 2 2 3 3 sinh 2 c c c s Q Q q Q p q p q pφ
δ
σ
σ
σ
σ
σ
σ
′ ∂ = ∂ ∂ +∂ ∂ = + ∂ ∂ ′ ′ ′ ∂ ∂ ∂ (27)The plastic multiplier dλccan be determined by the plastic consistency condition, as:
( )
(
)
( )
( )
(
)
: : : : 1 lq c c gz cp lq cp c c c c c c c pc S F F C d dp dp S p d F Q F Q F Q C p p tr σ ω ε δ σ σ λ σ ω βφ φ σ ε σ σ σ ∂ ∂ − +∂ ∂ ∂ ∂ ∂ ′ ∂ = ∂ ∂ −∂ ∂ ∂ + ∂ − ∂ ∂ ∂ ∂ ′ ′ ∂ ′ ∂ ∂ ∂ (28) 2 3 4 5 6 7 8 9 10 11 12 13 14 15 16 17 18 19 20 21 22 23 24 25 26 27 28 29 30 31 32 33 34 35 36 37 38 39 40 41 42 43 44 45 46 47 48 49 50 51 52 53 54 55 56 57 58For Peer Review Only
3.2 Damage characterizationIn the framework of irreversible thermodynamics, the damage evolution should be determined by the formulation of a dissipation potential, which is function of the conjugated force associated and the damage tensor [45, 46]. In a rigorous framework, the damage evolution law is defined and the fundamental inequality of damage dissipation is verified. However, in concrete, the experimental determination of such damage criterion is very difficult by using the damage conjugated force, which cannot be directly measured. Consequently, the physics-based approach is generally preferred in the literature and then is adopted in the present work. The experimental investigations reveal an important non-symmetric tension/compression response. Under tensile stress, concrete exhibits a brittle behaviour and the concrete damage is inherently induced by tensile strain. In compression regime, the mechanical behaviour of concrete strongly depends on confining pressure. With increasing in confining pressures, a dramatic transition from brittle to ductile behaviour is also observed. The concrete damage is essentially related to the frictional sliding along microcracks surfaces. In order to take into account this loading dependence of damage evolution, two scalar damage variables [38-43] have been introduced in the present work:
c
ω for the compressive damage andωtfor the tensile one. Therefore, the global damage effect is controlled by two different driving forces respectively under tensile and compressive loading conditions. The tensile damage ωtis controlled by an equivalent tensile strain
ε
eq; while the compressive damageωc is dominated by the total deviatoric strainγ
:2 3 3 2 1 1 3 0 eq i i i i b k ε ε ε π = = =
∑
+∑
+ (29)( )
2 ; 3 3 tr d d e : d e d e dε
γ
=∫
=ε
−δ
(30) iε denotes the i th principal strain. In equation (29), the second part
2 3 1 3 0 i i b K ε π = +
∑
isintroduced to take into account the influence of interstitial pore pressure.
Inspired by the damage model proposed by Mazars [39-41], the tensile damage criterion and the compressive damage criterion are described by two exponential forms as follows:
(
1)
1 0 exp t t t eq F B ω ω ε = − − = (31) 2 3 4 5 6 7 8 9 10 11 12 13 14 15 16 17 18 19 20 21 22 23 24 25 26 27 28 29 30 31 32 33 34 35 36 37 38 39 40 41 42 43 44 45 46 47 48 49 50 51 52 53 54 55 56 57 58 59For Peer Review Only
(
)
1 1 0 exp c c c F B ωω
γ
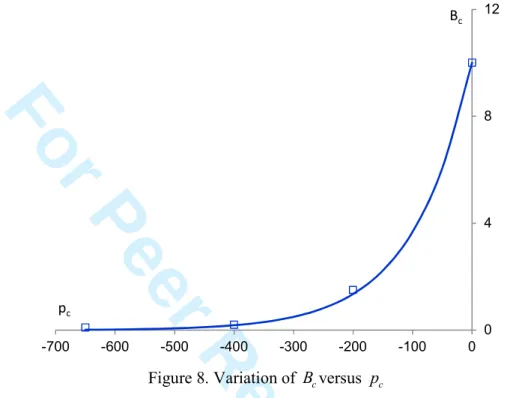
= − − = (32)The parameter Bt controls the evolution kinetics of tensile damage and can be identified by using a uniaxial tensile test. The parameterBc controls the evolution kinetics of compressive damage (Figure 7). Aforementioned, the compressive behaviour of concrete exhibits a brittle/ductile transition with the increase in confining pressure. In order to take into account this pressure dependence of compressive damage, the parameter B is expressed as a c
decreasing function of confining pressure pc[35]. Consequently, the damage plays a small role on the mechanical behaviour of concrete under high confinement.
( )
0exp(
)
, 3 c c c B c c q Bσ
=B −ξ
p p = +p (33)The parameter Bc0 represents the value of B in the uniaxial compression test. The parameter c
c
B
ξ describes the evolution kinetics of parameter Bcwith the confining pressure. By using the
values of Bc obtained in a series of triaxial compression tests under different confining pressures, the value of parameter
c
B
ξ can be determined from the best fitting the Bc-p points c
(Figure 8). -40 -30 -20 -10 0 -1.5 -1 -0.5 0 0.5 1 ε3 (%) ε1(%) σ1(MPa) Bc=2 Bc=5 Bc=10 2 3 4 5 6 7 8 9 10 11 12 13 14 15 16 17 18 19 20 21 22 23 24 25 26 27 28 29 30 31 32 33 34 35 36 37 38 39 40 41 42 43 44 45 46 47 48 49 50 51 52 53 54 55 56 57 58
For Peer Review Only
Figure 7. Influence of parameter Bc on the numerical prediction of axial deformation
1
ε -axial stress σ1 curve in a uniaxial compression test
0 4 8 12 -700 -600 -500 -400 -300 -200 -100 0 Bc pc
Figure 8. Variation of Bcversus pc
(Square points: values of Bc used in the numerical simulations of triaxial tests)
The evolution rates of tensile and compressive damage are determined explicitly by the displacement in using the equations (31) and (32):
(
)
,0 ,0 exp 0 eq t t eq t eq t t eq B d if Y B d if Y ω ω ε ε ε ε ε ω ε ∂ > ∂ = ≤ (34)(
)
(
)
,0 ,0 exp exp 0 c c c c c c c B B d d if Y B B d if Y ω ω γ ε γ σ γ γ ε γ σ ω γ ∂ ∂ + > ∂ ∂ = ≤ (35)In practice, when the transition from tensile to compressive stresses occurs, a partial restitution of elastic modulus is observed experimentally in damaged concrete. In order to take into account such phenomenon by a simple method, a global damage coefficient noted by
ω is introduced and expressed as a linear combination of two damage variables [39]: (1 t) c t t ω= −α ω +α ω , αt = σ+ σ (36) 2 3 4 5 6 7 8 9 10 11 12 13 14 15 16 17 18 19 20 21 22 23 24 25 26 27 28 29 30 31 32 33 34 35 36 37 38 39 40 41 42 43 44 45 46 47 48 49 50 51 52 53 54 55 56 57 58 59
For Peer Review Only
The combination coefficientαtphysically represents the contribution of tensile damage in the
global damage effects. σ and σ+ are respectively the norm of the total stress tensor σ and that of tensile part. Under uniaxial tension state, one getsαt = while 1 αt = in uniaxial 0 compression test.
3.3 Implementation of the proposed elastoplastic damage model in Abaqus/Explicit Under general loading conditions, the damage evolution and plastic flows occur in the coupled process. Consequently, the plastic strain rates and damage evolution rate should be determined simultaneously. As the damage criteria are related to total strain in the present work, the identification process of damage and plastic deformation can be simplified. By using the damage criteria given in equations (29) and (30), the evolution rates of tensile and compressive damage are determined independently by the equations (34) and (35). Moreover, a simplification is made on the calculation of the loading coefficientαt, which is determined with the stress obtained at the end of previous loading increment. Therefore, only the plastic consistency condition is need for the determination of plastic multipliers.
2 2 0 0 cp lq c c c c cp cp lq cp lq ps s s s s s ps cp s lq cp S F F F dF d d d dp S p S F F F c dF d d dp c S p σ σ σ φ ε φ σ ε σ α σ γ α γ σ ∂ ′ ∂ ∂ ∂ ∂ ∂ = + + + = ∂ ∂ ∂ ′ ∂ ∂ ∂ ∂ ∂ ∂ ∂ ∂ ∂ = ′+ + = ′ ∂ ∂ ∂ ∂ ∂ ∂ (37)
By introducing the state equations, the hardening law and the damage criterion in the above equations, we obtain the system of equations to determine the plastic multipliers:
( )
( )
( )
( )
: : : : : : : : c c c s cc sc c c s s s c s s cs ss F Q F Q C H C H d d F Q F Q C H C H ω ω σ σ σ σ λ λ ω ω σ σ σ σ ∂ ∂ ∂ ∂ − − ′ ′ ′ ′ ∂ ∂ ∂ ∂ Ψ = Ψ ∂ ∂ ∂ ∂ − − ′ ′ ′ ′ ∂ ∂ ∂ ∂ (38) 2 3 4 5 6 7 8 9 10 11 12 13 14 15 16 17 18 19 20 21 22 23 24 25 26 27 28 29 30 31 32 33 34 35 36 37 38 39 40 41 42 43 44 45 46 47 48 49 50 51 52 53 54 55 56 57 58For Peer Review Only
With( )
( )
(
)
2 2 : : : : : : 1 2 : : : 3 lq c c c c gz cp lq cp lq s s s s gz cp lq cp c c c c cc c M s s s s ss ps s S F F F C d dp dp S p S F F F c C d dp dp c S p F Q F Q H tr F Q Q H K K σ ω ε δ σ σ σ ω ε δ σ σ σ βφ φ φ σ σ ε σ α α γ σ σ ∂ ∂ ∂ ∂ ∂ Ψ = + + ∂ ∂ ′ ′ ∂ ∂ ∂ ∂ ∂ ∂ ∂ ∂ Ψ = + + ∂ ∂ ∂ ′ ′ ∂ ∂ ∂ ∂ ∂ ∂ ∂ = − + ∂ ∂ ′ ∂ ∂ ∂ ′ ∂ ∂ ∂ ∂ = ∂ ∂ ∂ ′ ∂ ′ (39)In these equations, two coefficients Hcs,H represent the coupling effects between the sc
hardening functions of two plastic mechanisms. In this study, one assumes that two mechanisms are independent each other. Consequently, in such a simplified case, we takeHcs =Hsc = . However, the general formulation of the proposed model is able to 0 describe the hardening interaction between the two plastic mechanisms and the damage.
The procedure proposed here is directly concerning the numerical implementation of the proposed model in the finite element code Abaqus/Explicit. In fact, the proposed model has been called for each integration point in the elements at each iteration. The solution schema for the kthload increment is described as following. At the beginning of current (kth) load
increment, the total deformation increment dεk is given as well as the value of variablesσ(k−1),ε(k−1),εp k( −1),εpc k( −1),ω(k−1),ωm k( −1),ωt(k−1),ωc(k−1) ,
γ
ps k( −1),γ
(k−1),ε
eq(k−1) at the end of previous load increment(
k−1)
th.(1). We begin with an elastic prediction. The increment of total stress is estimated as d
σ
( )k =C(
ω
(k−1))
:dε
( )k . As a result, the actual trial stress is identified as:( )k (k 1) ( )k
d
σ =σ − + σ
while the total stain is calculated by the function:ε( )k =ε(k−1)+dε( )k . (2). By using the equation (34) and (35), the evolutions rates of tensile and compression damage k, k
t c
d
ω
dω
are determined. The current value of tensile and damage variables k, k t cω ω
is updated as:ωtk =ωt(k−1)+dω ωtk; ck =ωc(k−1)+dωck; 2 3 4 5 6 7 8 9 10 11 12 13 14 15 16 17 18 19 20 21 22 23 24 25 26 27 28 29 30 31 32 33 34 35 36 37 38 39 40 41 42 43 44 45 46 47 48 49 50 51 52 53 54 55 56 57 58 59For Peer Review Only
(3). By using the stress obtained at the
(
k−1)
th step, the loading coefficient αt( )k is evaluated by the function: αt( )k = σ+ −(k 1) σ(k−1) . Therefore, the global damage coefficientk
ω
is updated as:ω( )k = −(1 αt( )k )ωc( )k +α ωt t( )k ;(4). We verify then two plastic yielding surfaces: Fs
(
σ γ′, ps, ,Sω lq)
and Fc(
σ σ φ′, , ,Slq)
; • If Fc < and 0 Fs< , the concrete is inside elastic damage/elastic domain. No 0plastic flow occurs and one have: dλs = and 0 dλc = ; 0
• If Fs= with 0 dFs= and 0 Fc < , only shear plastic mechanism is developed in 0 concrete. The plastic multiplier dλs is determined by equation (20) and dλc = ; 0
The current values of plastic shear strainsεps k( ) and shear plastic hardening variable
γ
ps k( ) are updated by: εps k( )=εps k( −1)+dεps k( ),γ
ps k( )=γ
ps k( −1)+dγ
ps k( ); • If Fc = with 0 dFc = and 0 Fs< , only the pore collapse plastic mechanism is 0developed in concrete. The plastic multiplier dλc is determined by equation (28)
anddλs = . The current value of plastic pore collapse strain0 εpc k( ) is updated by:
( ) ( 1) ( )
pc k pc k pc k
d
ε =ε − + ε
;
• If Fs= with 0 dFs = and 0 Fc = with 0 dFc = , the two plastic deformation 0 mechanisms are activated. The plastic multipliers dλs and dλc should be determined by equation(37) . The current values of plastic pore collapse strainεpc k( ), plastic shear strainsεps k( ) and shear plastic hardening variable
γ
ps k( ) are updated.Finally, using the constitutive equation(9), the admissible increment of stress is determined and the current value of stresses is then updated.
4. Numerical simulation of the laboratory tests under static loading conditions
The laboratory tests conducted by Vu [16] under a wide range of confining pressure and water saturation will be studied in this section. The experimental results have been firstly used for the identification of model’s parameters. In general, for a given water content, all the parameters of the proposed model can be identified by using a uniaxial tensile test, a hydraulic compression test and a series of compression tests under different confining 2 3 4 5 6 7 8 9 10 11 12 13 14 15 16 17 18 19 20 21 22 23 24 25 26 27 28 29 30 31 32 33 34 35 36 37 38 39 40 41 42 43 44 45 46 47 48 49 50 51 52 53 54 55 56 57 58
For Peer Review Only
pressures. Finally, comparing the values obtained from different water content, the evolution of parameter
(
c B2,)
as a function of water saturation can be determined. The detail procedure for the identification of model’s parameters is given in Yang et al. [34]. However, as no available experimental data exists on the evolution of porosity with the hydrostatic stress. In the present study, one assures that the plastic compressibility of solid grains may be neglected and the volumetric change is essentially related to the porosity change. Therefore, the parameterβ , which characterizes the evolution of porosity with the applied stress, is determined by drawing the porosity versus the volumetric deformation. For concrete studied there, the values of parameters are summarized in Table 1.Table 1. Representative values of model’s parameters for saturated and dry concretes
Parameters Plastic Damage
Shear Pore collapse Values 1 2 2 3 2.0 0.045 0.0012 2.0 150 1.5 s d s c c c c ζ µ = = = = = = 0 70 70 20 130 1.25 30 s d MPa B B a n σ β = = = = = = 0 50 10 0.02 c t c B B B ξ = = = −
In order to verify the capacity of the proposed model in describing the mechanical behaviour of studied concrete, laboratory tests on saturated and dry concretes under a wide range of confining pressures are simulated and analyzed in this section. The hydrostatic compression tests performed on saturated and dry concretes are firstly studied (Figure 9- 10). From the figures, one can distinguish clearly two different stages: first one for the elastic phase, which represented by the linear line in the beginning of the test; and secondly the pore collapse process, with the increase of the hydrostatic pressure, the pores begin to be compressed and the volumetric strain increases rapidly. With the increase of applied confining pressure, the bulk modulus of the concrete increases and induces a shape increase in the slope of hydrostatic pressure-volumetric strain curve. By comparing these two hydrostatic compression tests, a good agreement is observed between the numerical simulations and experimental data. The influence of water content on the pore collapse processes of concrete is satisfactorily reproduced by the proposed model.
The variations of porosity in hydrostatic compression tests are also analyzed (Figure 11). One notes a decrease of porosity since the hydrostatic stress reaches a limit value (i.e. the 2 3 4 5 6 7 8 9 10 11 12 13 14 15 16 17 18 19 20 21 22 23 24 25 26 27 28 29 30 31 32 33 34 35 36 37 38 39 40 41 42 43 44 45 46 47 48 49 50 51 52 53 54 55 56 57 58 59
For Peer Review Only
pore collapse yield stress). One can note that, at the beginning, when the hydrostatic pressure less than the pore collapse yield stress, the porosity keep its initial value with the decrease of confining pressure. When the applied confining pressure is greater than the pore collapse yield stress, the influence of water saturation is clearly illustrated: for the same level of confining pressure, a more important volumetric compaction is observed in dry material. This observation is due to the fact that: in dry material, the pore is occupied by the air which may be more easily compressed than water. One can also observed that, at the final phase of two hydrostatic compression tests, the slopes of two curves (Figure 10) trend to be the same. That is because, with the reduction of air volume, the saturation of dry concrete increases in the same time. Finally, it may be finished as “saturated” specimen. In conclusion, the plastic deformation processes related to the mechanism of pore collapse developed in dry and saturated concretes is described in a satisfactory manner by the proposed model.
-700 -600 -500 -400 -300 -200 -100 0 -10 -8 -6 -4 -2 0 Data Simulation Pc(MPa) εv(%) Dry
Figure 9. Simulation of a hydrostatic compression test with dry concrete sample 2 3 4 5 6 7 8 9 10 11 12 13 14 15 16 17 18 19 20 21 22 23 24 25 26 27 28 29 30 31 32 33 34 35 36 37 38 39 40 41 42 43 44 45 46 47 48 49 50 51 52 53 54 55 56 57 58
For Peer Review Only
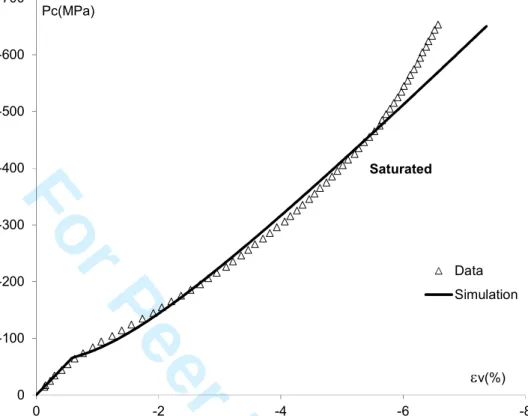
-700 -600 -500 -400 -300 -200 -100 0 -8 -6 -4 -2 0 Data Simulation Pc(MPa) εv(%) SaturatedFigure 10. Simulation of a hydrostatic compression test with saturated concrete sample
0 10 20 30 -700 -600 -500 -400 -300 -200 -100 0 φ(%) Saturated Dry Pc(MPa) Figure 11. Comparison of the porosity variations in two hydrostatic compression tests with
saturated and dry concretes 2 3 4 5 6 7 8 9 10 11 12 13 14 15 16 17 18 19 20 21 22 23 24 25 26 27 28 29 30 31 32 33 34 35 36 37 38 39 40 41 42 43 44 45 46 47 48 49 50 51 52 53 54 55 56 57 58 59
For Peer Review Only
A uniaxial tensile test and a series of triaxial compression tests performed on dry and saturated concretes are then simulated. In practice, the conventional triaxial compression test begins with a hydrostatic phase. Once the desired confinement is reached, the axial stress continues to increase while the confining pressure keeps constant. As the concrete behaviour under hydrostatic phase has been discussed in the previous paragraph, only the deviatoric phases of triaxial compression tests are presented in the following. Firstly, a uniaxial tensile test performed on saturated material is simulated (Figure 12). One observes that the tensile behaviour of concrete is satisfactorily reproduced by the proposed model. Afterward, by comparing of the triaxial compression tests performed under different confining pressures, the dramatic transition from brittle to ductile behaviour with increasing in confining pressure (Figure 13-15) is well described by the proposed model. Under low confining pressure, the concrete behaviour is dominated by the plastic shear mechanism and damage mechanism (Figure 13). On the other hand, at high confinement, the typical ductile failure is noticed without the observation of peak stress even when an important deformation of order 10% is observed (Figure 14, Figure 15). Secondly, the influence of water saturation on concrete behaviour is also analyzed in the Figure 13 - Figure 15. By comparing the numerical simulations obtained under the same confining pressure, one notes that the material strength increases with the decrease in free water content. Moreover, the influence of free water content on the failure strength is also well captured by the proposed model: when the confining pressure increases from 200MPa to 650MPa, a slight increase of failure pressure is observed in saturated samples while a more important increase of order 430MPa is obtained in dry concrete samples (Figure 14-15). In conclusion, the general tendency observed in experimental study is satisfactorily reproduced by numerical simulation.
Finally, the influence of water content on the porosity variation is also studied for two triaxial compression tests performed under 650 MPa. The curves of porosity variation versus the axial strain ε1 are presented in Figure 16. One observes that the amplitude of pore closing increases with decreasing in water content: more important closure of pores is observed in the dry sample. This phenomenon is coherent with that observed in the hydrostatic compression test (Figure 11). However, the porosity variation is smaller than that obtained in hydrostatic compression tests. This observation is due to the fact that the material has been strongly compacted in the hydrostatic phase.
2 3 4 5 6 7 8 9 10 11 12 13 14 15 16 17 18 19 20 21 22 23 24 25 26 27 28 29 30 31 32 33 34 35 36 37 38 39 40 41 42 43 44 45 46 47 48 49 50 51 52 53 54 55 56 57 58
For Peer Review Only
0 1 2 3 4 -0.3 -0.1 0.1 0.3 0.5 data simulation ε3(%) Pc=0MPa ε1(%) σ1(MPa)Figure 12. Simulation of uniaxial tensile test performed on saturated sample
-45 -30 -15 0 -1.5 -1 -0.5 0 0.5 1 ε1(%) ε3(%) Pc=0MPa Saturated σ1(MPa) ε3(%) Dry
Figure 13. Simulation of triaxial compression tests under the confinement pressure Pc=0MPa with dry and saturated concretes
2 3 4 5 6 7 8 9 10 11 12 13 14 15 16 17 18 19 20 21 22 23 24 25 26 27 28 29 30 31 32 33 34 35 36 37 38 39 40 41 42 43 44 45 46 47 48 49 50 51 52 53 54 55 56 57 58 59
For Peer Review Only
-500 -400 -300 -200 -100 0 -15 -10 -5 0 5 σ1-σ3(MPa) ε1(%) ε3(%) ε1(%) ε3(%) Pc=200MPa Saturated DryFigure 14. Simulation of triaxial compression tests under the confinement pressure Pc=200MPa with dry and saturated concretes
-1000 -800 -600 -400 -200 0 -10 -8 -6 -4 -2 0 2 4 ε1(%) ε3(%) Saturated ε1(%) ε3(%) Dry σ1-σ3(Mpa) Pc=650MPa
Figure 15. Simulation of triaxial compression tests under the confinement pressure Pc=650MPa with dry and saturated concretes
2 3 4 5 6 7 8 9 10 11 12 13 14 15 16 17 18 19 20 21 22 23 24 25 26 27 28 29 30 31 32 33 34 35 36 37 38 39 40 41 42 43 44 45 46 47 48 49 50 51 52 53 54 55 56 57 58
For Peer Review Only
-1.8 -1.5 -1.2 -0.9 -0.6 -0.3 0 -10 -8 -6 -4 -2 0 ∆φ(%) ε1(%) Saturated DryFigure 16. Variation of porosity under the confinement pressure Pc=650MPa with dry and saturated concretes
By comparing the numerical simulations and experimental data, we can conclude that the proposed model is capable of describing the mechanical behaviour of saturated and dry concrete under a wide of rang of triaxial stress states created by the projectile penetration. As the performance of proposed model has been validated on material scale and under static loadings in the previous section, some penetration tests performed by CEA-Gramat will be simulated and analyzed to verify the performance of model on structure scale and under dynamic loading conditions.
5. Simulation of projectile penetration tests
In this section, the performance of proposed model will be examined on the structure scale by simulating two penetration tests. The penetration tests performed with two different initial velocities of projectile (Vi=227m/s and Vi=347m/s) are simulated and discussed here. The initial velocity is applied on the center of the rigid projectile. The rigid projectile is modeled as a rigid body and the steel ring, confining the concrete target, is simulated by an elastoplastic model of Von-Mises type with a yield stress of order 500MPa. As the concrete target is casted and preserved in the fully saturated limewater until the realization of penetration test, the concrete target can be considered as fully saturated during the penetration 2 3 4 5 6 7 8 9 10 11 12 13 14 15 16 17 18 19 20 21 22 23 24 25 26 27 28 29 30 31 32 33 34 35 36 37 38 39 40 41 42 43 44 45 46 47 48 49 50 51 52 53 54 55 56 57 58 59
For Peer Review Only
test. The values of parameters obtained on saturated concrete (Table 1) are used for the concrete targets.
In practice, when the projectile penetrates into saturated concrete target, concrete is forced to move away from the projectile nose and the void ratio in the vicinity of the projectile body is then reduced. The combination of the decrease in void ratio and the high rate of displacement create an increase of pore pressures. As a result, the effective stress field surrounding the projectile trajectory is changed. However, in the present work, we only consider the mechanical behaviour of concrete under projectile penetration. Hydraulic responses (variation of fluid pressure with mass change and skeleton deformation) will not be detailed here.
5.1 Numerical configuration
In order to adopt a reasonable numerical model, some preliminary calculations have been performed to study the influence of mesh size, 2D/3D configuration, erosion criterion and friction condition on the interface between projectile and concrete target on the numerical result. In all the cases, the quadrilateral elements in homogenous size are used (Figure 17).
Firstly, two numerical simulations have been performed in 3D and 2D axisymmetric conditions, in which the same mesh size is adopted. In the 3D numerical model, the total cylindrical concrete target and projectile are taken into account while only one quarter of concrete target is used in the 2D axisymmetric model. By comparing the obtained numerical results obtained in two numerical configurations, no obvious difference is observed between them. This observation may be related to the following two facts: the projectile is use to hit the center of concrete target; the concrete is assumed an isotropic material in the numerical simulation. Secondly, two other 2D calculations with different mesh size (one with 60 000 quadrilateral elements, another with 150 000 elements) have also been performed in order to study the influence of mesh size. A week different is observed in three cases. Therefore, a mesh with 60000 quadrilateral elements is sufficient to obtain a stable numerical simulation. Finally, in order to reduce the overall calculation time, the 2D axisymmetric configuration is adopted in the following numerical simulation, in which the cylindrical concrete is meshed by 60000 quadrilateral elements in homogenous size.
2 3 4 5 6 7 8 9 10 11 12 13 14 15 16 17 18 19 20 21 22 23 24 25 26 27 28 29 30 31 32 33 34 35 36 37 38 39 40 41 42 43 44 45 46 47 48 49 50 51 52 53 54 55 56 57 58


![Figure 5. Shear plastic failure surfaces for dry and saturated concretes (Experimental data from [16]) 0100200300400500600700 0 2 4 6 8 10Pc(MPa)εv(%)SaturatedDry](https://thumb-eu.123doks.com/thumbv2/123doknet/12694533.355146/10.918.221.732.105.494/figure-plastic-failure-surfaces-saturated-concretes-experimental-saturateddry.webp)