(Diptera: Culicidae) Preimaginal Stages Under Field
Conditions
FLORENCE FOUQUE1 AND JOHANN BAUMGARTNER2
Institute of Plant Sciences, Division Phytomedizine, Swiss Federal Institute of Technology, Clausiusstrasse, 21, ETH-Zentrum, CH-8092 Zurich, Switzerland
J. Med. Entomol. 33(1): 32-38 (1996)
ABSTRACT Ecology and population dynamics of Aedes vexans (Meigen), were studied for 3 yr in southern Switzerland. Demographic data were compiled into single and multicohort stage-frequency lifetables that indicated variability in individual developmental times and losses caused by mortality. The structure of life table matrices suggested an analysis using a timevarying distributed delay model with attrition. Field data then were used to construct and validate a simulation model that input the number of 1st instars and output the number of emerging adults. The delay was the time required to complete development and attrition corresponded to mortality. Under optimal food supply, temperature was the most important driving variable. The model was parameterized with data obtained from laboratory experiments and evaluated with field data. Development and survival of preimaginal Ae. vexans were sim-ulated reasonably well under 2 different pool habitats. Addition of a hydrology component to the model would enhance control operations by predicting hatch rates in the field. KEY WORDS Aedes vexans, delay, population dynamics, simulation model, Switzerland
MOSQUITO OUTBREAKS DURING the middle 1980s in the Magadino plain (state of Ticino, southern Switzerland) stimulated authorities to finance control measures and to initiate research on the pest species. The 1st part of the research was a faunistic study that identified the inland flood-water mosquito Aedes vexans (Meigen), as the most important nuisance species because of its abundance and ecology (Fouque et al. 1991). The 2nd research objective was to describe the pop-ulation dynamics of Ae. vexans in the Magadino plain, a prerequisite for the development of an integrated control program.
The bionomics of Ae. vexans have been studied intensively (Gjullin et al. 1950, Mohrig 1969, Hors-fall et al. 1973). Our research investigated the pre-imaginal bionomics of Ae. vexans in southern Swit-zerland. The spatial and temporal distribution of the eggs was influenced by soil moisture, water movement, and the dispersal of gravid females (Fouque 1992). The hatching process was not studied, but according to Brust and Costello (1969), hatching is related to water level fluctua-tions and depends on temperature and humidity. The influence of environmental factors, especially water temperature and food, was assessed on larval
1
Current address: Laboratoire d'Entomologie Medicale, Insti-tut PASTEUR, BP 6010, 97300 Cayenne Cedex, French Guiana.
2
Current address: Landwirtschaftsamt Graubiinden, Graben-strasse, 1, CH-7001 Chur, Switzerland.
and pupal demographic parameters such as stage-specific developmental times and survival rates (Fouque et al. 1992). These parameters then were used to construct and evaluate a model simulating the dynamics of Ae. vexans aquatic lifestages under field conditions and predicting the emergence of the pupae from field estimates of lst-instar abun-dance.
The simulation model was a means of testing the reliability of hypotheses and predicting adult emer-gence. The model was constructed according to the following assumptions. Organisms and their environment (natural or artificial conditions) are components of a dynamic system (Huffaker 1980). The complexity of the interactions among ele-ments of the system is best evaluated by a math-ematical model that reflects the relevant biology of the system (Krebs 1972, Manly 1989). Aedes spp. population dynamics have been analyzed using several models developed for vector species in-cluding Aedes aegypti (L.) (Birley 1979, Gilpin and McClelland 1979, Dye 1984), and Ae. vexans (De Figueiredo et al. 1975, Hacker et al. 1975). How-ever, these models have not been validated with field situations. The biological realism of simula-tion models based on mechanistic principles, pop-ulation theory, and field data properties (Gilbert et al. 1976) is most suitable for field evaluation (Getz and Gutierrez 1982). The properties of field data collected on Ae. vexans immatures in Switzerland
QlW •vmt Rl(l) O U I n w 3nl-4th Instan CUD Rj(O
T
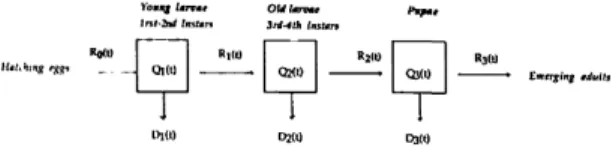
W O D2M D3(t)Fig. 1. Graphical representation of A. vexans lifestage development from egg hatch to adult emergence. Life-stages 1 (young larvae), 2 (old larvae), and 3 (pupae) are represented as boxes, and flows of individuals into, R|<~l(0, and from, R\<(t), the fcth stage at the time t are indicated by arrows. Q^(t) is the quantity of individuals remaining in k at the time t, and D^(t) is the flow of individuals lost at the time t because of mortality.
indicated that a simulation model based on time-varying distributed delays (Severini et al. 1990) with attrition (Vansickle 1977) would best simulate their dynamics. The population dynamics of sev-eral arthropod species already have been simulated by distributed delay models (Baumgartner et al. 1990, Bianchi et al. 1990, Maurer and Baumgart-ner 1994). The construction and evaluation of a similar model to simulate Ae. vexans population fluctuations are die subject of this article.
Description of the Model
Under natural conditions, die aquatic popula-tions of Ae. vexans develop within windows-in-tinie. For the purposes of this analysis, the aquatic lifestages are defined as young larvae (1st and 2nd instars), old larvae (3rd and 4th instars), and pu-pae. Multi- and single-cohort data obtained from field sampling and laboratory experiments were compiled into stage-frequency lifetables (Fouque et al. 1992). Individual maturation depends on en-vironmental factors and has properties, including variability of developmental times and losses dur-ing development. Individuals enterdur-ing a lifestage during the same time interval (same day) leave diis lifestage distributed among several time intervals (several days). This variability resulting from both genetic and environmental factors can be assigned a stochastic distribution. Losses or mortality during development are caused by intrinsic (genetic) and extrinsic factors (predation, food competition). However, high survival rates of Ae. vexans larvae under both optimal laboratory conditions and field conditions in the Magadino plain (Fouque et al. 1992) indicated that larvae were affected mini-mally by predation and other extrinsic mortality factors.
According to Severini et al. (1990), the structure of the insect (mosquito) lifetables with flows (co-horts) of individuals moving (developing) through the irreversible developmental processes (stages) at different rates (Fig. 1) indicates the use of a distributed delay model (Manetsch 1976) for sim-ulating the population fluctuations. Because the se-lection of an appropriate model is critical, the ar-guments of Severini et al. (1990) are reviewed in
Appendix 1. Briefly, individuals enter the model as
newly hatched larvae (input) and leave as emerging adults (output). Developmental times are assimi-lated into delays, and intrinsic mortality is incor-porated into an attrition rate. The parameters of die model are the input, the delay, and the attri-tion, which depend on environmental conditions and vary with time. Each simulation describes a single brood hatching and development under field conditions and is made with a time step of 1 h to account for hourly recorded field temperatures
{Appendix 2).
The input is composed of single- or multico-hort(s) of newly hatched Ae. vexans larvae esti-mated from field sampling analyzed by the Manly (1987) multiple-regression method. The Manly method extrapolates the number of daily entries from lifetables constructed from samples at fixed intervals from the same pool (Fouque et al. 1992). In the simulation model, the daily input is divided into 24 hourly groups entering the developmental process. As an example, a field infestation was sim-ulated with an input composed of 512,000 newly hatched larvae on day 1, 605,000 on day 2, and 648,000 on day 3, estimated by Manly's method (Manly 1987). In the model, 1/24 of the 512,000 hatched larvae entered the developmental process at each hour of the 1st d. The number of entries then was modified accordingly for days 2 and 3.
The developmental times used in the model are the instantaneous maturation times or delay DELi<(T). Delays are instar-specific and
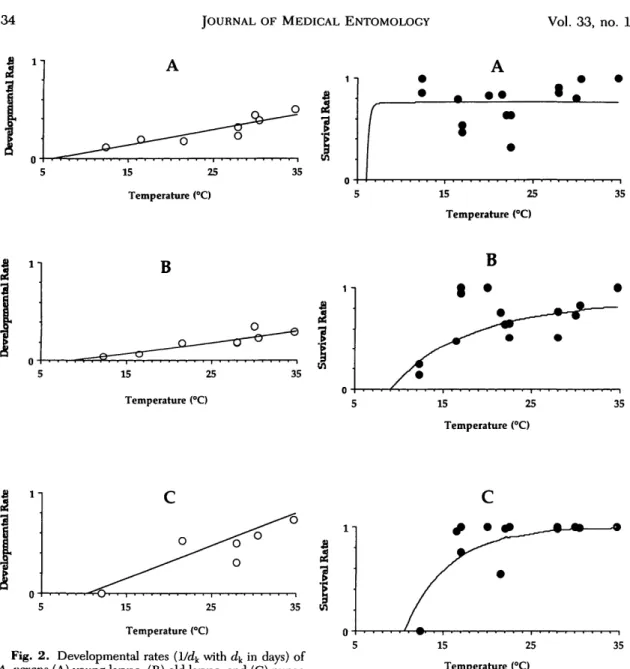
tempera-ture dependent. Because the food was not limiting in the Magadino plain (Fouque et al. 1992), tro-phic conditions were not included in the instan-taneous developmental time. DEL^T) is calculat-ed according to the equation 4 of Appendix 1. The experimental developmental times (d^) were esti-mated by the Manly method (Manly 1987), and the experimental developmental rates (1/4) were found to be a linear function of constant temper-atures within a specified temperature range (Gilpin and McClelland 1979). Stage-specific developmen-tal rates were linear functions of constant temper-atures for Ae. vexans young larvae, old larvae, and pupae within a temperature range 12°C < T ^ 35°C (Fig. 2). The 1/4 values plotted in Fig. 2 were estimated from laboratory experiments at 12°C (n = 2), 16.5°C (n = 1), 21.5°C (n = 1), 28°C (n = 2), 30°C (n = 2), and 35°C (n = 1). Regres-sion functions estimated minimal temperature thresholds of 6°C for young larvae and 9°C for old larvae. No pupal development was recorded at 12°C. Because of a technical problem, pupal de-velopment at 16.5°C was excluded from the re-gression, which estimated a threshold of 10.5°C for pupae. In the simulation model, stage-specific de-velopmental times for each time step were extrap-olated from these stage-specific functions based on temperature (Fig. 2).
Attrition or stage-specific mortality rates, Bk(T), were also instar-specific and mostly temperature-dependent in the Magadino plain (Fouque et al.
15 25 Temperature (°C) 1 -i
A
15 25 Temperature (°C) 35 l - i 6 15 25 Temperature (°C) 1 - i 15 25 Temperature (°C) 35 15 25 Temperature (°C)Fig. 2. Developmental rates (1/dy with d^ in days) of
A. vexans (A) young larvae, (B) old larvae, and (C) pupae
reared under optimal food conditions as functions of con-stant temperatures (12°C < T < 35°C). Developmental rate of young larvae = -0.09 + 0.015T; developmental rate of old larvae = -0.108 + 0.012T; developmental rate of pupae = -0.34 + 0.032T.
1992). Bk(T) was calculated according to equation 5 of Appendix 1. Experimental survival rates (w\) were estimated as functions of constant and mean temperatures within the range 12°C < T < 35°C (Fig. 3). The survival rates plotted in Fig. 3 were estimated using Manly's method (Manly 1987) from laboratory experiments at the constant tem-peratures of 12°C (n = 2), 16.5°C (n = 1), 21.5°C (n = 1), 28°C (n = 2), 30°C (n = 2), and 35°C (n = 1) and at the mean temperatures of 17°C (n = 2), 20°C (n = 1), and 22°C (n = 3). The functions were fitted to data with the fixed threshold esti-mated in Fig. 2. In the simulation model, the stage-specific survival rates were extrapolated from
15 25 Temperature (°C)
35
Fig. 3. Survival rates (w^) of A. vexans (A) young lar-vae, (B) old larlar-vae, and (C) pupae reared under optimal food conditions as functions of water temperatures (12°C < T < 35°C). Survival rate of young larvae = 0.76{l -exp(-3.79([T - 6])}; survival rate of old larvae = 0.85{l -exp(-0.115([T - 9])}; survival rate of pupae = 1 -exp(-0.196([r - 10.5])}.
the stage-specific exponential functions for each time step according to the temperatures.
Water temperatures were estimated according to equations 6 and 7 of Appendix 2, from the mean daily air temperatures recorded by the Meteoro-logic Office of Ticino. As an example, the water temperatures used in simulation 1 were estimated from the mean daily air temperatures recorded be-tween 21 May and 16 June 1990. The water tem-peratures were estimated for each time step.
The constant H representing the stochasticity of the system (Appendix 1) is set to 44 (Schaffer
~ ^ ^ ^ • Young larvae n Old larvae A Pupae Young larvae • Old larvae A Pupae 20 30 40 Days
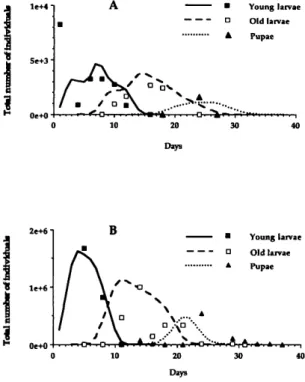
Fig. 4. Observed (points) and simulated (line) data representing the fluctuations of A. vexans young larvae, old larvae and pupae populations in the Magadino plain in (A) temporary pool no. 31 during a flooding period starting 21 May 1990 and ending 16 June 1990, and in (B) temporary pool no. 34 during a flooding period start-ing 5 June 1990 and endstart-ing 13 July 1990.
1983) "because this value represents empirical knowledge on variance-mean relationships in in-sect developmental times" according to Baumgart-ner and Severini (1987).
Collection of the Data. The data used for the
validation of the simulation model were collected in pools no. 31 and no. 34 of the Magadino plain, sampled for Ae. vexans immatures during 2 flood-ing periods in 1990. Collection methods and the materials have been described previously (Fouque et al. 1992). Briefly, samples of water containing
Ae. vexans immatures were collected every 2 or 3
d, beginning with 1st egg hatch and ending when no more Ae. vexans individuals were found. The number of samples was selected to obtain mean densities with a coefficient of variability = 0.2 (Karandinos 1976). The total numbers of individ-uals in each pool, used for the validation of the model, were estimated from the mean densities of individuals per sample and the volume of water.
Model Validation
Predicted data for the 2 Ae. vexans populations occurring in 2 temporary pools were compared with observed field data. In general, simulated pre-dictions of population size and developmental times agreed well with field data.
Pool no. 31 was flooded 21 May 1990, and no
Ae. vexans were found after 16 June 1990. The
input in the simulation model was the number of newly hatched larvae. The Manly (1987) method estimated the values for the 4 daily cohorts to be 1,250 1st instars on day 1; 2,095 on day 2; 1,412 on day 6; and 1,661 on day 7. Young larvae were present during the first 15 d (Fig. 4A) in both sim-ulated and observed data. Developmental times were simulated satisfactorily, because numbers of young larvae were maximum on day 8 and the last young larvae were found on days 14-16, in both the simulation and the field. Observed survival rate of young larvae in the field was slightly lower than the simulated survival. First old larvae appeared on day 8 in the simulation and on day 10 in the field (Fig. 4A), which indicates an error of =20%. The simulated development of old larvae was close to the field data, but observed survival was slightly less than simulated survival. Simulated and ob-served maxima also were reached concurrently on days 15 and 16. First pupation occurred around day 18 both in the simulation and in the field (Fig. 4A). The peak numbers of pupae occurred around day 24, but the last pupae were found earlier on day 28 in the field than in the simulation.
However, on 28 May and on 13 June 1990 (that is on days 8 and 24), the temporary pool under study was sprayed by helicopter with Bacillus
thu-ringiensis (Berliner) variety israelensis (Goldberg
& Margalit). Spraying on day 24 was too late in larval development because pupae are not suscep-tible to B. thuringiensis. However, spraying on day 8 should have killed the larvae, which obviously did not happen. The 1st validation of the time-varying distributed delay model with attrition indicated that the Ae. vexans population fluctuations in pool no. 31 were simulated satisfactorily (Fig. 4A).
A 2nd temporary pool (no. 34) was flooded on 5 June 1990, and no Ae. vexans were found after 13 July 1990. Newly hatched larvae formed 3 co-horts of 512,000 entries on day 1; 605,000 on day 2, and 648,000 on day 3. Simulated and observed data indicated the presence of young larvae during the first 10 d, with equivalent maximum numbers (=1,700,000 individuals) reached on day 5 (Fig. 4B). First old larvae occurred around day 8, and last old larvae were found on day 20 in both the simulated and observed data (Fig. 4B). Maxima also were very close (=1,000,000 individuals) and were reached around day 12 in the simulation and day 14 in the field. The 1st pupae appeared around the same period, between day 15 and day 20, both in the simulation and in the field (Fig. 4B). Pupae were found between days 15 and 30 in both cases. Maximum numbers were similar (=500,000 indi-viduals) and were reached slightly earlier in the simulation (around day 22) than in the field (around day 24).
Model Applications
The model was evaluated for its use to optimize
10 20 Days
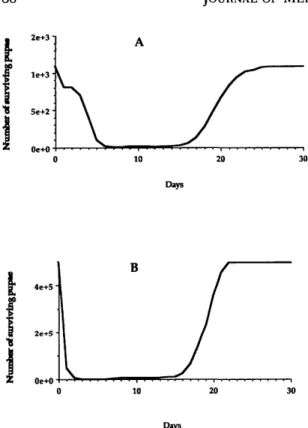
In the 2nd situation (pool no. 34), the simulated number of surviving pupae was close to 0 when B.
thuringiensis treatment was applied between days
2 and 15 after flooding (Fig. 5B).
Under the environmental conditions of the Ma-gadino plain, and when Ae. vexans hatching oc-curred at the end of spring or beginning of sum-mer, the efficacy of B. thuringiensis treatments was optimized when spraying was done a few days after the beginning of flooding of temporary pools. If the application was made on the 1st or 2nd d, its efficacy was suboptimal, because of low residual activity on larvae with delayed hatching (3 d or more). However, the number of survivors in-creased rapidly again when treatment was applied >15 d after flooding.
20
Days
Fig. 5. Fluctuation of the simulated peak numbers of
A. vexans pupae surviving a B. thuringiensis variety is-raelensis spraying, according to the date of the treatment,
during a flooding period starting 21 May 1990 and ending 16 June 1990, in (A) temporary pool no. 31, and during a flooding period starting 5 June 1990 and ending 13 July 1990 in (B) temporary pool no. 34.
the Ae. vexans populations observed previously. Simulated maximum numbers of surviving pupae were estimated according to the date of the spray-ing. Daily larval mortality rates resulting from B.
thuringiensis application decreased from 0.99 on
day 1 of spraying, 0.95 on day 2, 0.90 on day 3 to 0.50 on day 4, based on direct observations. These rates were combined with the temperature-depen-dent mortality. Pupae, on the other hand, are not affected by B. thuringiensis. Simulated peak num-bers of surviving pupae were plotted against the date of the spraying, and the efficacy of the treat-ment was evaluated with respect to the timing of spraying (Fig. 5 A and B). At day 0 there was no
B. thuringiensis spraying and the simulated
num-ber of pupae was the same as the simulated peak number of pupae in Fig. 4. A B. thuringiensis treatment is considered efficient if the number of surviving pupae approaches 0.
In the 1st situation (pool no. 31), the number of surviving pupae was close to 0 when B.
thurin-giensis was applied between days 6 and 15 after
flooding (Fig. 5A) (that is, between 26 May and 4 June 1990). As previously mentioned, B.
thurin-giensis was sprayed by helicopter on 28 May and
13 June 1990 (days 8 and 24). The 1st treatment should have been much more effective.
Perspectives for Implementation of the Model
The time-varying distributed delay model with attrition was validated satisfactorily and can be completed with the addition of a hydrology com-ponent. In the Magadino plain, the water level in
Ae. vexans breeding sites varies primarily because
of weather (mostly rainfall) and secondarily be-cause of the level of Lake Maggiore and the Tessin River, and snowmelt (Fouque 1992). For the most part, water level in breeding sites may be consid-ered a function of rainfall. Because the number of newly hatched larvae is related to the water level fluctuations, the model will be improved greatly by the introduction of functions relating rainfall to water level in Ae. vexans habitat and to Ae. vexans hatching. The new input into the model would be rainfall. However, the actual number of eggs in Ae.
vexans breeding sites would need to be estimated.
Some experiments have been done on the fluctu-ations of Ae. vexans egg numbers in their breeding sites (Fouque 1992), and it was found that in the swamp zone producing Ae. vexans, the number of eggs per square meter was related to the deepth of the pool. The egg density varied temporally, but after several yearly egg samples the available num-ber of eggs may be estimated. When the extent of flooding is known, the number of newly hatched larvae also may be estimated. At this stage, field work to estimate the input of newly hatched larvae into the model would be simplified. Predictions of
Ae. vexans hatches related to weather would be
very helpful in the planning of mosquito control. Although, the model currently is designed to eval-uate B. thuringiensis spraying, another insecticide may be evaluated after slight changes.
Finally, mosquito control based on habitat man-agement may also be implemented with a best knowledge of Ae. vexans ecology, gained through the use of a simulation model.
Acknowledgments
We especially thank V. Delucchi, who supervised this work; A. Barbieri, F. Filippini, and G. Righetti
(Diparti-mento dell'Ambiente, Bellinzona) for permission to use laboratory facilities and for providing technical assistance; and the Dipartimento dell'Ambiente and the Diparti-mento delle Opere Sociali, Bellinzona, canton of Ticino, Switzerland, for financial support. A. P. Gutierrez (Uni-versity of Berkeley, California, Berkeley) is acknowledged for a careful revision of the manuscript. The Osservatorio ticinese from Locarno Monti, Switzerland provided weather data.
References Cited
Baumgartner, J., and M. Severini. 1987. Microcli-mate and arthropod phenologies: the leaf miner
Phyl-lonorycter blancardella F. (Lep.) as an example, pp.
225-243. In F. Cesena, F. Prodi, F. Rossi, and G. Cristoferi [eds.], International Conference on Agro-meteorology. Fondazione Cesena Agricoltura, Italy. Baumgartner, J., M. Severini, and M. Ricci. 1990.
The mortality of overwintering Phyllonorycter
blan-cardella (F.) (Lep., Gracillariidae) pupae simulated as
a loss in a time-varying distributed delay model. Bull. Soc. Entomol. Suisse 63: 439-450.
Bianchi, G., J. Baumgartner, V. Dclucchi, and N. Ra-halivavololona. 1990. Modele de population pour la dynamique de Maliarpha separatella Ragonot (Py-ralidae, Phycitinae) dans les rizieres malgaches du Lac Alaotra. J. Appl. Entomol. 110: 384-397.
Birley, M. H. 1979. The estimation and simulation of variable developmental period, with application to the mosquito Aedes aegypti (L.). Res. Popul. Ecol. (Kyo-to) 21: 68-80.
Brust, R. A., and R. A. Costello. 1969. Mosquitoes of Manitoba. II. The effect of storage temperature and relative humidity on hatching of eggs of Aedes
vexans and Aedes abseratus (Diptera: Culicidae). Can.
Entomol. 101: 1285-1291.
De Figueiredo, R.J.P., C. S. Hacker, and J. R. Thompson. 1975. A system approach to mosquito control. J. Environ. Manage. 3: 63—76.
Dye, C. 1984. Models for the population dynamics of the yellow fever mosquito, Aedes aegypti. J. Anim. Ecol. 53: 247-268.
Fouque, F. 1992. Stratified random sampling method for a survey of Aedes spp. eggs. Bull. Soc. Vector Ecol. 17: 132-139.
Fouque, F., V. Delucchi, and J. Baumgartner. 1991. La de'moustication de la plaine de Magadino. I. In-ventaire faunistique des Culicides et identification des especes nuisibles a l'homme. Bull. Soc. Entomol. Suisse 64: 231-242.
Fouque, F., J. Baumgartner, and V. Delucchi. 1992. Analysis of temperature-dependent stage-frequency data of Aedes vexans (Meigen) populations originated from the Magadino plain (southern Switzerland). Bull. Soc. Vector Ecol. 17: 28-37.
Getz, W. M., and A. P. Gutierrez. 1982. A perspective of systems analysis in crop production and insect pest management. Annu. Rev. Entomol. 27: 447-466. Gilbert, N. A., A. P. Gutierrez, B. D. Frazer, and R.
E. Jones. 1976. Ecological relationships. Freeman, San Francisco.
Gilpin, M. E., and G.A.H. McClelland. 1979. Systems analysis of the yellow fever mosquito Aedes aegypti. Fortschr. Zool. 25: 355-388.
Gjullin, C. M., W. W. Yates, and H. H. Stage. 1950. Studies on Aedes vexans (Meig.) and Aedes sticticus (Meig.), floodwater mosquitoes, in the lower
Colum-bia River Valley. Ann. Entomol. Soc. Am. 43: 262-275.
Hacker, C. S., D. W. Scott, and J. R. Thompson. 1975. A transfer function forecasting model for mos-quito populations. Can. Entomol. 107: 243-249. Horsfall, W. R., H. W. Fowler, L. J. Moretti, and J.
R. Larsen. 1973. Bionomics and embryology of the inland floodwater mosquito Aedes vexans. University of Illinois Press, Urbana.
Huffaker, C. B. 1980. New technology of pest control. Wiley, New York.
Karandinos, M. G. 1976. Optimum sample size and comments on some published formulae. Bull. Ento-mol. Soc. Am. 22: 417-421.
Krebs, C. J. 1972. Ecology: the experimental analysis of distribution and abundance. Harper & Row, New York.
Manetsch, T. J. 1976. Time-varying distributed delay models and their use in aggregative models of large systems. IEEE Trans. Syst. Man Cybern. 6: 547-553. Manly, B.F.J. 1987. A multiple regression method for analysing stage-frequency data. Res. Popul. Ecol. (Kyoto) 29: 119-127.
1989. Stage-structured populations. Sampling, analysis and simulation. Chapman & Hall, London.
Maurer, V., and J. Baumgartner. 1994. A population model for Dermanyssus gallinae (Acari: Dermanyssi-dae). Exp. Appl. Acarol. 18: 409-422.
Mohrig. W. 1969. Die Culiciden Deutschlands. Unter-suchugen zur Taxonomie, Biologie und okologie der einheimischen Stechmiicken. Parasitol. Schriftenr. 18: 1-260.
Severini, M., J. Baumgartner, and M. Ricci. 1990. Theory and practice of parameter estimation of dis-tributed delay models for insect and plant phenolo-gies, pp. 674—719. In R. Guzzi, R. A. Navarra, and J. Shukla [eds.], Meteorology for environmental sci-ences, World, Singapore.
Shaffer, P. L. 1983. Prediction of variation in devel-opment period of insects and mites reared at constant temperatures. Environ. Entomol. 12: 1012—1019. Vansickle, J. 1977. Attrition in distributed delay
mod-els. IEEE Trans. Syst. Man Cybern. 7: 635-638.
Received for publication 13 October 1994; accepted 13 July 1995.
Appendix 1
The development of the Ae. vexans lifestages from egg hatch to adult emergence may be com-pared with a succession of boxes representing the lifestages, with flows of individuals entering and leaving the boxes (Fig. 1). In the case of a conser-vative development (that is, all individuals entering the kth stage complete their development), the output rate R^it) is a linear function of the input rate R\,-l(t) (Severini et al. 1990):
Rk-!(t) = L-Rk(t). (1)
If L is a linear operator of order H, because a process of order H is equivalent to H subprocesses of the 1st order, the linear function 1 is rewritten as a system of equations for each stage k:
drkM(t)/dt = C[rM_i(*) - rkJl(t)]
with rkh(t) as the output rate of the foth subprocess
of the kth stage at the time t, and C is a constant specific to the fcth stage. The system of equation 2 will be solved analytically only if the input is a uni-tary impulse, and a solution can be found through the Laplace transformation. This solution is an Er-lang distribution, and the output rkh(t) will be
dis-tributed in time according to the Erlang probabil-ity function. In biological terms, the solution of a unitary input corresponds to a single cohort of in-dividuals entering the developmental processes at the same time t. The cohort is thus the basic bio-logical unit to study the population fluctuations with a demographic approach. The cohort statistics including the individual developmental times, the variability, and the mortality rates are the basic population properties. The kth stage durations will be distributed in time according to the Erlang fam-ily probability function, with a mean value of DEL*. The mean transit time for a cohort of in-dividuals to complete the developmental processes within the kth stage thus is DEL^. Under constant temperatures and optimal food supply, the value of DELk is equal to [H/C]. The stochasticity of the system is represented by the constant H, and h may be considered as a substage of the kth stage. In the case of nonconservative development (that is, when losses caused by mortality occur), equa-tion 2 is modified to include an attriequa-tion rate B|<(Vansickle 1977). For poikilothermic organisms exposed to time-varying temperatures, DEL^ is re-formulated as DELk(T) (that is, the mean fcth stage instantaneous developmental time at temperature
T at time t). Likely, the attrition rate (that is, the
intrinsic mortality rate) is reformulated as Bk(T), the instantaneous kth stage attrition rate at tem-perature T at time t. The time-invariant delay equation of Vansickle (1977) is thus transformed into a time-varying distributed delay equation with attrition, with the temperature as the driving vari-able: drkJh(T[t)) dt E H )ELk(T{t}) rk,h-i(T{t})
-K
j - n./ dDELk(T{t}) dt „,.„ DELt(T{*}) HI
•rk,h(T{t}) h = 1, 2, 3 , . . ., H (3)where rkh(T) is the flow of individuals leaving the
hth substage of the fcth stage at the temperature T
at the time t.
To solve equation 3 numerically, a simulation model is constructed. For each lifestage under study a time-varying distributed delay equation with attrition is formulated. The parameters of the model are the input, the delay, the attrition, and
H, the factor of stochasticity.
Assuming that the experimental developmental times dk, estimated from laboratory experiments, under constant temperatures, can be formulated for time-varying temperatures, the delay DEL^T) can be calculated with an equation taking into ac-count the stage-specific survival rate w^ and the stochasticity of the system (Vansickle 1977):
DELk(T{t}) = (4)
Assuming that the experimental stage-specific sur-vival rates w^, estimated from laboratory experi-ments under constant and mean temperatures, can be formulated for time-varying temperatures, the attrition B^(T) can be calculated with an equation taking into account the mean kth stage instanta-neous developmental time at temperature T, DEL^T), and the stochasticity of the system. For a large H, Vansickle (1977) proposed:
Bk(T{t}) = -ln[u>fc]/DELfc(T{t}). (5) Appendix 2
The time-varying temperatures used in the sim-ulation model were extrapolated from the mean daily air temperatures according to functions de-termined after the following experiment. Field wa-ter temperatures were regiswa-tered every hour with a data-logger Squirrel computer left in the field during 1 m in a selected temporary pool in the Magadino plain. The recorded water temperatures then were transferred to a computer (Macintosh) with the Squirrel program. Daily maxima Tmax and
minima Tmin of the water temperatures were
plot-ted against daily mean air temperatures T^ re-corded during the same period and communicated by the Osservatorio ticinese from Locarno-Monti, CH. The regression functions of Tmax and Tmin
ac-cording to Taj,, were estimated:
Tmax = 5.04 +(0.63- (6) (7)
rmin = 9.36 + (0.31.r- r).
In the simulation model, Tmax and Tmin water
tem-peratures in the pools under study were estimated with functions 6 and 7 according to the mean daily air temperatures (T^) occurring during the simu-lation period. A sinus function of the water tem-peratures (T) was forced through Tmax and Tmin.
The temperatures T used in the simulation model were approximated from the sinus function for each hour of each day for the period of the sim-ulation.