TRANSACTIONSOF THE ROYAL S~CIETYOFTROPKAL MEDICINE AND HYGIENE (1995) 89,16-20
Control of Ascaris infection
by chemotherapy:
which is the most cost-effective
option?
H. L. Guyatt’, M. S. Chan2, G. F. Medley3 and D. A. P. Bundy ’ ‘Department of Public Health and Epidemiology, Swiss Tropical Institute, Socinstrasse 57, CH-4002 Basel, Switzerland; 2Department of Zoology, University of Oxford, South Parks Road, Oxford, OXI 3PS, UK; 3Ecosystems Analysis and Management Group, Department of Biological Sciences,
University of Warwick, Coventry, CV4 7AL, UK
Abstract
Cost-effectiveness analysis is used to predict the optimal design of mass chemotherapy strategies in control- ling Ascaris lumbricoides infection. The question of who to treat, how many to treat, and how often to treat
are addressed using a population dynamic model of hehninth transmission that assesses effectiveness in
terms of disease reduction, combined with cost data from an actual control programme. Child-targeted treat- ment can be more cost-effective than population treatment in reducing the number of disease cases. The model also implies that, in the circumstances described here, enhancing coverage is a more cost-effective ap- proach than increasing frequency of treatment.
Keywords: Ascaris, chemotherapy, cost-effectiveness Introduction
Chemotherapy is advocated as an affordable and effec- tive control measure for reducing intestinal nematode morbiditv (SAVIOLI et al.. 1992: WARREN et al.. 1992). However, the most cost-effective strategy of delivering chemotherapy to endemic communities remains uncer- tain.
Theoretical analysis has shown that selective treatment (identifying and treating only those who are diagnosed as infected) can orovide substantial benefits both in terms of reducing the abundance of the parasite and the num-
ber of treatments administered (ANDERSON & MAY,
1982). However. the hiah cost of diaanosis and ooor com&tnce result in selective treatment being more ex- pensive and less effective than mass treatment in control-
ling intestinal nematode infection (PRESCOTT, 1987;
BUNDY, 1990). However, if mass treatment is the option of choice, there are still other design aspects which have to be considered. One issue is the target population: at whom should the drug be targeted?-the whole popula- tion, only high-risk groups such as school-age children, or a combination of .both? One also needs to consider how often the drug should be given and what proportion of the target population should be covered. It is not known, for instance, whether it is better to treat more people less frequently or less people more frequently. Ideally, one would require extensive field studies to in- vestigate these issues. However, such studies are expens- ive and time-consuming, as well as producing data re- stricted to a given endemic locality.
A more immediate investigation into the most appro- oriate wavs of deliverine chemotheraov can be under- &en using theoretical &alysis. A population dynamic model of helminth transmission has been developed by
MEDLEY et al. (1993) which allows estimation of the ef-
fectiveness of different approaches to chemotherapy. This model has alreadv been used to investieate how often mass treatment should be administered &order to maximize cost-effectiveness (GUYATT et al., 1993). This study showed that less frequent treatments were most cost-effective in reducing the number of cases with heavy
Ascaris lumbricoides infections, and that measuring effec- tiveness in terms of only the number of infections prevented produced misleading results. This study was confined to population mass treatment, and assumed a fured population coverage.
The model has now been refined to include seoarate age groups, which allows investigation into age-targeted approaches to control (CHAN et al., in press). Although child-targeted treatment will never be more effective
Address for correspondence: Dr Helen Guyatt, Department of Zoology, University of Oxford, South Parks Road, Oxford, OX1 3PS, UK.
than population treatment, it is less costly and may prove to be more cost-effective since this target group has the highest intensities of infection, and is therefore most likely to suffer disease and to be responsible for a larger proportion of the transmission stages (WARREN et al.,
1992). Indeed, the treatment of children only may also lead to the reduction of infection in untreated adults sim- ply from a reduction in the number of transmission stages; this has been observed in field studies (BUNDY et al., 1990). The age-structured population dynamic model has been shown to be a good fit to the observed
data by CHAN et al. (in press), who also showed that
population treatment followed by child-targeted treat- ment was more effective than child-targeted treatment alone, though the costs of these 2 programmes were not compared.
In the first part of this paper, the cost-effectiveness of 3 options for chemotherapeutic control of A. lumbricoides
in a high and low transmission area are compared: popu- lation treatment, child-targeted treatment, and popula- tion treatment followed by child-targeted treatment. In this example, frequency of treatment and coverage are fixed. The interaction between coverage and frequency of treatment is complex and non-linear, and it is not im- mediately clear whether it is better to treat more people less frequently or less people more frequently. The sec- ond part of this paper will address this issue by compar- ing the cost-effectiveness of different combinations of frequency and coverage in delivering child-targeted treat- ment in a high transmission area. The predictions from the analyses will be used to provide some guidelines to the most cost-effective approaches to A. lumbricoides con-
trol. Methods The model
The model used to assess effectiveness has been de- scribed in detail by CHAN et al. (in press). Briefly, the host population is divided into 2 groups, children and adults, both of which harbour a parasite population of mature worms. A further parasite population is concep- tualized as a ‘pool’ of free-living infective stages in the environment. The host population can contaminate the environment by faeces containing eggs which develop into infective stages, and can become infected by contact with these infective stages. The 2 host groups differ in that the children both acquire infections and contaminate the environment at a higher rate than adults. The equili- brium worm population is set up using epidemiological parameter estimates of the life expectancy of the adult worm, the distribution of infection, and the rates of transmission. Left undisturbed, the parasite population will remain stable due to continual natural mortality of adult worms and infection by infective stages. Treatment
is simulated as instantaneous killing of adult worms in treated individuals. The efficacy of the drug is expressed as a proportion, an efficacy of 1.0 resulting in all worms in treated individuals being killed. The coverage and fre- quency of treatment can be varied and treatment given to the entire population or to one group alone. The changes in mean worm burden, prevalence of infection and pre- valence of morbidity in both host groups can be followed during and after several rounds of treatment. Morbidity is assumed to be associated with heavy infection by using a threshold worm burden at which morbidity occurs.
Base case
Treatment was assumed to be directed at A. lumbri-
coides in high and low transmission areas. The epidemio- logical parameters used in the model are given in Table 1. Population size was assumed to be 100 000, of whom
Table 1. The epidemiological parameters for Ascaris
lumbricoides transmission in a high and low transmis- sion area
Transmission area
Low High
Pammete? Children Adults Children Adults
W* 7 3 12 6
: ;y4 074 OTso4 OY4
RI l-25 3 1.5
I-L (years) 1 1 1 1
“The basic reproductive rate (&) and equilibrium worm burden (W*) were based on estimates by CROLL et al. (1982) for the high transmission area and CHAI et al. (1985) and BUNDY et al. (1987) for the low transmission area. The parameter k, an index
of the degree of parasite aggregation, was taken from GUYATT et al. (1990) and the disease threshold (T) was based on analysis by GLJYATT & BUNDY (1991). The adult worms’ life expectancy
(p) was based on studies reported by MULLER (1975).
40 000 were children (C 15 years old) and 60 000 were adults (>15 years). Mass yearly treatment was assumed to be admimstered in years l-5; 90% of children were covered by the programme, and 50% of adults, reflecting typical levels of age-dependent compliance with a high rate of school attendance. The dru efficacy was assumed to be 0.9 for both children and ad UT ts.
Scenarios
Two scenarios extended from the base case were inves- tigated. The first was a comparison of 3 alternatives for a S-year mass annual treatment programme in high and low transmission areas. The 3 options were (i) population treatment in years l-5, (ii) child-targeted treatment in years l-5, and (iii) population treatment in year 1, and child-targeted treatment in years 2-5.
The second scenario was a comparison of different fre- quencies of treatment and different coverages of a 5-year
child-targeted treatment programme in a high trans- mission area. The different frequencies of treatment were (i) every 6 months, (ii) every year, and (iii) every 2 years, representing a total of 10, 5 and 3 treatment cycles re- spectively over the 5-year treatment period. Three levels of coverage were investigated; (i) 50%, (ii) 70% and (iii) 90% of children.
Cost analysis
The cost data used in the analysis were based on actual expenditure of a control programme on the island of
Montserrat (BUNDY et al., 1990). All costs are repre-
sented in US$ at 1988 prices. Details of the cost data
have already been given (GUYATT et al., 1993), and all
unit costs, except transport costs, remain identical to those presented previously. The transport costs have been changed slightly for 2 reasons. Firstly, a 5% dis- count rate was used in annualizing the capital cost of the vehicle and, secondly, only the cost for the amount of time the vehicles were actually used has been attributed to the programme. In this analysis, one treatment cycle was assumed to require the vehicle for only 6 months; therefore the transport costs were half that of the pre- vious analysis for yearly and 2-yearly treatments. The transport costs also differed in child-targeted and popula- tion treatment because of the different sizes of the target population. The transport cost for child-targeted treat- ment was assumed to be half that for population treat- ment, as only one vehicle was required for child-targeted treatment, and 2 for population treatment. The cost of each delivery programme was assumed to be identical in both the high and low transmission areas.
Effectiveness analysis
In this study, effectiveness was confined to measures of the reduction in infection and disease prevalence as a result of the treatment programme. These 2 effectiveness measures were expressed as the number of infection cases prevented and the number of disease cases prevented, re- spectively.
The total effectiveness was estimated as the sum of the effectiveness in children and adults, weighted by the pro- portions of children and adults in the po
P ulation. The ef- fectiveness was assessed over a period o 10 years; for the duration of the 5 year treatment programme and for 5 years following it.
Cost-effectiveness analysis
The use of discounting is essential to cost-effectiveness analysis, although the precise discount rate is controver- sial. In the present study, both the costs and effective- ness of each programme were discounted using a dis-
count rate of 5% (DRUMMOND et al., 1987). Using
alternative discount rates of 3% and 10% did not alter the qualitative results; the general conclusions remain un- changed (data not shown).
The most effective option is that which maximizes the effectiveness measure (e.g. the number of disease cases prevented), while the most cost-effective option is that
Table 2. A comparison of the cost-effectiveness of different treatment scenarios for ascariasis (A, child-targeted; B, population followed by child-targeted; and C, population) in low and high transmission areasa
Low transmission area High transmission area
A B C A B C
cost (‘000, US$) 122 144 225 122 144 225
Effectiveness (‘000)
No. of disease cases prevented
12 1;; 50
No. of infection cases prevented 249 E i: 1:;
Cost-effectiveness ratio (US$)
Cost per disease case prevented 2.94 3.34 4.53 l-78 1.92 2.45
Cost per infection case prevented 1.12 1.04 0.90 l-84 1.70 1.38
aAssuming treatment is given every year, when 90% of children and 50% of adults are treated. Cost and effectiveness have been rounded up to the nearest thousand, but the cost-effectiveness ratios were calculated from the original data.
which minimixes the cost-effectiveness ratio (e.g. the cost per disease case prevented). The incremental cost-effec- tiveness ratio indicates the extra costs required to achieve an extra gain in effectiveness by implementing a more ex- pensive but more effective option.
Results
ChiM-targeted and population treatment
The cost and effectiveness of the 3 outions for aee-
targeted treatment in the low and high traknission areas are given in Table 2. The cheapest option was child- targeted treatment, and the most expensive was popula- tion treatment. The cost of population treatment fol- lowed by child-targeted treatment lay between these.
In both transmission areas, the most effective option was population treatment, since it prevented the highest number of disease and infection cases. Population treat- ment followed by child-targeted treatment prevented fewer cases than population treatment, but more cases than child-targeted treatment on its own. In terms of the number of infection cases prevented, the most effective and cost-effective option was population treatment. However, although population treatment prevented the highest number of disease cases, child-targeted treatment cost the least per disease case prevented, and was there- fore the most cost-effective option in terms of morbidity reduction. This highlights the problem of using the re- duction in infection cases as a measure of disease reduc- tion.
The incremental cost-effectiveness ratio provides in- formation on the extra cost per extra unit gain in effec- tiveness, for employing the more effective, but more ex- pensive, option. Employing population followed by child-targeted treatment instead of child-targeted treat-
ment alone cost US$ 2.90 per extra disease case
prevented in the high transmission area, compared with US$ 12.20 in the low transmission area. Using popula- tion treatment alone instead of population followed by
child-targeted treatment would have cost US$ 4.86 per
extra disease case prevented in the high transmission area and US$l2.58 in the low transmission area. It is evident that it is less expensive per unit gain in effectiveness to move from child-targeted to population followed by child-targeted treatment than to choose population treat- ment alone instead of the combined approach. In both cases, the incremental cost-effectiveness ratios are higher
Table 3. A corn arison of the cost-effectiveness of different combinations o F frequency of treatment and coverage for child-targeted treatment for ascariasis in a bigb transmission areaa
FkyF of treatment Coverage 6 months year 2 years Every Every
cost (‘000, US$) 0.5 145 72 44 0.7 194 97 58 No. of disease cases prevented (‘000) No. of infection cases prevented (‘000) ;:; 45 0.9 1:: t; 1: 66 39
Cost per disease
case prevented (US$) ;:; 2.80 2.25 2.16 2.77 1.95 1.78
0.9 2.92 1.78 1.48
Cost per infection
case prevented (US$) ;:; 3.24 3.13 3.29 2-59 2.41 2.53
0.9 2.19 1.84 1.89
“Cost and effectiveness have been rounded up to the nearest thousand, but the cost-effectiveness ratios were calculated from the original data.
in the low transmission area, implying that implementa- tion of these more expensive options would be more fa- vourable in the high transmission area.
Coverage and frequency of treatment
The cost and effectiveness of the different combina- tions of frequency and coverage of child-targeted treat- ment in a high transmission area are given in Table 3. The most effective option, for both infection and disease case prevention, was to treat most people very frequently (i.e. 90% of children every 6 months). This was also, however, the most expensive option. The cheapest opi tion was to treat few oeonle less freauentlv (i.e. 50% of children every 2 years), but this was-also the- least effec- tive option.
The most cost-effective option in terms of disease cases prevented was treatment every 2 years at a high coverage rate (90% of children). For infection case prevention, the most cost-effective option was treatment of 90% of child- ren every year. Here again, measuring effectiveness in terms of infection cases prevented can be misleading if the aim of control is to reduce disease.
The incremental cost-effectiveness of increasing the frequency of treatment at a given coverage, or increasing the coverage at a given frequency of treatment, can also be important in deciding whether to invest in more fre- quent treatment or in enhancing the proportion of the population treated.
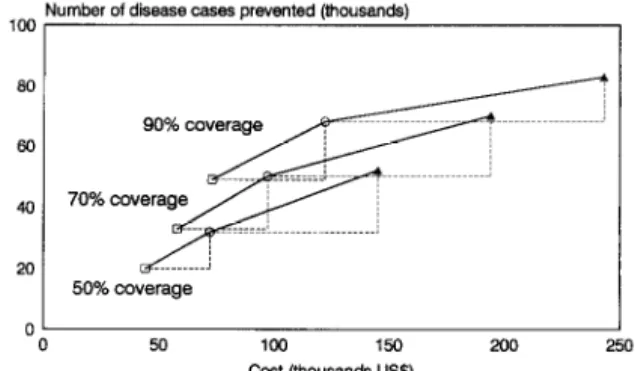
Considering first the effect of increasing the frequency of treatment at any given coverage, the analysis demon- strated that increasing the frequency from every 2 years to every year cost an extra US$2.28-2.55 per extra dis- ease case prevented, depending on the coverage. Increas- ing the frequency of treatment from every year to every 6 months required a much higher investment per extra dis- ease case prevented. It cost between US$ 3.72 and US$ 8.23 per extra disease case prevented, the cost increasing with the coverage. This suggests that, whereas increasing the frequency of treatment to every year rather than every 2 years may be a reasonable option, increasing the frequency from every year to every 6 months may not be a good investment since the cost per extra disease case prevented is high, particularly at high coverage (Fig. 1).
100 Number of disease cases prevented (thousands)
0
0 50 100 150 200 250
Cost (thousands US$)
Fig. 1. The relationship between the cost and the number of disease cases prevented when increasing the frequency of child-targeted treatment given 3 levels of coverage: treatment every 2 years (O), yearly (0) and every 6 months (A). The dashed lines illustrate the extra cost and extra effectiveness of treating more fre uently, and the solid line represents the incremental cost-e fectiveness 9 ratio.
For any given frequency of treatment, higher coverage resulted in more disease cases prevented, but at addi- tional cost. The cost per extra disease case prevented by treating more children varied with the frequency of treat- ment. The more frequent the treatments, the greater the investment required for every extra disease case prevented by treating a higher proportion of the child- ren. For instance, increasing the coverage from 50% to 70% would cost US$ 2.67 per extra disease case
study predict that it is more cost-effective to extend the range of an existing cycle than to increase the number of cvcles. The main reasons for this are that, firstly, it is cheaper and, secondly the dynamics are such that the lower the infection levels achieved the slower the return to equilibrium levels due to reinfection. MEDLEY et al. (1993) showed that increasing the coverage of treatment was increasingly beneficial to the untreated proportion of the population, because of reduced infection rates. These
results, however, are dependent on the level of trans- mission in the host community. Further research is con- tinuing to investigate the relationship between trans- mission, coverage and frequency of treatment.
Number of disease cases prevented (thousands)
100, I
I 50 100 150 200 250
cost (thousands US$)
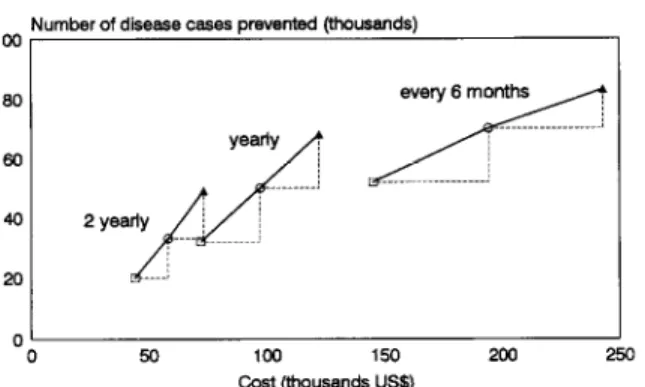
Fig. 2. The relationship between the cost and the number of disease cases prevented when increasing the coverage of child-targeted treatment given different frequencies of treat- ment: 50% (II), 70% (0) and 90% (A) coverage. The dashed lines illustrate the extra cost and extra effectiveness of treating more children, and the solid line represents the incremental cost-effectiveness ratio. (These are the same data points as those in Fig. 1, but connected by different lines.)
prevented if treatment were administered every 6 months, compared to US$ 1.17 with 2-yearly treatment cycles (Fig. 2). The lines are steeper in Fig. 2 than in Fig. 1, in- dicating more cost-effective increments.
Discussion
With the exception of drug efficacy, the coverage and frequency of treatment are often the only aspects of a de- livery programme that can be controlled. This analysis, therefore, addressed 2 central issues iu control design. Drug efficacy, which can be controlled through the choice of drug and dosage, will be the subject of a separ- ate analysis.
This study investigated the issues of target group, coverage and frequency of treatment in the control of A. lumbricoides. Since the analysis was based on costs from
au actual control programme, the results are clearly spe-
cific to the programme described. The conclusions of the
analysis may therefore not be applicable to all mass de-
livery programmes. Nevertheless, one observation ap-
plicable to hehuiuth control in general is that prevalence is a poor indicator of underlying disease patterns, yet it
remains the most commonly used measure for assessing control (BUNDY et al., 1992).
The analysis demonstrated that, of the 3 strategies of population and child-targeted treatment? child-targeted treatment alone was the most cost-effective option. The main reason for this was that the intensity of infection was highest in the child age classes, and therefore treat- ing children provided benefit to adults since the rate of transmission was greatly reduced. In this analysis, the unit cost of treating children was assumed to be identical to that for adults. In practice, the costs are likely to be much smaller for children, since they are more easily ac- cessible through schools (WORLD BANK, 1993). Includ- ing such a differential cost advantage would further fa- vour child-targeted treatment.
The study investigated the optimal coverage and fre- quency of treatment by assessing the cost-effectiveness of child-targeted treatment in a high transmission area, given variation in how often and how many children were treated. Previous theoretical studies have investi-
gated a control criterion for chemotherapy, which corre-
sponds to the threshold coverage per rime period re- auired to eradicate infection or to control infection to a given level (ANDERSON & MAY, 1985; ANDERSON & MEDLEY. 1985). There has been no attemot. however. to
dissect the interaction between coverage-and frequency
of treatment, or to investigate the implications for cost-
effectiveness. Since the programme was assumed to last for 5 years, it is obvious that the less frequent the treat-
ments, the fewer treatments given. The results from this
The most cost-effective option for child-targeted treat- ment was shown to be 2-vearlv treatment of 90% of the children. However, it is -possible that a 2-yearly treat- ment programme could be chosen, but only 70% cover- age achieved. In this situation, one may consider trying
to increase coverage to 90%. This might involve extra cost to motivate the community (e.g. through health edu- cation) and the staff (e.g. through mcentives). In this in- stance; one would be‘injerested-m determining the maxi- mum amount of money that could be spent trying to achieve a 90% coverage, so that this would still be more cost-effective than leaving the coverage at 70%. This can be calculated by determining how much more the costs of the 90% coverage programme could be increased while - _ still maintaining a lower cost-effectiveness ratio than leavine coverage at 70%. The analvses suggested that, on top of-the extra treatment costs, it would-be possible to invest up to US$ 14 967 over the 5-year programme in increasing coverage from 70% to 90%, and this would still be the more cost-effective option.
In the circumstances described here, enhancing cover- age is a more cost-effective approach than increasing fre-
auencv. Further research wtll look at the sensitivnv of the results to variability in both the epidemiological-and economic frameworks.
Acknowledgements
H. L. Guyatt is in receipt of a Wellcome Trust Travelllng Re- search Fellowship. G. F. Medley is a Royal Society University Research Fellow. D. A. P. Bundy thanks the Wellcome Trust for financial support. M. S. Chan was supported by the Edna McConnell Clark Foundation. as was the work on wwlation References
Anderson, R. M. & May, R. M. (1982). Population dynamics of human helmintb infections: control by chemotherapy. Na-
ture. 297.557-563.
Andemon, -RR. M. & May, R. M. (1985). Helmintb infections of humans: mathematical models, population dynamics and con- trol. Advances in Parasitolugy, 24, l-101.
Anderson, R. M. & Medley, G. F. (1985). Community control of helmlntb infections of man by mass and selecdve che- motherapy. Parasitology, 90,629&O.
Bundv, D. A. P. (1990). Control of intestinal nematode infec- tions by chemotherapy: mass treatment versus diagnostic screening. Transactions of the Royal Society of Tropical Me- dicineandHy
r
84,622-625.
Bundy, D. A. ., Cooper, E. S., Thompson, D. E., Dicker, J.
M. & Simmons, I. (1987). Epidemiology and population dy-
namics of Ascaris lumbricoides and Trichutis trichiura infection in the same community. Transactions of the Royal Socieg of Tropical Medicine and Hygiene, 81,987-993.
Bnndy, D. A. P., Wong, M. S., Lewis, L. L. & Horton, J. (1990). Control of geohelmintbs by delivery of targeted che- motheraov tbroueh schools. Transactiom of the Roval Societv of Tr icy1 Medi&eandH
Bundv. “g. A. P.. Hall. A.. ~f”d.‘l?&?&loli. L. (1992). Ev&atlng measures to control &testlnal parasitic infections. World Health Statistics
Chai, J. Y., Kim, K. S., % uarterly, 45,161179. ong, S. T., Lee, S. H. & Seo, B. S. (1985). Prevalence, worm burden and other epidemlological parameters of Ascaris lumbricoides infection in rural com- munities in Korea. Korean 3ouwd of Parasitology, -. 23, 241- 246.
Chan, M. S., Medley, G. F., Bundy, D. A. P. & Guyatt, H. L. (in press). The development and validation of an age strut-
tured model for the evaluation of disease control strategies for intestinal helminths. Parasitology.
Croll, N. A., Anderson, R. M:, Gyorkos, T. W. & Ghadirian, E. (1982). The Population btology and control of Ascaris lurn- brizoides in a rural conununity in Iran. Transactions of the Royal So&
Drutnmond, x1. of Tropical Medicine and Hy ‘ene, 76,187-197. F., Stoddard, T. L. $: Torrance, G. W. (1987). Methods for the Economic Evaluation of Health Care Programma. Oxford: Oxford University Press.
Guyatt, H. L. & Bundy, D. A. P. (1991). Estimating prevalence of community morbidity due to intestinal helmlnths: pre- valence of infection as an indicator of the prevalence of dls- ease. Transactions of the Royal Society of Tropical Medicine and Hygiene, 85,778782.
Gu
-f att, H. L., Bundy, D. A. P., Medley, G. F. & Grenfel!, B. . (1990). The relationship between the frequency dismbu- tion of Ascaris lumbricoidss and the prevalence and intensity of infection in human communities. Parasitology, 101,13%143. Guyatt, H. L., Bundy, D. A. P. & Evans, D. (1993). A popula-
tion dynamic approach to the cost-effectiveness analysis of mass anthehnintic treatment: effects of treatment frequency on Ascark infection. Transactions of the Royal Society of Tropi- cal Medicine and Hygiene, 87,570-575.
Medley, G. F., Guyatt, H. L. & Bundy, D. A. P. (1993). A
quantitative framework for evaluating the effect of com- munity treatment on the morbidity due to ascariasis. Parasite logy, 106,211-221.
Muller, R. (1975). Worms and Disease: a Manual ofMedical Hel- mintholo&. London: William Heinemann Medical Books. Prescott, N. M. (1987). The economics of schistosomiasis che-
motherapy. Parasitology Today, 3,2 l-24.
Savioli, L., Bundy, D. & Tomkins, A. (1992). Intestinal para- sitic infections: a soluble public health problem. Transactions of the Royal Society of Tropical Medicine and Hygiene, 86,353- 354.
Warren, K. 8, Bundy, D. A. P., Anderson, R. M., Davis, A. R., Henderson, D., Jamison, D. T., Prescott, N. & Senft, A. (1993). Helminth infections. In: Disease Control Priorities in Developing Countries, Jamison, D. T., Mosley, W. H., Mea- sham. A. R. & Bobadilla. A. L. (editors). Oxford: Oxford University Press, pp. 131-160. \~~~---I
World Bank (1993). World Develonment Board: Investing in Health. Oxford: &ford University-Press.
Received 14 March 1994; revised 12 May 1994; accepted
for
publication 22July I994Announcement
ROYAL SOCIETY OF TROPICAL MEDICINE AND HYGIENE
The Transactions of the Royal Society of Tropical Medicine and Hygiene is issued bi-monthly (six parts per year) and publishes not only papers presented at Society meetings and symposia but also papers and corre-
spondence submitted from all over the world on every aspect of tropical medicine and international health. Supplements on specialist topics are published from time to time.
The Transactions is available to Libraries and non-Fellows at an annual subscription of &120.00. It is clis- patched by accelerated surface post at no extra charge.
The annual subscription for Fellows is &50.00. Applications for Fellowship must be made on the correct form, obtainable from the address below. The rate for bonafide students is f25.00.
Further information and application forms for Fellowship can be obtained from:
Subscription orders from libraries and non-Fellows should be sent to: The Honorary Secretaries
Royal Society of Tropical Medicine and Hygiene Manson House
26 Portland Place London, W 1N 4EY, UK
Telephone: +44 (0) 171 580 2127 Fax: +44 (0) 171436 1389
Royal Society of Tropical Medicine and Hygiene
Subscription Department Media House Eccleston Road Maidstone, ME15 6QN, UK Telephone: +44 (0) 1622 756668 Fax: +44 (0) 1622 679774