A Novel Algorithm for the Determination of Bacterial Cell
Volumes That is Unbiased by Cell Morphology
M. Zeder,1,2,3,* E. Kohler,3L. Zeder,2and J. Pernthaler3
1Max Planck Institute for Marine Microbiology, Department of Molecular Ecology, Celsiusstrasse 1, 28359 Bremen, Germany 2Technobiology GmbH, Rütiweidhalde 7a, 6033 Buchrain, Switzerland
3Department of Limnology, Institute of Plant Biology, University of Zürich, Seestrasse 187, 8802 Kilchberg, Switzerland
Abstract: The determination of cell volumes and biomass offers a means of comparing the standing stocks of auto- and heterotrophic microbes of vastly different sizes for applications including the assessment of the flux of organic carbon within aquatic ecosystems. Conclusions about the importance of particular genotypes within microbial communities ~e.g., of filamentous bacteria! may strongly depend on whether their contribution to total abundance or to biomass is regarded. Fluorescence microscopy and image analysis are suitable tools for determining bacterial biomass that moreover hold the potential to replace labor-intensive manual measure-ments by fully automated approaches. However, the current approaches to calculate bacterial cell volumes from digital images are intrinsically biased by the models that are used to approximate the morphology of the cells. Therefore, we developed a generic contour based algorithm to reconstruct the volumes of prokaryotic cells from two-dimensional representations ~i.e., microscopic images! irrespective of their shape. Geometric models of commonly encountered bacterial morphotypes were used to verify the algorithm and to compare its perfor-mance with previously described approaches. The algorithm is embedded in a freely available computer program that is able to process both raw ~8-bit grayscale! and thresholded ~binary! images in a fully automated manner.
Key words: cell volume, high-throughput microscopy, model-based object-oriented image analysis, microbial ecology, screening
I
NTR ODUCTIONMicroscopy has been a key instrumentation since the begin-ning of microbiology ~Gest, 2004!. Recent advances in fluorescent staining, digital imaging, and microscope mo-torization have paved the way for the high-throughput analysis of microbial cells ~Singleton et al., 2001; Pernthaler et al., 2003; Daims & Wagner, 2007; Zhou et al., 2007!. Automation allows for processing of vast numbers of sam-ples, thus increasing spatial and temporal resolution of studies on the distribution of different bacterial populations ~Schattenhofer et al., 2009!, thereby providing new insight in the functioning of microbial ecosystems. So far, fully automated microscopy and image analysis primarily deliver cell counts in multiple fluorescent channels, yielding total bacterial numbers and relative abundances of specific groups at a precision that can be superior to manual counting ~Seo et al., 2010!.
The mere counting of bacteria, however, does not take into account their variable sizes. In phytoplankton ecology, the measurement of cell sizes has been a standard procedure for decades, and complex geometrical models are used to calculate the biovolumes and carbon content of different algal species ~Hillebrand et al., 1999!. This is deemed essen-tial because phytoplankton communities feature cells with a large variety of morphologies and size classes. Cell num-bers, therefore, do not adequately reflect the respective
importance of different species, e.g., their contribution to the standing stock ~Carlson et al., 1996! or to the flux of organic carbon through food webs ~Falkowski et al., 1998!. Moreover, large and small organisms may exhibit basic metabolic differences that lead to specific annual succession patterns ~Sommer et al., 1986!. The same may hold true for prokaryotic microbes, which may also substantially differ in cell size ~Bertoni et al., 2010! and, to a lesser extent, in shape ~Young, 2006!. This information may be ecologically highly relevant, e.g., with respect to their growth potential and predation vulnerability ~Chrzanowski & Simek, 1990; Zeder et al., 2009!. In fact, strikingly different conclusions may be reached about the relative importance of particular popula-tions within microbial assemblages if analyzed in terms of biomass rather than abundances ~Pernthaler et al., 2004; Posch et al., 2009!.
In addition to the determination of biovolumes of entire communities, it has also become more important to accurately measure the volume of individual microbes to study their ecophysiology. Nanoscale secondary-ion mass spectroscopy ~nanoSIMS! is a novel powerful single cell analysis technology to investigate and assign specific meta-bolic activities to the identities of individual cells ~Musat et al., 2008!. For such analysis it is crucial to relate the highly accurate measurement of matter content with an equally precise determination of its volume.
The estimation of bacterial cell volumes by means of microscopy and image analysis has been a long-standing topic in the literature, and many methods have been pro-Received April 4, 2010; accepted May 26, 2011
*Corresponding author. E-mail: [email protected]
doi:10.1017/S1431927611012104
M
icroscopy
A N DM
icroanalysis
posed for this purpose ~Boyde & Williams, 1971; van Veen & Paul, 1979; Krambeck et al., 1981; Bratbak, 1985; Fry & Davies, 1985; Bjørnsen, 1986; Sieracki et al., 1989; Bloem et al., 1995; Massana et al., 1997; Blackburn et al., 1998; Posch et al., 2009!. The standard procedure is to acquire digital images of bacteria and to measure their dimensions by image analysis. The microscopic image of a bacterial cell ~Fig. 1A! is a two-dimensional projection, which, in the optimal case, represents its cross-sectional area ~Fig. 1B!. Since it is not possible ~or at least not practicable! to analyze the third dimension by wide-field microscopy at the resolu-tion required for the imaging of bacteria, it is generally assumed that cells are rotationally symmetric ~Sieracki et al., 1989!. Primary features such as area, perimeter, and longest chord can be directly extracted from a cell’s cross section by image analysis, and secondary features ~that depend on additional model assumptions! such as length and width are often also calculated ~Fig. 1C!. From these data, the cell volume is reconstructed, typically by using simple geomet-rical approximations, the most common being the rod model. It assumes that any cell can be reconstructed as a cylinder with two hemispherical ends ~Fig. 1D!.
This rather drastic simplification obviously does not correspond with the observed variety of bacterial morphol-ogies ~Young, 2006!. Consequently, not all cell shapes are covered by this model with equal precision. Volume esti-mates even of simple morphologies such as prolate spher-oids or diplococci, therefore, are biased. A more sophisticated approach has been proposed by Sieracki et al. ~1989!. It is based on the cell contour, which is segmented into solids of revolution that are oriented along the major axes ~Fig. 1E!. This generalization allows precise reproduction of all mor-phologies with a straight axis. Unfortunately, the assump-tion of a straight major axis is only valid for some classes of cell shapes. Specifically, the volumes of curved morpholo-gies such as filamentous and vibrioid cells are strongly overestimated because the segments at locations where the
local axis is not parallel to the major axis are reconstructed as cylinders that are too large ~Fig. 1F!. A solution would be to not presume a straight major axis, but to segment a cell contour into triangles that are perpendicular to the local axis ~Fig. 1G!. These triangles can be accurately approxi-mated as solids that are half-cylinders ~Fig. 1H!.
We developed a general algorithm for microbial cell volume reconstruction from cell contours that is free from a priori geometrical assumptions besides rotational symme-try. The algorithm was numerically validated using geomet-rical models of 22 different bacterial morphotypes. We compared our algorithm with four previously described approaches that are both theoretically sound and described in sufficient detail to be reproduced ~Fry & Davies, 1985; Sieracki et al., 1989; Bloem et al., 1995; Blackburn et al., 1998!. In addition, images of fluorescent beads and a fresh-water bacterial strain with high phenotypic plasticity were analyzed, and critical issues with regard to fully automated imaging and image processing are discussed. The algorithm is embedded in a freely available computer program for batch analysis of digital images, and the source code of the algorithm is provided ~http://www.technobiology.ch!.
M
ATERIALS ANDM
ETHODSDescription of the Computer Program
for Image Analysis
A computer program, named YABBA ~Yet Another Bacterial Biovolume Algorithm!, was created in VB.Net ~Visual Stu-dio 2005, Microsoft!. It includes functionality to process single images or entire folders of 8-bit grayscale images in three common file formats ~.JPG, .TIF, .BMP!. In a first step, grayscale images ~Fig. 2A! are converted into binary objects ~Fig. 2B!. For object detection ~i.e., image segmenta-tion!, the user has the option to choose between a dynamic threshold @based on background subtraction by a lowpass filtered image ~Gaussian filter! followed by a fixed thresh-Figure 1. Different approaches for cell volume determination. The microscopic image of a three-dimensional bacterial cell ~A! appears as the cross-section area ~B!. Computer-assisted image analysis delivers features such as area, contour, and perimeter, wherefrom features such as length and width can be derived ~C!. There are several approaches to calculate the cell volume, e.g., the rod-model ~D! or contour subdivision along the major axis ~E! and reconstruction as cylinders ~F!. The method described here performs a contour subdivision into triangles perpendicular to the local axis ~G! and volume reconstruction as half-cylinders ~H!.
old#, or a simple fixed threshold, allowing use of prepro-cessed ~binary! images. In a second step, binary objects, defined as groups of adjacent pixels, are analyzed ~Burger, 2008!. A counting frame is implemented ~Gundersen et al.,
1988!, testing the bounding boxes of objects. The cell con-tour is of particular importance for the accurate determina-tion of cell volumes by our algorithm. From the chain code contour ~Fig. 2C! ~Freeman, 1961!, a subpixel contour ~Fig. 2D! is derived which is then used to calculate elliptical Fourier descriptors ~EFD! ~Kuhl & Giardina, 1982!. A nor-malized contour ~EFD contour, Fig. 2E! consisting of 200 points is reconstructed from these descriptors, using a vari-able number of Fourier descriptors ~2–9 harmonics!, depend-ing on the perimeter ~in pixel! of the object. The number of harmonics is important to adequately represent the cell shape of objects consisting of different number of pixels ~e.g., imaged at different magnifications!: too few harmon-ics result in an oversimplified shape representation, whereas too many harmonics produce artificial contour details due to the pixel discretization step ~Fig. 2F!. Primary features such as area, perimeter, and longest chord are calculated from the EFD contour.
Biovolumes of each object are calculated, based on the EFD contour and its derived features. In addition to our new algorithm, four described algorithms ~Fry & Davies, 1985; Sieracki et al., 1989; Bloem et al., 1995; Blackburn et al., 1998! were also implemented for comparison, sub-sequently referred to as Fry, Sieracki, Bloem, and Blackburn ~for implementation details please refer to the source code in the Supplementary Material!.
Finally, an output report ~plain text! is created and, optionally, annotated images are generated. In the single image processing mode, enlarged depictions of all single cells, including detailed annotations related to the different algorithms, are created.
Strategy of the Algorithm
The basic idea of our algorithm is that a microbial cell, independent of its morphology, can be cut into half-cylinder-like segments along the local major axis ~Fig. 1G,H!. In the two-dimensional projection, as given by wide-field micro-scopic imaging, the cell contour ~subsequently also referred to as “polygon”! has to be cut into triangles. Those triangles can be used for the reconstruction of solids of revolution that are half-cylinders. The summation of the volumes of those volume elements finally results in the volume of the microbial cell.
Detailed Description of the Algorithm
The input for the algorithm to calculate the biovolume of a cell consists of its EFD-based contour, in the form of a list of n points ~ x, y coordinates, n⫽ 200 by default!, defining a polygon. The polygon points are listed in adjacent order. In a first step, the list of simple contour points is converted Figure 2. Description of the algorithm. A digital image of a
bacte-rial cell ~A! is represented as a group of adjacent pixels ~B!. Its primary contour ~C! is transformed into a subpixel contour ~D! that is used to calculate an elliptical Fourier descriptor based con-tour ~E! by an adequate number of harmonics ~F!. This concon-tour is converted into a list of point objects that contain important prop-erties such as the index ~I!, the coordinates ~X,Y!, normal vectors ~Xn,Yn! and links to the previous ~pI! and next ~nI! point ~G!. The algorithm recursively subdivides the contour into triangles using an optimization function ~H!. After excision of the optimal trian-gle, the contour is divided into two contours. This is realized by altering point properties ~pI, nI! and adding a new point to the list ~I!. The resulting subdivision of the cells ~A! EFD contour ~E! yields triangles that are perpendicular to the local axis of the cell ~J!. The generic algorithm works for different bacterial shapes ~K!.
Supplementary Material
Supplementary material, which contains the algorithm source codes, can be found online. Please visit www. journals.cambridge.org/jid_MAM.
into a list of more complex point objects ~Fig. 2G, for better visibility, only 41 instead of 200 points are depicted!, con-taining additional information for each point such as its index I, the index of ~link to! the next point ~nI!, the previous point ~pI!, its coordinates ~X,Y!, and its normal vector ~pointing inward, Xn, Yn!, which is calculated based on the coordinates of the actual point I and its two neigh-boring points ~nI, pI!.
The second step consists of the recursive processing of the polygon ~n points! to subdivide it into n-2 triangles. The recursion step aims to find the optimal triangle within a polygon ~Fig. 2H!. The optimal triangle has to be perpen-dicular to the cell’s local axis ~Fig. 2G–I, dashed line!. This is achieved by first considering all possible triangles that can be constructed with two adjacent points P1 and P2 and a third point P3 on the polygon, and selecting the most appropriate of these triangles by applying an optimization function ~described below!. In each recursion, after the optimal triangle has been found, the polygon is segmented into two new polygons by excision of this triangle ~Fig. 2I!. The newly defined polygons are again subjected to the recursion until subdivision is no longer possible. The recur-sion distinguishes between two cases: a new polygon is an end region of the entire contour or it is not ~Fig. 2J,K, blue and purple triangles!. In the first case, the polygon is con-secutively divided into triangles, starting with the largest possible triangle. In the second case, the optimization func-tion is again applied and the recursion continues.
By using the point objects described above, it is not necessary to create new polygons ~i.e., new lists of points!. Instead, it is sufficient to alter the links ~nI, pI! between the existing points at the location where the polygon is split. Since, after every subdivision, one single point ~Fig. 2I, Point 36! will be a member of both of the new polygons, a new point has to be added to the existing list of points. In our example, the properties of points 4, 5, and 36 were changed as follows: P4.nI: 5r 36; P36.pI: 35 r 4; P4.pI: 4r 42; and the new point 42 was created with pI ⫽ 35 and nI ⫽ 5. At the end of the recursion, the contour is sub-divided in n-2 triangles that all are perpendicular to the local major axis ~Fig. 2J,K!. The volume of the cell is finally reconstructed as the sum of solids of revolutions of the single triangles. Depending on whether a triangle is part of an end region or not, a different formula is used for the calculation ~Fig. 2J!.
Optimization Function
As a prerequisite for finding the optimal triangle, the long-est distance Dmaxbetween any two points within the
poly-gon is calculated. Then, for every possible triangle, consisting of a point P1 a second, adjacent point P2 and any third point P3 in a polygon, an optimization value is calculated ~Fig. 2H!. It is defined as the sum of the two vectors r and s @r is the difference of the normal vector on P1 ~P1n! and the
normalized vector from P1 to P3 ~P13n! and s is the difference of the normal vector on P3 ~P3n! and the normal-ized vector from P3 to P1 ~P31n!#, multiplied by the
dis-tance from P1 to P3 divided by Dmax. The triangle featuring
the lowest value is then chosen as the optimal triangle.
Verification of the Algorithm
For the verification of the algorithm, 22 geometrical models of realistic bacterial morphotypes ~Bergey, 1994! were de-signed ~Fig. 3A!. The models were constructed using a CAD program ~Pro/E Wildfire 4, PTC, Needham, MA, USA! according to the specifications given in Fig. 3B. In addition, geometric formulas were derived for each model to express its cross-section area and volume as a function of the radius r, and to calculate its volume as a function of the cross-section area ~Table 1!. These formulas were validated numer-ically using the CAD software. Finally, cross-section images ~Fig. 3C, r ⫽ 10 pixel! were created from these models, which were then subjected to different cell volume recon-struction algorithms from the literature ~Fry, Sieracki, Bloem, Blackburn! and our own algorithm. By this approach it was possible to exactly compare the volume estimates of the different algorithms with the “true volume” of the models, as determined by the corresponding formulas and the cross-section area measured by image analysis.
Analysis of Fluorescent Beads and Bacteria
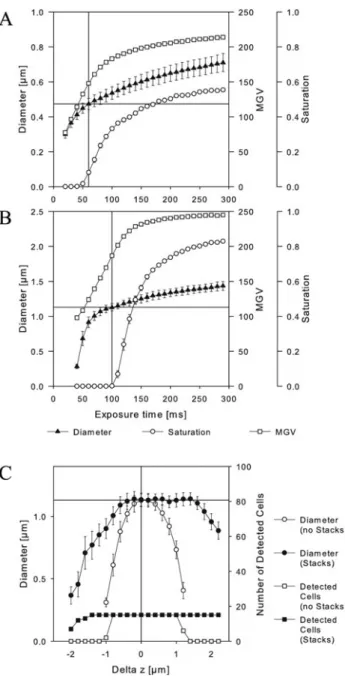
Fluorescent beads of two size classes ~diameter, 1.13 6 0.04 mm and 0.474 6 0.012 mm, FlowCheck High Intensity Green Alignment, Polysciences Inc., Warrington, PA, USA! were analyzed to test the dynamic thresholding method for object detection in the YABBA program and to assess the effect of exposure time and offset to the focal plane on the apparent size of objects. In addition, cells from a bacterial strain with high phenotypic plasticity @Flectobacillus major ~DSMZ 103!# were imaged and their cell volumes as given by the different algorithms were subsequently determined. Imaging was carried out on an AxioImager.Z2 ~Zeiss, Ger-many!, using an AxioCam MRm and a 63 ⫻ Objective ~Plan-Apochromat, NA: 1.4!. Image acquisition was par-tially automated using the software AxioVision 4.8 ~Zeiss! and the Visual Basic for Applications module therein. Bacte-ria were filtered onto 0.22 mm pore size membrane filters ~Osmonics, diameter: 25 mm! and stained with DAPI ~Hob-bie et al., 1977; Porter & Feig, 1980!. Fluorescent beads were dropped onto microscope slides and embedded in immer-sion oil after evaporation of the solvent.
Exposure Time Series
A single field of view ~FOV! containing fluorescent beads ~n⫽ 44, bead diameter: 0.474 mm! was imaged at different exposure times ~0–300 ms, D⫽ 10 ms!. The procedure was repeated on a preparation with 1.13 mm beads ~n ⫽ 15!. The diameter of beads ~calculated from the area! as well as the mean gray value and the fraction of saturated pixels per bead were determined by the YABBA program.
Focal Plane Offset Series
A single FOV containing 15 beads ~diameter: 1.13 mm! was imaged at different offsets from the focal plane ~⫺2–2 mm,
D⫽ 0.2 mm!. At every location, a single image and a stacked image were acquired. Stacked images consisted of seven images 0.4 mm apart from each other and were converted into a single image using the wavelet-based extended depth of field algorithm ~EDF! provided in AixoVision. Images were processed by the YABBA program to count the beads and to measure their size ~calculated from the area!.
R
ESULTSValidation of the New Algorithm and Comparison
The error of the new algorithm was assessed by the analysis of digital images derived from well-defined geometrical mod-els of commonly observed bacterial morphologies ~Fig. 3!. The formulas in Table 1 allowed for the determination of the true volume from the measured area from each model. Images as depicted in Table 1 were subjected to the YABBA program that calculated cell volumes of each shape by five different algorithms ~Fry, Sieracki, Bloem, Blackburn, Zeder!. The error of each method is shown as the ratio of the true volume to the algorithms volume in Table 1. The ratio of volumes determined by our new algorithm to the actual volumes ranged from 0.98 to 1.03 ~Mean ⫽ 1.00; SD ⫽ 0.01!. The other algorithms performed as follows: Fry: Min⫽ 0.70, Max ⫽ 1.01, Mean ⫽ 0.96, SD ⫽ 0.08; Sieracki: Min⫽ 0.98, Max ⫽ 6.30, Mean ⫽ 1.51, SD ⫽ 1.29; Bloem: Min⫽ 0.70, Max ⫽ 1.41, Mean ⫽ 1.02, SD ⫽ 0.17; Blackburn: Min⫽ 0.71, Max ⫽ 2.06, Mean ⫽ 1.16, SD ⫽ 0.35.Analysis of Bacterial Cells
Images of bacterial cells from a culture of Flectobacillus major were analyzed to demonstrate the effect of cell mor-phology on the error of different cell volume calculation methods. The estimates of the four previously described methods were compared to our new method on a single cell level ~Fig. 4A–D!. The analyzed bacteria comprised rods of different lengths as well as filamentous and curved morphol-ogies. These morphotypes correspond to the models 3, 6–8, 12–16, and 18–20 in Table 1. Eight bacterial cells with different morphologies ~Fig. 4E! were specifically high-lighted by individual symbols in the plots of Figure 4. As predicted by the validation procedure, all analyzed bacterial morphologies gave similar results upon application of Fry’s algorithm and our new algorithm ~Fig. 4A!. The results by the algorithms of Blackburn and Sieracki, however, differed from ours ~Fig. 4B,C!: the volumes of larger filamentous cells, especially when they were curved, were overestimated, as predicted in Table 1. The algorithm of Bloem resulted in similar results for almost all cells with the exception of two short, ellipsoid rods ~Fig. 4D!.
Analysis of Fluorescent Beads
Fluorescent beads of two different size classes were imaged under different conditions to quantify the effect of exposure time and deviation from the focal plane on size measure-ment ~Fig. 5A–C!. The exposure time series revealed that Figure 3. Geometrical models of 22 bacterial morphotypes.
Twenty-two bacterial cell morphologies were modeled using a CAD soft-ware. The models are parametric and solely depend on the variable
r. A three-dimensional representation ~A!, a dimensioned drawing
~B!, and the cross-sectional area that can be subjected to image analysis ~C! are shown for each model.
Ta b le 1 . Er ro rs of Differ ent M ethods.* Geomet rical M o dels of Bact er ia Er ro rs of Differ ent A lgor ithms No. Vo lu m e V ⫽ f~ r! Are a A ⫽ f~ r! Vo lu m e V ⫽ f~ A ! F ry and Da vies ~1985 ! Si er acki et al. ~1989 ! Bloem et al. ~1995 ! Blackbur n et al. ~1998 ! Zeder et al. ~This W o rk ! 1 4 {p{ 3 r 3 p{ r 2 0.752 {A 3 / 2 0.97 1.01 1.00 0.98 0.99 2
冉
4 ⫹ 3 3 {M
3 4冊
{p{ r 3冉
2 {p ⫺冉
p ⫺ 3M
3冊冊
2 {r 2 0.549 {A 3 / 2 0.85 0.98 0.86 0.97 0.99 3 8 {p{ 3 r 3 2 {p{ r 2 0.532 {A 3 / 2 1.01 0.99 1.41 0.95 1.00 4 16 3 {p{ r 3 4 {p{ r 2 0.376 {A 3 / 2 0.98 0.99 0.99 0.94 0.98 5冉
16 3 ⫹ 3 {M
3 4冊
{p{ r 3冉
5 {p 3 ⫹M
3 ⫹ 2 8冊
{r 2 0.393 {A 3 / 2 0.94 1.00 0.95 0.99 1.01 6 10 3 {p{ r 3 ~p ⫹ 4 !{ r 2 0.549 {A 3 / 2 1.01 1.01 1.37 0.99 1.00 7 28 3 {p{ r 3 ~p ⫹ 16 !{ r 2 0.350 {A 3 / 2 1.00 1.00 1.01 1.00 1.00 8 58 3 {p{ r 3 ~p ⫹ 36 !{ r 2 0.248 {A 3 / 2 1.00 1.00 1.00 1.00 1.00 9冉
11 6 ⫹ 3 {M
3 4冊
{p{ r 3冉
2 ⫹M
3 ⫹ 2 5 {p冊
3 {r 2 0.427 {A 3 / 2 0.83 0.98 0.83 0.93 1.02 10 11 3 {p{ r 3 ~p ⫹ 6 !{ r 2 0.417 {A 3 / 2 0.89 0.98 0.90 0.96 1.02 11 46 3 {p{ r 3冉
5 {p 2 ⫹ 12冊
{r 2 0.545 {A 3 / 2 0.95 1.00 1.38 0.95 1.03 ~cont inued !Ta b le 1 . C ont inued Geomet rical M o dels of Bact er ia Er ro rs of Differ ent A lgor ithms No. Vo lu m e V ⫽ f~ r! Are a A ⫽ f~ r! Vo lu m e V ⫽ f~ A ! F ry and Da vies ~1985 ! Si er acki et al. ~1989 ! B lo eme ta l. ~1995 ! Blackbur n et al. ~1998 ! Zeder et al. ~This W o rk ! 12
冉
3 {p 2⫹ 4 {p冊
3 {r 3 7 {p{ r 2 0.328 {A 3 / 2 0.99 1.09 0.99 1.08 0.99 13冉
6 {p 2⫹ 4 {p冊
3 {r 3 13 {p{ r 2 0.243 {A 3 / 2 0.99 1.62 0.99 1.49 0.99 14冉
3 {p 2⫹ 40 {p冊
3 {r 3 ~7 {p ⫹ 24 !{ r 2 0.229 {A 3 / 2 1.00 6.30 1.00 2.05 1.00 15冉
3 {p 2⫹ 40 {p冊
3 {r 3 ~7 {p ⫹ 24 !{ r 2 0.229 {A 3 / 2 1.00 1.14 1.00 1.12 1.00 16冉
p 2⫹ 40 {p冊
3 {r 3 ~4 {p ⫹ 24 !{ r 2 0.256 {A 3 / 2 1.00 1.30 1.00 1.28 1.00 17冉
~14 ⫺M
3 !p ⫺冉
4 ⫹ 3 p冊
{M
3冊
{r 3冉
3 {p 2 ⫹ 24 ⫺M
3冊
{r 2 0.297 {A 3 / 2 1.00 2.06 1.00 1.57 1.01 18冉
3 {p 2 16 ⫹ p冊
6 {r 3 p{ r 2 0.426 {A 3 / 2 0.99 1.00 1.00 1.00 0.99 19冉
3 {p 2 2 ⫹ 4 {p冊
3 {r 3 4 {p {r 2 0.426 {A 3 / 2 0.99 1.09 1.00 1.07 0.99 20冉
3 {p 2⫹ 4 {p冊
3 {r 3 7 {p {r 2 0.328 {A 3 / 2 0.99 1.52 0.99 1.44 0.98 21冉
9 {p 2 2 ⫹ 4 {p冊
3 {r 3 10 {p {r 2 0.276 {A 3 / 2 0.99 4.26 0.99 2.06 0.98 22 ~100 {M
6 ⫹ 1312 {r ⫺ 245 ! p 375 {r 2冉
M
3 100 ⫹ 377 {p 150 ⫹ 8冊
5 {r 2 0.374 {A 3 / 2 0.70 0.98 0.70 0.71 1.00 *F or m u las w er e de ve loped for 22 models of bact er ial ce ll mor p holog ies that ex pr ess vo lume and ar ea as a function of the radius and that ex pr ess vo lume as a function of the ar ea. Im ages of the pr oject ed ar eas of these models ~left co lumn ! w er e subject ed to fi ve d iffer ent m ethods for ce ll vo lume calculation. The relati ve d ev iations fr om the tr u e volume ~det er m ined b y ar ea m easur ement and application o f the co rr esponding for mulas ! ar e gi ven as the ratios o f the output b y the respecti ve method di vi ded b y the tr ue vo lume. D ev iations of mor e than 3% ar e p ri nt ed in bold lett ers.the measured sizes of beads increases with increasing expo-sure time ~Fig. 5A,B, triangles!. In addition to size, the mean gray value and the proportion of saturated pixels per bead were also determined ~Fig. 5A,B, circles and squares!. The correct size ~i.e., nominal diameter, indicated by horizontal lines in Fig. 5A,B! was obtained at the exposure time at the transition from no to few saturated pixels ~indicated by vertical lines in Fig. 5A,B!. In the examined range from 0 to 300 ms exposure time, the determined sizes ranged between approximately 0.6 and 1.5 times the correct diameter for 0.5 mm beads and 0.3 to 1.3 for the 1 mm beads, respec-tively, corresponding to 22–338% and 3–220% of the nom-Figure 4. Analysis of bacterial cells. Images of bacteria from a
culture were analyzed by the YABBA program. The results @bacte-rial cell volumes ~BCV!# of four published methods ~A: Fry, B: Sieracki, C: Blackburn, and D: Bloem! were compared to the new method described here. Each data point represents a single cell. For illustration purposes, images of some of the cells in the graphs ~A–D! are shown ~E!.
Figure 5. Effect of exposure time and focal plane offset on appar-ent cell size. Fluorescappar-ent beads @nominal size: 0.47 mm ~A! and 1.13 mm ~B!# were imaged at different exposure times. Diameter, mean gray value, and the fraction of saturated ~i.e., overexposed! pixels per bead were measured. Single images and image stacks were acquired at different distances off the focal plane ~C!, and the numbers of detected beads and bead diameters were assessed.
inal volumes. The time interval to obtain the correct diameter with 6 5% error was roughly 6 10 ms.
The effect of deviation to the focal plane on size mea-surement of beads was performed by imaging 1 mm beads at different offsets to the focal plane. Single images ~Fig. 5C, white symbols! as well as images obtained by z-stacking and application of an EDF ~Fig. 5C, black symbols! were ana-lyzed. Image quality decreases by increasing distance from the focal plane in both positive and negative directions. Our object detection by dynamic thresholding allowed for a correct determination of bead numbers within a distance of approximately⫺1 to ⫹1 mm to the focal plane for single images, and of ⫺1.4 to ⫹2 mm for the EDF image. On single images, the offset range that allowed for obtaining the correct diameter with 65% error was between⫺0.2 mm to ⫹0.4 mm. In the case of EDF images, the range was larger, i.e., from⫺0.6 mm to ⫹1.6 mm.
D
ISCUSSIONMorphology Independent Determination of
Bacterial Cell Volumes
Up to now, the rod model represents the quasi-standard for the estimation of bacterial cell volumes on microscopic images ~Fig. 1A–E!. Presumably this is due to its conceptual simplicity, ease of implementation ~that vary in details!, and lack of alternatives. The natural diversity of bacterial mor-phologies is not considered in this model, and, so far, no attempts have been made to systematically investigate the effect of this variability on the precision of cell volume determination. The goal of this work was to quantify this bias and to present a new algorithm that is largely un-affected by cell morphology. A crucial issue therein was to create a reliable system to test the quality of any cell volume calculation algorithm on specific bacterial morphol-ogies. This was achieved by constructing geometrical models of 22 commonly observed bacterial morphotypes ~Fig. 3!. Subsequently, formulas were deduced ~Table 1! that allowed calculating the true volume of these morphotypes on the basis of their cross-section area. The cross-section area ~in the ideal case! is probably the easiest and most accurate feature that can be observed when bacteria are imaged by wide field fluorescence microscopy and mea-sured by image analysis. With this analytical approach we could show that four common algorithms for cell volume determination are biased by cell morphology ~Table 1!. This was obviously due to the fact that the outline of the cell is not considered, except by Sieracki’s algorithm ~Fig. 1E!. This algorithm, however, is limited by the assump-tion of a straight major cell axis. In contrast, our algorithm is a generic solution that is based solely on the contour of a cell, with no more assumptions than local rotational symmetry.
Microscopic images of bacterial cells usually consist of only a few pixels ~Viles & Sieracki, 1992!. Due to the discretization, their outline primarily is an artificial con-struct of horizontal and vertical lines of 1 pixel length ~or of
1.414 pixel length at 458 angles, respectively!. A more “real-istic” contour representation ~in subpixel resolution! could be obtained by using elliptical Fourier descriptors ~Kuhl & Giardina, 1982! ~Fig. 2A–G!. Our algorithm then recursively divides this contour into triangles that are all perpendicular to the local axis of the cell. Finally, the cell volume is reconstructed by summing up the volumes of half-cylinders on the basis of the triangles. Our validation approach shows that this algorithm is largely unbiased by different cell morphologies and that its errors are minimal ~,4%! for all tested shapes ~Table 1!. Thus our approach will yield better overall precision when samples are analyzed that contain cells with a variety of morphologies ~Fig. 4!, as is the case in many natural environments. However, our algorithm is also more complicated to implement than others, and also com-putationally more demanding. We thus provide a stand-alone computer program as well as the documented source code of the algorithm. On an average personal computer, the program is able to analyze approximately 2 cells per second ~image segmentation and determination of cell vol-umes with the five algorithms!, and there is potential for optimization.
Unresolved Problems of Bacterial Cell Sizing
by Microscopy
It should be noted that there are other issues related to the estimation of bacterial biomass by microscopy that have not yet been resolved at a satisfactory level. A major problem seems to be the choice of the staining procedure used to visualize a cell by fluorescence microscopy. Nucleic acid stains, e.g., DAPI ~4',6-diamidino-2-phenylindole! or AO
~acridine orange!, are commonly used, but they yield differ-ent appardiffer-ent cell sizes ~Suzuki et al., 1993; Posch et al., 2001!. The same holds true when nucleic acid stains are compared to protein stains ~Straza et al., 2009!. Moreover, fluorescent signals may also emerge from other small ob-jects, e.g., viruses, which can make up most of the particles in water ~Isao et al., 1990; Wommack & Colwell, 2000!. Irrespective of these issues, the actual size measurement of fluorescently stained cells itself is far from trivial and re-quires proper calibration. Many authors refer to fluorescent beads for this purpose, although correct sizing of beads by microscopy is complicated ~Gretz & Duling, 1995!. More-over, beads are not necessarily good models for bacterial cells with respect to fluorescence properties, as the latter usually show lower and greater variance in brightness ~Viles & Sieracki, 1992!. Nonetheless, beads are the only widely available objects of known and constant size for size-measurement calibration; therefore, we also used beads to verify our thresholding method.
To demonstrate pitfalls of microscopic cell sizing that cannot be compensated for by a more precise algorithm for cell volume determination, we exemplarily assessed the ef-fects of variation in exposure time and of deviation from the focal plane. Both aspects are obviously of extreme importance for correct size measurements ~Fig. 5!. Even small deviations in exposure time from the optimal value
~i.e., the time where the brightest pixel of a bead is just close to saturation! will cause significant changes in measured bead size ~Fig. 5A,B!. Moreover, any deviation from the focal plane will quickly result in biased estimation of diam-eter that in turn will result in gross under- or overestima-tions of cell volumes. While precise focusing in manual microscopy is less problematic, it represents a critical issue in automated imaging. We have previously reported that the acquisition of z-stacks and subsequent application of an extended depth of field algorithm can substantially improve image quality and the precision of cell counting ~Zeder & Pernthaler, 2009!. Here, we show that the same holds true for size measurement ~Fig. 5C!.
In summary, we present a novel algorithm to calculate bacterial cell volumes from microscopic images that—in contrast to other approaches—is largely unaffected by cell morphology. We also present an analytical strategy for the verification of cell volume algorithms that should be consid-ered whenever new algorithms for this purpose are devel-oped or compared. It has to be stressed that this work is strictly focused on the correct volume reconstruction from the microscopic image of a cell, which is just one step on the way from environmental sampling to final biomass esti-mates. Nevertheless, our solution resolves the bias emerging from cell morphology, which already may be apparent in pure culture ~Fig. 4!, but certainly plays a role in natural microbial communities that often harbor a variety of cell shapes ~Young, 2006!. However, depending on the morpho-logical composition in a sample, e.g., if exclusively cocci and rod-shaped bacteria are present, it may also be legitimate to use a simpler algorithm. In this case we recommend apply-ing the algorithm described by Fry ~Fry & Davies, 1985; Fry, 1990! that performed well for all but a few morphologies ~Table 1!. By offering a free and easy-to-use stand-alone computer program, we hope that this method may find application in other studies.
A
CKNOWLEDGMENTSJudith Blom is acknowledged for providing the F. major strain. Rudolf Amann, Bernhard Fuchs, and Marcel Kuypers are acknowledged for valuable discussion.
R
EFER ENCESBergey, D. ~1994!. Bergey’s Manual of Determinative Bacteriology, 9th ed. Baltimore, MD: Williams & Wilkins.
Bertoni, R., Callieri, C., Corno, G., Rasconi, S., Caravati, E. & Contesini, M. ~2010!. Long-term trends of epilimnetic and hypolimnetic bacteria and organic carbon in a deep holo-oligomictic lake. Hydrobiologia 644, 279–287.
Bjørnsen, P.K. ~1986!. Automatic determination of bacterioplank-ton biomass by image analysis. Appl Environ Microbiol 51, 1199–1204.
Blackburn, N., Hagstrom, A., Wikner, J., Cuadros-Hansson, R. & Bjørnsen, P.K. ~1998!. Rapid determination of bacterial abundance, biovolume, morphology, and growth by neural network-based image analysis. Appl Environ Microbiol 64, 3246–3255.
Bloem, J., Veninga, M. & Shepherd, J. ~1995!. Fully automatic determination of soil bacterium numbers, cell volumes, and frequencies of dividing cells by confocal laser scanning micros-copy and image analysis. Appl Environ Microbiol 61, 926–936. Boyde, A. & Williams, R.A. ~1971!. Estimation of the volumes of
bacterial cells by scanning electron microscopy. Arch Oral Biol 16, 259–267.
Bratbak, G. ~1985!. Bacterial biovolume and biomass estima-tions. Appl Environ Microbiol 49, 1488–1493.
Burger, W. ~2008!. Digital Image Processing: An Algorithmic
Intro-duction Using Java. New York: Springer.
Carlson, C., Ducklow, H. & Sleeter, T. ~1996!. Stocks and dynamics of bacterioplankton in the northwestern Sargasso Sea. Deep Sea Research Part II: Topical Studies in Oceanography 43, 491–515.
Chrzanowski, T.H. & Simek, K. ~1990!. Prey-size selection by freshwater flagellated protozoa. Limnol Oceanogr 35, 1429–1436. Daims, H. & Wagner, M. ~2007!. Quantification of uncultured microorganisms by fluorescence microscopy and digital image analysis. Appl Microbiol Biotechnol 75, 237–248.
Falkowski, P.G., Barber, R.T. & Smetacek, V. ~1998!. Biogeochem-ical controls and feedbacks on ocean primary production.
Science 281, 200–207.
Freeman, H. ~1961!. On the encoding of arbitrary geometric configurations. IEEE Trans Electron Comput EC-10, 260–268. Fry, J.C. ~1990!. Direct methods and biomass estimation. Methods
Microbiol 22, 41–85.
Fry, J.C. & Davies, A.R. ~1985!. An assessment of methods for measuring volumes of planktonic bacteria, with particular ref-erence to television image-analysis. J Appl Bacteriol 58, 105–112. Gest, H. ~2004!. The discovery of microorganisms by Robert Hooke and Antoni Van Leeuwenhoek, fellows of the Royal Society. Notes Rec R Soc Lond 58, 187–201.
Gretz, J.E. & Duling, B.R. ~1995!. Measurement uncertainties associated with the use of bright-field and fluorescence micros-copy in the microcirculation. Microvasc Res 49, 134–140. Gundersen, H.J., Bagger, P., Bendtsen, T.F., Evans, S.M., Korbo,
L., Marcussen, N., Møller, A., Mnielsen, K., Nvengaard, J.R., Pakkenberg, B., Sørensen, F.B., Vesterby, A. & West, J.M. ~1988!. The new stereological tools: Disector, fractionator, nucleator and point sampled intercepts and their use in patho-logical research and diagnosis. APMIS 96, 857–881.
Hillebrand, H., Durselen, C.D., Kirschtel, D., Pollingher, U. & Zohary, T. ~1999!. Biovolume calculation for pelagic and benthic microalgae. J Phycol 35, 403–424.
Hobbie, J.E., Daley, R.J. & Jasper, S. ~1977!. Use of nucleopore filters for counting bacteria by fluorescence microscopy. Appl
Environ Microbiol 33, 1225–1228.
Isao, K., Hara, S., Terauchi, K. & Kogure, K. ~1990!. Role of sub-micrometre particles in the ocean. Nature 345, 242–244. Krambeck, C., Krambeck, H.J. & Overbeck, J. ~1981!.
Micro-computer-assisted biomass determination of plankton bacteria on scanning electron micrographs. Appl Environ Microbiol 42, 142–149.
Kuhl, F. & Giardina, C. ~1982!. Elliptic Fourier features of a closed contour. Comp Graph Image Processing 18, 236–258. Massana, R., Gasol, J.M., Bjørnsen, P.K., Blackburn, N.,
Hag-strom, Å., Hietanen, S., Hygum, B.H., Kuparinen, J. & Pedrós-Alió, C. ~1997!. Measurement of bacterial size via image analysis of epifluorescence preparations: Description of an inexpensive system and solutions to some of the most common problems. Sci Mar 61, 397–407.
Musat, N., Halm, H., Winterholler, B., Hoppe, P., Peduzzi, S., Hillion, F., Horreard, F., Amann, R., Jørgensen, B.B. & Kuypers, M.M. ~2008!. A single-cell view on the ecophysiology of anaerobic phototrophic bacteria. Proc Nat Acad Sci USA 105, 17861–17866.
Pernthaler, J., Pernthaler, A. & Amann, R. ~2003!. Automated enumeration of groups of marine picoplankton after fluo-rescence in situ hybridization. Appl Environ Microbiol 69, 2631–2637.
Pernthaler, J., Zöllner, E., Warnecke, F. & Jürgens, K. ~2004!. Bloom of filamentous bacteria in a mesotrophic lake: Identity and potential controlling mechanism. Appl Environ Microbiol 70, 6272–6281.
Porter, K.G. & Feig, Y.S. ~1980!. The use of DAPI for identifying and counting aquatic microflora. Limnol Oceanogr 25, 943–948. Posch, T., Franzoi, J., Prader, M. & Salcher, M.M. ~2009!. New image analysis tool to study biomass and morphotypes of three major bacterioplankton groups in an alpine lake. Aquat Microb
Ecol 54, 113–126.
Posch, T., Loferer-Krossbacher, M., Gao, G., Alfreider, A., Pernthaler, J. & Psenner, R. ~2001!. Precision of bacterio-plankton biomass determination: A comparison of two fluores-cent dyes, and of allometric and linear volume-to-carbon conversion factors. Aquat Microb Ecol 25, 55–63.
Schattenhofer, M., Fuchs, B.M., Amann, R., Zubkov, M.V., Tarran, G.A. & Pernthaler, J. ~2009!. Latitudinal distribu-tion of prokaryotic picoplankton populadistribu-tions in the Atlantic Ocean. Environ Microbiol 11, 2078–2093.
Seo, E.Y., Ahn, T.S. & Zo, Y.G. ~2010!. Agreement, precision, and accuracy of epifluorescence microscopy methods for enumera-tion of total bacterial numbers. Appl Environ Microbiol 76, 1981–1991.
Sieracki, M.E., Viles, C.L. & Webb, K.L. ~1989!. Algorithm to estimate cell biovolume using image analyzed microscopy.
Cy-tometry 10, 551–557.
Singleton, S., Cahill, J.G., Watson, G.K., Allison, C., Cum-mins, D., Thurnheer, T., Guggenheim, B. & Gmür, R. ~2001!.
A fully automated microscope bacterial enumeration system for studies of oral microbial ecology. J Immunoassay
Immuno-chem 22, 253–274.
Sommer, U., Gliwicz, Z.M., Lampert, W. & Duncan, A. ~1986!. The Peg-Model of seasonal succession of planktonic events in fresh waters. Archiv für Hydrobiologie 106, 433–471.
Straza, T.R.A., Cottrell, M.T., Ducklow, H.W. & Kirchman, D.L. ~2009!. Geographic and phylogenetic variation in bacterial biovolume as revealed by protein and nucleic acid staining.
Appl Environ Microbiol 75, 4028–4034.
Suzuki, M.T., Sherr, E. & Sherr, B.F. ~1993!. DAPI direct count-ing underestimates bacterial abundances and average cell size compared to AO direct counting. Limnol Oceangr 38, 1566–1570. van Veen, J.A. & Paul, E.A. ~1979!. Conversion of biovolume measurements of soil organisms, grown under various mois-ture tensions, to biomass and their nutrient content. Appl
Environ Microbiol 37, 686–692.
Viles, C.L. & Sieracki, M.E. ~1992!. Measurement of marine picoplankton cell size by using a cooled, charge-coupled device camera with image-analyzed fluorescence microscopy. Appl
En-viron Microbiol 58, 584–592.
Wommack, K.E. & Colwell, R.R. ~2000!. Virioplankton: Viruses in aquatic ecosystems. Microbiol Mol Biol Rev 64, 69–114. Young, K.D. ~2006!. The selective value of bacterial shape.
Micro-biol Mol Biol Rev 70, 660–703.
Zeder, M. & Pernthaler, J. ~2009!. Multispot live-image autofo-cusing for high-throughput microscopy of fluorescently stained bacteria. Cytometry A 75A, 781–788.
Zeder, M., Peter, S., Shabarova, T. & Pernthaler, J. ~2009!. A small population of planktonic Flavobacteria with dispropor-tionally high growth during the spring phytoplankton bloom in a prealpine lake. Environ Microbiol 11, 2676–2686.
Zhou, Z., Pons, M.N., Raskin, L. & Zilles, J.L. ~2007!. Auto-mated image analysis for quantitative fluorescence in situ hy-bridization with environmental samples. Appl Environ Microbiol 73, 2956–2962.