Power and coherence of sleep spindle frequency activity following hemispheric stroke
11
0
0
Texte intégral
(2) 374. J.M. Gottselig et al.. hemispheres may indeed play a crucial role in the regulation of vigilance states. Physiological experiments with an enceÂphale isole cat preparation (transected between caudal medulla and spinal cord) established that cortical activation facilitates waking EEG activity due to the presence of corticoreticular projections (Bremer and Terzuolo, 1954). The cerebral hemispheres have also been found to contribute to the generation of sleep EEG patterns. Compared with sham-operated controls, cats with bilateral frontal ablations showed a long-term decrease in total sleep time, particularly in rapid eye movement sleep duration (Villablanca et al., 1976). More recently, spindle oscillations were recorded from the thalamus of barbiturate-anaesthetized cats before and after unilateral decortication (Contreras et al., 1996). Removal of the cortex decreased the cross-correlations between signals recorded from distant (>1 mm apart) pairs of electrodes placed in the ipsilateral thalamus. In contrast, disrupting horizontal cortical connections by placing a cut through the suprasylvian gyrus did not decrease the crosscorrelations between distant (>5 mm apart) pairs of electrodes placed on the surface of the suprasylvian cortex, although such cuts did cause decrements in the crosscorrelations between signals recorded near the site of the tissue damage. Based on these results, the authors concluded that corticothalamic projections (and not horizontal intracortical connections) determine the global coherence of thalamic oscillations. More recently, theoretical models have provided additional insights into the mechanisms by which corticothalamic feedback could serve to support large-scale synchronization of spindle oscillatory activity (Destexhe et al., 1998). A number of investigators have reported sleep EEG changes following thalamic lesions in humans (in particular, effects on sleep spindles were noted, see Bassetti et al., 1996; Roth et al., 2000; Santamaria et al., 2000), yet there have been surprisingly few prior studies of the effects of extrathalamic hemispheric lesions on the human sleep EEG. On a fundamental level, such studies may help elucidate the neuroanatomical circuitry that underlies sleep EEG rhythm generation, and on a practical level, they may reveal clinically useful information such as the practicability of employing the sleep EEG for prognostic purposes or as an objective assessment of recovery from stroke. Hitherto, investigations of the effects of hemispheric stroke on the sleep EEG have revealed only minor effects, with partially discrepant ®ndings. One of the most common ®ndings was sleep fragmentation, as evidenced by decreased sleep ef®ciency, more stage 1 sleep and/or increased waking after sleep onset (Culebras and Miller, 1983; KoÈrner et al., 1986; Giubilei et al., 1992; Gasanov et al., 1998; Vock et al., 2001; MuÈller et al., 2002). Sleep fragmentation tended to improve over time (Giubilei et al., 1992; Vock et al., 2001). In acute stroke victims, it is possible that sleep fragmentation is not directly attributable to brain damage, but rather is a consequence of the acute psychological stress associated with having had a stroke and being hospitalized. Likewise, the depression of rapid eye movement sleep reported in two. studies (KoÈrner et al., 1986; Giubilei et al., 1992) might have been stress-related. Indeed, both sleep fragmentation and a reduction in rapid eye movement sleep are commonly observed `®rst-night effects' in sleep EEG recordings (Agnew et al., 1966; Toussaint et al., 1997). Based on visual analysis of the sleep EEG in patients with tumours or brain lesions, several authors observed reduced amplitude of sleep spindles (Cress and Gibbs, 1948; Daly, 1968; Hachinski et al., 1979; Hachinski et al., 1990; Bassetti and Aldrich, 2001). The reduction was generally most pronounced on the side ipsilateral to the pathology, but in some cases also extended to the contralateral hemisphere. Bassetti and Aldrich (2001) visually counted individual sleep spindles; the number was reduced bilaterally in patients with stroke volumes >25 ml. Spindles are a characteristic feature of stage 2 sleep; diminished spindle frequency activity might therefore account for decreases in the duration of stage 2 sleep following stroke (Hachinski, 1977; Hachinski et al., 1979; Bassetti and Aldrich, 2001). Hachinski and colleagues proposed that the presence of stage 2 sleep could predict clinical outcome (Hachinski, 1977; Hachinski et al., 1979). It is thus conceivable that sleep spindle frequency activity would also be of prognostic value. Previous studies of the sleep EEG in human subjects with brain lesions have suffered from several important weaknesses. (i) Sleep apnoea was not taken into account. Because sleep apnoea is prevalent in patients with cerebrovascular disease (Bassetti and Aldrich, 1999), studying unselected groups of stroke patients may reveal alterations in the sleep EEG that are caused by sleep apnoea rather than brain damage per se. (ii) Many studies either completely lacked controls or compared acutely hospitalized stroke patients with healthy controls. The use of age-matched hospitalized controls helps rule out non-speci®c effects due to age (Landolt and BorbeÂly, 2001), the hospital environment and the psychological stress of having a disease. (iii) The EEG derivations recorded were sometimes not described clearly (e.g. no information was given about reference electrode placement) and the authors frequently did not state which derivation was used for scoring. This lack of information renders statements about differences between patients with right and left hemispheric strokes uninterpretable. (iv) In a few studies, sleep was pharmacologically induced; thus, the ®ndings may differ from natural sleep recordings. (v) Often, the lesion localization was not reported. (vi) Recordings may have either been short or taken during the daytime, outside patients' normal sleeping hours. (vii) Most prior results were based entirely on visual inspection of the sleep EEG. Such results may be biased if scorers are not blind to the clinical status of the patients. In comparison with previous studies, the present study had numerous methodological advantages. Sleep apnoea patients were excluded and stroke patients were compared with hospitalized controls who were matched to the patients in terms of age. We used standard scoring criteria, and scoring was based on recordings taken over the hemisphere.
(3) Sleep spindles after stroke contralateral to the lesion. The effects of medication that might in¯uence the sleep EEG were taken into account, and such medications were avoided whenever possible. We included only patients for whom MRI data were available. Recordings were made at night, during patients' normal sleeping hours. In order to track the time course of recovery, multiple all-night sleep recordings were made during the acute, subchronic and chronic phases of stroke. Finally, we present what is arguably the most detailed analysis of sleep spindle frequency activity following hemispheric stroke, employing power spectral and coherence analyses. These may provide a more sensitive and objective measure of sleep EEG changes than visual scoring of sleep stages. Based on prior reports, we hypothesized that: (i) power and coherence of sleep spindle frequency activity would be signi®cantly depressed in EEG derivations recorded over the hemisphere ipsilateral to the lesion; and that (ii) this depression would improve during the course of recovery.. Method. The protocol for the study was approved by the ethics committee of the University Hospital of Bern.. Subjects. The subjects were patients with a ®rst, neuroradiologically con®rmed unilateral hemispheric stroke (brain damaged subjects or BDs n = 30, 17 female) and hospitalized control subjects (HCs n = 12, six female) with peripheral neurological diseases not affecting the central nervous system. The BDs were aged 17±75 years (mean 6 standard error of the mean was 48.8 6 2.5 years) and the HCs were aged 26± 67 years (47.0 6 4.03 years). In accordance with the Helsinki Declaration, informed consent was obtained from all subjects. Exclusion criteria included: (i) sleep apnoea, as indicated by an apnoea±hypopnea index (AHI) >15 or an AHI >10 associated with excessive daytime sleepiness, de®ned as an Epworth Sleepiness Scale score >10; (ii) age <17 or >80 years; (iii) complicating medical conditions including stupor/ coma, major/uncontrolled psychiatric disease, severe heart failure, pneumonia or respiratory failure; and (iv) premorbid sleep disturbances as reported in a questionnaire administered prior to the recordings. BDs with thalamic lesions were excluded. Sleep breathing was assessed in all subjects using a previously validated recording system [Autoset (CPAP) (Milanova et al., 2000)]. In BDs, at least one all-night sleep EEG recording was obtained within the ®rst 10 days after stroke onset.. Anatomy. In all BDs, an MRI scan was performed within the ®rst 14 days after stroke onset. Twenty subjects had left hemisphere lesions and 10 had right hemisphere lesions. According to the classi®cation system proposed by Tatu et al.. 375. (1998), the topography of stroke was super®cial (pial/ super®cial branches of middle, posterior or anterior cerebral artery) in 17 BDs, deep (deep/perforating branches of middle, posterior or anterior cerebral artery) in seven, super®cial and deep in ®ve, and multiple in one. The volume of stroke ranged from 2±200 ml (53 6 10 ml).. Stroke assessment. Stroke outcome was assessed using the Barthel index (0±100; 100 = independent in activities of daily living) and the modi®ed Rankin scale (0±6; 0 = no symptoms, 6 = death) (Granger et al., 1979; National Institute of Neurological Disorders and Stroke rt-PA Stroke Study Group, 1995). Longterm outcome was assessed in 29 out of 30 patients (median of 12 months, range 2±19 months) post-onset.. Recordings. All recordings were made in the Department of Neurology at the University Hospital-Inselspital, in Bern. The recordings started between 8 p.m. and midnight, and lasted a minimum of 5 h and a maximum of 12 h (530 6 8 min). The EEG, submental EMG and electro-oculogram (differential recording) were recorded using a portable polygraphic amplifer (PS1; Institute of Pharmacology and Toxicology, University of ZuÈrich, Switzerland). The following EEG derivations were recorded: F3C3, C3P3, P3O1, F4C4, C4P4, P4O2, and C3A2 or C4A1. Signals were digitized and transmitted via a ®breoptic link to a notebook computer with a digital signal processor board. After analogue signal conditioning (high-pass ®lter ±3 dB at 0.16 Hz; low-pass ®lter ±3 dB at 70 Hz, ±28 dB at 256 Hz), the signals were sampled at 512 Hz, digitally ®ltered (EEG and electrooculogram low-pass ®lter at 30 Hz; EMG band-pass ®lter 20±50 Hz) and stored with a resolution of 128 Hz. Sleep stages were visually scored for 20 s epochs according to standard criteria (Rechtschaffen and Kales, 1968). These criteria recommend scoring based on C3A2 or C4A1; therefore, the referential derivation over the healthy hemisphere (C3A2 for right hemisphere-lesioned subjects and C4A1 for left hemisphere-lesioned subjects) was used for scoring purposes in order to minimize contamination of the EEG by signals from the lesioned hemisphere. (Some contamination is probably inevitable, considering that signals can be recorded over the operated hemisphere even in patients with complete hemispherectomies; see McCormick et al., 2000.) Furthermore, spectral power and coherence analyses (see below) were based on bipolar derivations, which should be even less susceptible to contamination by the opposite hemisphere than are referential derivations. A total of 72 recordings were collected and used in the analyses presented here. Each of the BDs had at least one acute phase (<10 days post-stroke) recording. Data from the earliest acute phase recordings for each BD subject were compared with the recordings obtained from the HCs. With.
(4) 376. J.M. Gottselig et al. of these 18 subjects had one or more recordings in the subchronic phase (11±35 days post-stroke). Partially overlapping sets of recordings were previously used to investigate the effects of stroke on sleep stages, slow-wave activity and their relationship to clinical outcome (Vock et al., 2001; MuÈller et al., 2002).. Data analysis Calculation of spectra and measurement of spindle peak sizes. Fig. 1 The method used for measuring the spindle peak sizes in the power and coherence spectra. The upper graph shows the power spectrum for sleep stage 2 (thin solid line) for one of the hospital controls. A power law function (dotted line) was ®tted to the data in the range 2±6 and 16±30 Hz (range used for ®tting represented by darker lines). The spindle peak size was determined by subtracting the ®tted value at the spindle peak frequency (y2) from the measured value at the spindle peak frequency (y1). The lower graph shows the coherence spectrum for sleep stage 2 (thin solid line) for the same individual. The mean of the coherence values in the frequency range 2±6 and 16±30 Hz (darker horizontal line) was used to determine the background level of coherence (dotted line). We subtracted this mean value (y2) from the peak value (y1) to determine the spindle peak size.. two exceptions, only one recording was obtained from each HC; here, only the ®rst night recordings from HCs were used in order to achieve better control for possible `®rst night effects'. To study possible alterations in the sleep EEG over time, one or more recordings in the chronic phase (>60 days post-stroke) were obtained in 18 of the BDs. In addition, nine. The power spectrum for each 20 s epoch (FFT routine, Hanning window, averages of ®ve 4 s epochs) was computed for each bipolar derivation. In addition, intrahemispheric coherence spectra (F3C3±P3O1, F4C4±P402) were calculated for each 20 s epoch [for computational details, see Achermann and BorbeÂly (1998)]. Coherence is a correlation measure in the frequency domain; the values vary on an arbitrary scale of 0±1 (see Fig. 1, bottom). The frequency resolution was 0.25 Hz, and frequencies up to 30 Hz were analysed. Artefacts were excluded based on visual inspection and a semi-automatic system to exclude artefacts; an epoch was excluded if power in the 0.75±4.5 Hz or 20±30 Hz band exceeded a threshold based on a moving average determined over 15 20 s epochs. Five derivations (each from a different subject) had extensive artefacts and were discarded. For each subject, the power and coherence spectra for all artefact-free epochs of stage 2 sleep were averaged. A mean of 68 6 2 artefact-free epochs contributed to the averages. Before averaging, the coherence values were transformed (the square root was taken and the resulting values were Fisher Z-transformed, as described by Achermann and BorbeÂly, 1998) to normalize their distribution and to generate equal variances for the values in each frequency bin; the resulting means were reverse-transformed to generate mean coherence spectra. Spindle peak sizes for each subject and each night were determined based on the mean, all-night spectra for stage 2 sleep. Using a manual cursor program, we marked the centre frequency of the spindle peak (10±16 Hz range) in the power and coherence spectra. If more than one peak was present, the peak with the higher frequency was marked (Werth et al., 1997). If no spindle peak was present, the peak size was considered to be zero. In marking spindle peaks in the power spectra, we used only the derivations in which spindle peaks are usually clearly visible in normal subjects (i.e. F3C3, P3O1, F4C4 and P4O2 were used, whereas C3P3 and C4P4 were not). In subsequent sections, FC and PO derivations will be referred to as anterior and posterior, respectively. We measured the size of the spindle peak relative to the rest of the spectrum as follows. (i) We used a ®tting procedure to determine the size of the background spectrum. As shown in the top graph in Fig. 1, a power law function was ®tted to the power spectrum (we did this by ®tting a straight line to the spectrum plotted on a log±log scale) in the range 2±30 Hz,.
(5) Sleep spindles after stroke. 377. Table 1 Sleep variables derived from visual scoring Variable. BDs (n = 30). HCs (n = 12). P-value. SE (%) SL (min) TST (min) WASO (min) REMS (min) SWS (min) Stage 1 (min) Stage 2 (min). 78.65 21.69 402.64 105.50 64.18 31.43 60.14 246.89. 88.33 26.69 425.86 50.36 81.11 39.08 62.67 243.00. 0.010* 0.335 0.264 0.004* 0.105 0.439 0.824 0.833. 6 6 6 6 6 6 6 6. 2.63 2.63 17.14 13.62 5.97 4.96 6.37 14.57. 6 6 6 6 6 6 6 6. 2.41 4.74 11.21 11.97 5.98 9.30 7.95 11.18. Values represent mean 6 SEM. The values given for BDs are based on the earliest acute phase recordings. P-values were calculated with t-tests. In cases where the homogeneity of variance assumption was not met as determined by a Brown Forsythe test, a Welch ANOVA (equivalent to an unequal variance t-test) was used. REMS = rapid eye movement sleep; SE = sleep ef®ciency, the percentage of time spent asleep from sleep onset until ®nal awakening; SL = sleep latency, time from lights off until onset of stage 2, 3, 4 or REMS; SWS = slow wave sleep (stages 3 and 4); TST = total sleep time; WASO = waking after sleep onset. *Statistically signi®cant difference (P < 0.05) between groups.. excluding the 6±16 Hz range, which contained the spindle peaks and sometimes also q and/or a peaks. Very low frequencies (<2 Hz) were not included because of their susceptibility to low frequency artefacts. For the coherence spectra (see bottom graph in Fig. 1), the mean coherence in the same frequency range (2±6 and 16±30 Hz) was used to determine the background level of coherence. (ii) We subtracted the ®tted value at the spindle peak frequency from the measured value at the spindle peak frequency. The resulting differences will subsequently be referred to as the spindle peak sizes.. Statistics. The dependent variables were the spindle peak sizes determined based on the all-night mean power and coherence spectra for stage 2 sleep. For statistical analyses and for calculation of means, the coherence spindle peak sizes were transformed (as described above) to normalize their distribution. Means and standard errors reported are based on retransformed values. The a value was set at the conventional level of 0.05, although marginally signi®cant results (P < 0.10) are also mentioned. Repeated measures analyses of variance (rANOVAs) were used to compare the effects of derivation location and/or group. The data ful®lled the assumptions necessary for testing with rANOVAs: they were approximately normally distributed and they demonstrated homogeneity of variance (determined using Brown Forsythe tests) and sphericity (determined using the Mauchly criterion test). Tukey's honestly signi®cant difference tests were used for post hoc comparisons. Pearson correlations were used to investigate the relationship between lesion size and spindle peak size.. Fig. 2 Mean spindle peak sizes from average all-night stage 2 power spectra of BDs (n = 30) and HCs (n = 12). BD values were determined based on the earliest available acute phase (<10 days post-stroke) recording. For HCs, means of left- and right-sided derivations are shown (these did not differ; see text). Error bars represent standard errors. contra = Contralateral to lesion; FC = frontocentral derivation; ipsi = ipsilateral to lesion; PO = parieto-occipital derivation. *Statistically signi®cant differences (see text).. Spearman rank correlations were used to explore the relationship between spindle peak size and clinical outcome.. Results. We expected maximal effects of stroke on the sleep EEG immediately following stroke onset. Therefore, we ®rst examined results from BD subjects' earliest acute phase recordings.. Earliest acute phase recordings Sleep variables. Table 1 summarizes sleep variables from the earliest acute phase recordings in BDs and from the recordings in HCs. Sleep ef®ciency was signi®cantly reduced in BDs and the duration of waking after sleep onset was signi®cantly increased. The other sleep variables did not differ signi®cantly.. Spindle peak sizes in the power spectra. Figure 2 shows the mean spindle peak sizes calculated from all-night stage 2 power spectra for BDs and HCs. Values for BD subjects were calculated using data from each subject's earliest (i.e. ®rst) acute phase recording. As can be seen in Fig. 2, the depression in spindle peak size in BD subjects was.
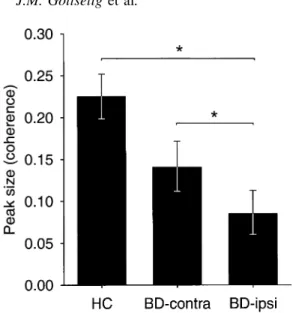
(6) 378. J.M. Gottselig et al. with controls, BDs showed a reduction in spindle peak sizes in both ipsilateral and contralateral derivations, but the reduction was more pronounced and reached statistical signi®cance only in the ipsilateral derivations.. Spindle peak sizes in the coherence spectra. Fig. 3 Mean spindle peak sizes from all-night stage 2 coherence spectra of BDs (n = 30) and HCs (n = 12). BD values were determined based on the earliest available acute phase (<10 days post-stroke) recording. For HCs, means of left- and right-sided derivations are shown (these did not differ; see text). Error bars represent standard errors. See Fig. 2 legend for abbreviations. *Statistically signi®cant differences (see text).. most pronounced in the ipsilateral posterior derivation. A two-way rANOVA with side of derivation (ipsilateral versus contralateral to the lesion) and location of derivation (anterior versus posterior) as factors revealed a signi®cant interaction [F(1,84) = 7.146, P = 0.009]. Post hoc tests indicated that the spindle peak size in the ipsilateral posterior derivation was signi®cantly smaller than the spindle peak size in any of the other three derivations. Before comparing BDs and HCs, we wanted to establish whether there might be any systematic hemispheric or anterior±posterior differences in the sizes of spindle peaks in controls. A two-way rANOVA with the factors side (right versus left) and location (anterior versus posterior) of derivation revealed no signi®cant main effects or interactions. Therefore, we ®rst compared BD data from ipsilateral derivations with the mean of left- and right-sided derivations from controls. A two-way rANOVA with the factors group (BD versus HC) and location (anterior versus posterior) revealed a signi®cant main effect of group [F(1,40) = 7.109, P = 0.011] but no signi®cant effect of location [F(1,38) = 3.359, P = 0.074]. The location by group interaction showed a trend towards signi®cance [F(1,38) = 3.269, P = 0.079], since the BDs showed greater depression of spindle peak sizes in the posterior than in the anterior derivation. Next, we compared patient data from contralateral derivations with the mean of left- and rightsided derivations from controls. A two-way rANOVA with the factors group (BD versus HC) and location (anterior versus posterior) demonstrated no signi®cant main effects or interactions, although the main effect of group was marginally signi®cant [F(1,40) = 3.657, P = 0.063]. Thus, compared. Figure 3 shows the mean spindle peak sizes calculated from all-night stage 2 intrahemispheric coherence spectra (i.e. F3C3±P3O1 and F4C4±P4O2). Values from BDs are based on the earliest acute phase recordings. We analysed the values from BDs using a single factor rANOVA with side (ipsilateral versus contralateral to the lesion) as the factor. The effect of side was signi®cant [F(1,25) = 4.898, P = 0.036], indicating that the intrahemispheric coherence peak was signi®cantly lower in the hemisphere ipsilateral to the lesion than in the hemisphere contralateral to the lesion. Before comparing BDs and HCs, we established that there was no signi®cant difference between left and right intrahemispheric coherence in HCs [F(1,11) = 0.325, P = 0.580]. A single factor rANOVA with the factor group showed that the BDs' mean spindle peak size in the ipsilateral hemisphere was signi®cantly smaller than the HCs' mean (average of right and left) spindle peak size [F(1,38) = 7.713, P = 0.009]. In contrast, the BDs' mean spindle peak size in the contralateral hemisphere was not signi®cantly different from the HCs' mean spindle peak size [F(1,38) = 2.648, P = 0.112].. Correlations between lesion size and spindle peak size. The peak sizes in the power spectra were negatively correlated with lesion volume in all four derivations (ipsilateral anterior r = ±0.499, P = 0.008; ipsilateral posterior r = ±0.111, P = 0.599; contralateral anterior r = ±0.220, P = 0.271; and contralateral posterior r = ±0.286, P = 0.157). Similarly, lesion volume was negatively correlated with the peak sizes in the coherence spectra (ipsilateral r = ±0.403, P = 0.046; contralateral r = ±0.360, P = 0.078). These correlations were weak, albeit in the expected direction in all cases. Thus, there was a general weak association between lesion size and the reduction in spindle peak sizes in the power and coherence spectra.. Correlation of spindle peak sizes with long-term outcome. To explore the usefulness of spindle peak sizes in predicting clinical outcome, we correlated subjects' spindle peak sizes in the earliest acute phase recordings with their outcome scores on the Barthel index and Rankin scale. The spindle peak sizes in the power spectra from the ipsilateral derivations showed a signi®cant correlation with scores on the Barthel index (ipsilateral anterior rs = 0.459, P = 0.012; ipsilateral posterior rs = 0.478, P = 0.012), but no signi®cant correlation with.
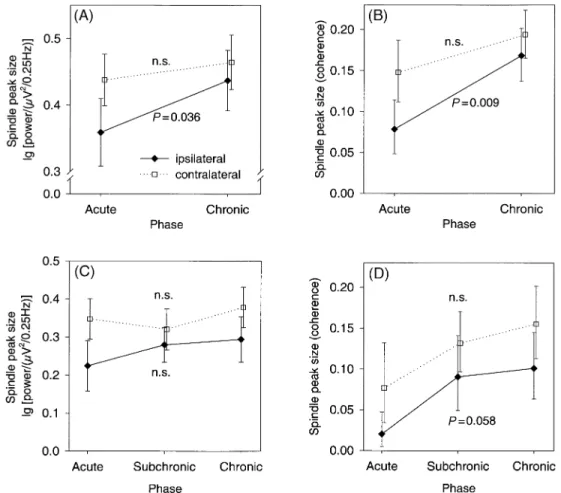
(7) Sleep spindles after stroke. 379. Fig. 4 Recovery over time in BDs. Filled diamonds signify values for derivations ipsilateral to the lesion and open squares signify values for derivations contralateral to the lesion. Error bars represent standard errors. rANOVAs were conducted as described in the text; Pvalues given are for the main effect of the factor phase. (A) and (B) show comparisons of the earliest acute (<10 days post-stroke) and latest chronic (>60 days post-stroke) phase recordings (n = 18). (C) and (D) show comparisons of acute, subchronic (11±35 days poststroke) and chronic phase recordings (n = 9). n.s. = not signi®cant.. scores on the Rankin scale. In contrast, spindle peak sizes in the power spectra from contralateral derivations showed no signi®cant correlation with Barthel or Rankin scores. Likewise, the spindle peak sizes from the ipsilateral coherence spectra showed a signi®cant correlation with scores on the Barthel index (rs = 0.502, P = 0.008), but no signi®cant correlation with scores on the Rankin scale. Spindle peak sizes in the coherence spectra from contralateral derivations showed no signi®cant correlation with outcome measures.. Recovery over time? Comparison of earliest and latest recordings. If the diminution in spindle peak sizes associated with acute stroke recovers over time, the maximal recovery should be observable by comparing data from the earliest recordings with data from the latest recordings. Therefore, we initially compared data from the earliest acute phase recordings with data from the latest chronic phase recordings. Eighteen of the BDs had both acute and chronic phase recordings.. Figure 4A shows the spindle peak sizes from the power spectra of derivations ipsilateral and contralateral to the lesion in the earliest acute and latest chronic recordings. First, a two-way rANOVA with the factors phase (acute versus chronic) and location of derivation (anterior versus posterior) was performed on the spindle peak sizes from derivations ipsilateral to the lesion. The main effect of phase was signi®cant [F(1,49) = 4.638, P = 0.036], whereas the other effects were not signi®cant. The same ANOVA model was then computed using the spindle peak sizes derived from the power spectra of derivations contralateral to the lesion. Neither the main effect of phase nor the phase by location interaction was signi®cant. Thus, comparison of the power spectra from the earliest acute recordings with the power spectra from the latest chronic phase recordings demonstrated a signi®cant increase in the spindle peak sizes in derivations ipsilateral to the lesion, but no signi®cant change in spindle peak sizes in derivations contralateral to the lesion. Figure 4B shows a similar pattern for the spindle peak sizes from the coherence spectra of derivations ipsilateral and contralateral to the lesion in the earliest acute and latest.
(8) 380. J.M. Gottselig et al.. chronic recordings. One-way rANOVAs with the factor phase (acute versus chronic) were performed on the spindle peak sizes from the ipsilateral and contralateral derivations. In the ipsilateral hemisphere, the main effect of phase was signi®cant [F(1,15) = 9.026, P = 0.009], whereas effect of phase did not reach signi®cance in the contralateral hemisphere [F(1,14) = 3.390, P = 0.090]. Thus, the sizes of the spindle peaks in the coherence spectra increased from the earliest acute to the latest chronic recordings in both hemispheres, but this increase was signi®cant only in ipsilateral derivations.. Comparison of acute, subchronic and chronic phase recordings. We also investigated possible recovery across time in the nine BDs who had recordings in the acute, subchronic and chronic phases. If multiple recordings were obtained within a phase, the average spindle peak size for that phase was used as the dependent variable. The spindle peak sizes from the power spectra (Fig. 4C) were analysed using rANOVAs with the factors phase (acute, subchronic, chronic) and location (anterior, posterior). For spindle peaks from ipsilateral derivations, neither the main effect of phase nor the phase by location interaction was signi®cant [main effect F(2,39) = 0.667, P = 0.519; interaction F(2,39) = 0.353, P = 0.705]. This was also true for spindle peaks from contralateral derivations (main effect F(2,40) = 0.510, P = 0.604; interaction F(2,40) = 0.635, P = 0.535]. Thus, no clear recovery in the spindle peak sizes of the power spectra was observed in this subset of nine BDs. Next, the spindle peak sizes from the coherence spectra (Fig. 4D) were analysed using rANOVAs with the factor phase. The main effect of phase was marginally signi®cant in the ipsilateral derivation [F(2,13) = 3.567, P = 0.058], but post hoc tests revealed no signi®cant differences between the peak sizes for any of the three phases. In the contralateral derivation, there was no signi®cant effect of phase [F(2,16) = 1.714, P = 0.212].. Discussion. Compared with hospitalized controls, subjects with acute brain lesions caused by hemispheric stroke showed signi®cantly reduced sleep ef®ciency and increased waking after sleep onset. These results are consistent with prior observations of sleep fragmentation following hemispheric stroke (Culebras and Miller, 1983; KoÈrner et al., 1986; Giubilei et al., 1992; Gasanov et al., 1998; MuÈller et al., 2002; Vock et al., 2001). While sleep fragmentation could be merely a consequence of the stress associated with having had a stroke, it might also be related to alterations in sleep-generating mechanisms (see below). Visual scoring of the sleep EEG did not reveal further differences between the sleep patterns of BDs and HCs, but detailed quantitative analyses of the sleep. EEG disclosed signi®cant alterations that were not immediately obvious upon visual inspection of the recordings. The most striking result was that power and coherence of sleep spindle frequency activity were signi®cantly reduced in EEG derivations recorded over the hemisphere ipsilateral to the lesion during the acute phase of stroke. Over the contralateral hemisphere, power and coherence of spindle frequency activity were also reduced, but the reduction was more pronounced over the ipsilateral hemisphere. Our ®ndings provide important new evidence that the cerebral hemispheres are involved in the generation of spontaneous sleep spindle frequency activity in humans. The stronger ipsilateral effect of cortical lesions on spindle oscillations accords with previous anatomical and physiological ®ndings. Morphological studies in the macaque monkey demonstrated that cortical inputs to some thalamic nuclei are exclusively ipsilateral; other thalamic nuclei receive either predominately ipsilateral or equally strong ipsilateral and contralateral cortical inputs (Preuss and Goldman-Rakic, 1987). In physiological experiments, stimulation of the cortex elicited spindles in the ipsilateral and contralateral thalamus, but ipsilateral effects were more pronounced (Steriade et al., 1972). The diminished spindle frequency activity that we documented might account for previously reported decreases in the duration of stage 2 sleep following stroke (Hachinski, 1977; Hachinski et al., 1979; Bassetti and Aldrich, 2001). Although clinicians have previously observed ipsilateral or bilateral reductions of sleep spindles in stroke patients, these studies did not involve quantitative spectral analyses and they were based on shorter recordings in individual patients or small subsets of patients. Moreover, our study is the ®rst to examine the coherence of sleep spindles in human subjects with brain lesions. The coherence analyses established reduced synchrony of spindle frequency activity following hemispheric stroke, consistent with animal studies that demonstrated a critical role of corticothalamic projections in generating globally coherent thalamic oscillations (Contreras et al., 1996). Another very interesting aspect of our study was the recovery of sleep spindle frequency activity. Comparison of the earliest acute and the latest chronic phase recordings revealed that, over time, the spindle peak sizes in the power and coherence spectra increased. These increases were statistically signi®cant only in ipsilateral derivations, presumably because there was more room for recovery on the ipsilateral side, where the initial degree of spindle depression was greater. In contrast, comparisons of spindle peak sizes across the acute, subchronic and chronic phases of stroke did not show signi®cant changes over time. Nonetheless, there was a general tendency for the spindle peak sizes to increase over time, especially in the coherence spectra (see Fig. 4C). Comparisons of the acute, subchronic and chronic phases probably did not yield signi®cant results because such comparisons were possible in only nine patients, limiting the statistical power of our comparisons. In addition, the.
(9) Sleep spindles after stroke degree of individual variability in recovery was large. Nonetheless, the overall tendency for recovery was clear and attests to the plasticity of the adult human nervous system. While the primary focus of the present study was to elucidate mechanisms of sleep spindle generation, we also explored the possible clinical implications of our ®ndings by correlating spindle peak sizes in the acute phase of stroke with measures of long-term outcome. The spindle peak sizes in the power and coherence spectra from the ipsilateral derivations showed a signi®cant correlation with scores on the Barthel index, but no signi®cant correlation with scores on the Rankin scaleÐperhaps because the Barthel index has a larger range of possible scores than the Rankin scale. Spindle peak sizes from contralateral derivations showed no signi®cant correlation with outcome measures. Thus, our results suggest that spindle peak sizes in ipsilateral derivations may be modestly predictive of stroke outcome, but these correlations were not large (r ~0.5) and are therefore not likely to be useful for predicting stroke outcome in individual patients. Nevertheless, EEG-based methods and other functional imaging methods will continue to provide valuable research tools for tracking physiological changes that accompany functional recovery from stroke (Weiller et al., 1992; Giaquinto et al., 1994; JuhaÂsz et al., 1997; Seitz et al., 1999; Vang et al., 1999; Herholz and Heiss, 2000). It may be particularly enlightening to track recovery using metabolic and electrophysiological measures during sleep, because sleep can accentuate functional asymmetries that are not necessarily visible during waking (Cress and Gibbs, 1948). The present study made numerous methodological improvements compared with previous studies. An especially important improvement was that our ®ndings could not have been confounded by the effects of sleep-disordered breathing (which is prevalent in cerebrovascular disease patients, see Bassetti and Aldrich, 1999), since we excluded subjects with sleep apnoea. In addition, we controlled for the psychological and environmental circumstances of BDs by using hospitalized controls. An intrinsic limitation of human lesion studies is that they rely on the lesions that are accidents of nature. For this reason, the BDs we studied had lesions of heterogeneous size and location. We noted the relationship between lesion volume and reductions in spindle peak sizes in power and coherence spectra. On the other hand, we could not establish any correlation between lesion location and spindle peak sizes, because the lesion loci were too diverse to allow such detailed analyses. Based on the results of Contreras et al. (1996), one might not expect lesion location to play a critical role, since any lesion involving corticothalamic projections could be associated with a reduction in the synchronous occurrence of sleep spindles. During the study, some of the subjects (both BDs and HCs) were taking medication for concomitant medical illnesses (e.g. hypertension). Prior to each sleep recording, two of the. 381. control subjects and two of the BDs took benzodiazepines as prescribed by their physicians. Benzodiazepines are known to increase spindle frequency activity by ~20% (Trachsel et al., 1990; Aeschbach et al., 1994). As a conservative correction for the use of benzodiazepines, we reduced the spindle peak sizes by 20% in the two controls who took them but did not alter the measured spindle peaks in the BDs who took them. Utilizing this correction, our analyses yielded the same signi®cances. Furthermore, the fact that power and coherence of spindle frequency activity were reduced to a greater extent over the ipsilateral than over the contralateral hemisphere supports our conclusion that the observed effects were caused by brain damage, as opposed to being secondary effects of medication, stress, ageing, or other non-speci®c factors. Functionally, sleep spindle oscillations are thought to block the ¯ow of sensory information to the cortex during sleep (Steriade, 2000), thereby promoting sleep continuity. Thus, attenuation of spindle oscillations in acute phase stroke patients might have caused or contributed to their sleep fragmentation (i.e. reduced sleep ef®ciency and increased waking after sleep onset). Another proposed functional role of sleep spindle oscillations is in regulation of neuronal plasticity and memory consolidation (reviewed by Sejnowski and Destexhe, 2000). Based on this proposal, one might predict that the observed recovery of spindle oscillations would be linked to plastic mechanisms that are crucial for functional recovery from stroke.. Conclusions. The present study demonstrated a signi®cant reduction in the power and coherence of sleep spindle frequency activity in EEG derivations recorded over the hemisphere ipsilateral to the lesion during the acute phase of stroke. This ®nding contributes to our understanding of the neuroanatomical systems that produce sleep EEG patterns, because it provides new evidence that the cerebral hemispheres are crucially involved in generating synchronous sleep spindles. In addition, we observed a signi®cant increase in the power and coherence of sleep spindle frequency activity from the acute to the chronic phases of stroke, suggesting that plastic mechanisms allowed the possibility of recovery.. Acknowledgements. We wish to thank Drs Matthias Bischof, Milena Milanova, Caroline MuÈller, Corinne Roth and Jacqueline Vock for help in data collection, Eva Gallman for help with data management, Dr Arto Nirkko for development of the computer program for MRI volumetry and Drs Alexander BorbeÂly and Hanspeter Landolt for comments on the manuscript. This research was supported by Swiss National Science Foundation Grant 32±49853.96 and Human Frontier Science Program Grant RG0131/2000-B R.
(10) 382. J.M. Gottselig et al.. References Achermann P, BorbeÂly AA. Coherence analysis of the human sleep electroencephalogram. Neuroscience 1998; 85: 1195±208. Aeschbach D, Dijk DJ, Trachsel L, Brunner DP, BorbeÂly AA. Dynamics of slow-wave activity and spindle frequency activity in the human sleep EEG: effect of midazolam and zopiclone. Neuropsychopharmacology 1994; 11: 237±44. Agnew HW Jr, Webb WB, Williams RL. The ®rst night effect: an EEG study of sleep. Psychophysiology 1966; 2: 263±6. Bassetti C, Aldrich MS. Sleep apnea in acute cerebrovascular diseases: ®nal report on 128 patients. Sleep 1999; 22: 217±23.. Reivich M, editors. Cerebral vascular disease. Amsterdam: Excerpta Medica; 1977b. p. 287±91. Hachinski VC, Mamelak M, Norris JW. Clinical recovery and sleep architecture degradation. Can J Neurol Sci 1990; 17: 332±5. Herholz K, Heiss WD. Functional imaging correlates of recovery after stroke in humans. [Review]. J Cereb Blood Flow Metab 2000; 20: 1619±31. Jones BE. Basic mechanisms of sleep-wake states. In: Kryger MH, Roth T, Dement WC, editors. Principles and practice of sleep medicine. Philadelphia: W.B. Saunders; 2000. p. 134±54.. Bassetti CL, Aldrich MS. Sleep electroencephalogram changes in acute hemispheric stroke. Sleep Med 2001; 2: 185±94.. JuhaÂsz C, Kamondi A, Szirmai I. Spectral EEG analysis following hemispheric stroke: evidences of transhemispheric diaschisis. Acta Neurol Scand 1997; 96: 397±400.. Bassetti C, Mathis J, Gugger M, LoÈvblad KO, Hess CW. Hypersomnia following paramedian thalamic stroke: a report of 12 patients. Ann Neurol 1996; 39: 471±80.. KoÈrner E, Flooh E, Reinhart B, Wolf R, Ott E, Krenn W, et al. Sleep alterations in ischemic stroke. Eur Neurol 1986; 25 Suppl 2: 104± 10.. Bremer R, Terzuolo C. Contribution aÁ l'eÂtude des meÂchanismes physiologique du maintien de l'activite vigile du cerveau. Interaction de la formation reÂticuleÂe et de l'eÂcorce ceÂreÂbrale dans le processus du reÂveil. Arch Int Physiol 1954; 62: 157±78.. Landolt HP, BorbeÂly AA. Age-dependent changes in sleep EEG topography. Clin Neurophysiol 2001; 112: 369±77.. Contreras D, Destexhe A, Sejnowski TJ, Steriade M. Control of spatiotemporal coherence of a thalamic oscillation by corticothalamic feedback. Science 1996; 274: 771±4. Cress CH, Gibbs EL. Electroencephalographic asymmetry during sleep (in patients with vascular and traumatic hemiplegia). Dis Nerv Syst 1948; IV: 327±9. Culebras A, Miller M. Absence of sleep-related elevation of growth hormone level in patients with stroke. Arch Neurol 1983; 40: 283±6. Daly DD. The effect of sleep upon the electroencephalogram in patients with brain tumours. Electroencephalogr Clin Neurophysiol 1968; 25: 521±9. Destexhe A, Contreras D, Steriade M. Mechanisms underlying the synchronizing action of corticothalamic feedback through inhibition of thalamic relay cells. J Neurophysiol 1998; 79: 999±1016. Gasanov RL, Gitlevich TR, Lesnyak VN, Levin Ya I. Structure of nocturnal sleep in patients with cerebral insult. Neurosci Behav Physiol 1998; 28: 325±9. Giaquinto S, Cobianchi A, Macera F, Nolfe G. EEG recordings in the course of recovery from stroke. Stroke 1994; 25: 2204±9. Giubilei F, Iannilli M, Vitale A, Pierallini A, Sacchetti ML, Antonini G, et al. Sleep patterns in acute ischemic stroke. Acta Neurol Scand 1992; 86: 567±71. Granger CV, Albrecht GL, Hamilton BB. Outcome of comprehensive medical rehabilitation: measurement by PULSES pro®le and the Barthel Index. Arch Phys Med Rehabil 1979; 60: 145±54. Hachinski VC. Sleep morphology and prognosis in acute cerebrovascular lesions. In: Meyer J, Lechner H, Reivich M, editors. Cerebral vascular disease. Amsterdam: Excerpta Medica; 1977a. p. 69±71. Hachinski VC, Mamelak M, Norris JW. Prognostic value of sleep morphology in cerebral infarction. In: Meyer J, Lechner H,. McCormick L, Nielsen T, Ptito M, Ptito A, Villemure JG, Vera C, et al. Sleep in right hemispherectomized patients: evidence of electrophysiological compensation. Clin Neurophysiol 2000; 111: 1488±97. Milanova M, Gugger M, Roth C, Bassetti C. Sleep apnoea in acute stroke: diagnosis, treatment, and evolution. Sleep 2000; 23: A281. Moruzzi G, Magoun HW. Brain stem reticular formation and activation of the EEG. Electroencephalogr Clin Neurophysiol 1949; 1: 455±73. MuÈller C Achermann P, Bischof M, Nirkko AC, Roth C, Bassetti CL. Visual and spectral analysis of sleep EEG in acute hemispheric stroke. Euro Neurol. In press 2002. National Institute of Neurological Disorders and Stroke rt-PA Stroke Study Group. Tissue plasminogen activator for acute ischemic stroke. New Engl J Med 1995; 333: 1581±7. Preuss TM, Goldman-Rakic PS. Crossed corticothalamic and thalamocortical connections of macaque prefrontal cortex. J Comp Neurol 1987; 257: 269±81. Rechtschaffen A, Kales A. A manual of standardized terminology, techniques and scoring system for sleep stages of human subjects. Bethesda (MD): National Institutes of Health; 1968. Roth C, Jeanmonod D, Magnin M, Morel A, Achermann P. Effects of medial thalamotomy and pallido-thalamic tractotomy on sleep and waking EEG in pain and Parkinsonian patients. Clin Neurophysiol 2000; 111: 1266±75. Santamaria J, Pujol M, Orteu N, Solanas A, Cardenal C, Santacruz P, et al. Unilateral thalamic stroke does not decrease ipsilateral sleep spindles. Sleep 2000; 23: 333±9. Seitz RJ, Azari NP, Knorr U, Binkofski F, Herzog H, Freund HJ. The role of diaschisis in stroke recovery. Stroke 1999; 30: 1844±50. Sejnowski TJ, Destexhe A. Why do we sleep? Brain Res 2000; 886: 208±23. Steriade M. Brain electrical activity and sensory processing during.
(11) Sleep spindles after stroke waking and sleep states. In: Kryger MH, Roth T, Dement WC, editors. Principles and practice of sleep medicine. 3rd ed. Philadelphia: W. B. Saunders; 2000. p. 93±111. Steriade M, Wyzinski P, Apostol V. Corticofugal projections governing rhythmic thalamic activity. In: Frigyesi T, Rinvik E, Yahr MD, editors. Corticothalamic projections and sensorimotor activities. New York: Raven Press; 1972. p. 221±72. Tatu L, Moulin T, Bogousslavsky J, Duvernoy H. Arterial territories of the human brain: cerebral hemispheres. Neurology 1998; 50: 1699±708. Toussaint M, Luthringer R, Schaltenbrand N, Nicolas A, Jacqmin A, Carelli G, et al. Changes in EEG power density during sleep laboratory adaptation. Sleep 1997; 20: 1201±7. Trachsel L, Dijk DJ, Brunner DP, Klene C, BorbeÂly AA. Effect of zopiclone and midazolam on sleep and EEG spectra in a phaseadvanced sleep schedule. Neuropsychopharmacology 1990; 3: 11± 18. Vang C, Dunbabin D, Kilpatrick D. Correlation between functional. 383. and electrophysiological recovery in acute ischaemic stroke. Stroke 1999; 30: 2126±30. Villablanca JR, Marcus RJ, Olmstead CE. Effects of caudate nuclei or frontal cortex ablations in cats. II. Sleep-wakefulness, EEG, and motor activity. Exp Neurol 1976; 53: 31±50. Vock J, Achermann P, Bischof M, Mueller C, Roth C, Bassetti C. Evolution of sleep and sleep EEG after hemispheric stroke. Sleep 2001; 24: 370. Weiller C, Chollet F, Friston KJ, Wise RJ, Frackowiak RS. Functional reorganization of the brain in recovery from striatocapsular infarction in man. Ann Neurol 1992; 31: 463±72. Werth E, Achermann P, Dijk DJ, BorbeÂly AA. Spindle frequency activity in the sleep EEG: individual differences and topographic distribution. Electroencephalogr Clin Neurophysiol 1997; 103: 535± 42. Received June 28, 2001. Revised September 7, 2001. Accepted September 10, 2001.
(12)
Figure

Documents relatifs