Phenotypic plasticity for life-history traits in Drosophila
melanogaster. III. Effect of the environment on genetic
parameters
M. D. GEBHARDT*t AND S. C. STEARNS
Zoologisches Institut, Rheinsprung 9, CH-4051 Basel, Switzerland {Received 11 November 1991 and in revised form 17 June 1992)
Summary
We estimated genetic and environmental variance components for developmental time and dry weight at eclosion in Drosophila melanogaster raised in ten different environments (all combinations of 22, 25 and 28 °C and 05, 1 and 4% yeast concentration, and 0-25% yeast at 25 °C). We used six homozygous lines derived from a natural population for complete diallel crosses in each environment. Additive genetic variances were consistently low for both traits (h2 around 10%). The additive genetic variance of developmental time was larger at lower yeast concentrations, but the heritability did not increase because other components were also larger. The additive genetic effects of the six parental lines changed ranks across environments, suggesting a mechanism for the maintenance of genetic variation in heterogenous environments.
The variance due to non-directional dominance was small in most environments. However, there was directional dominance in the form of inbreeding depression for both traits. It was pronounced at high yeast levels and temperatures but disappeared when yeast or temperature were decreased. This meant that the heterozygous flies were more sensitive to environmental differences than homozygous flies. Because dominance effects are not heritable, this suggests that the evolution of plasticity can be constrained when dominance effects are important as a mechanism for plasticity.
1. Introduction
In this paper, we report on an experiment designed to investigate the effects of two environmental factors, temperature and food concentration, on the com-position of the phenotypic variance of two life-history traits of Drosophila melanogaster, developmental time and weight at eclosion. A previous experiment with D.
mercatorum suggested additive genetic variance for
the shape of the response of the same two traits to a change in food concentration, and a sign change in the covariance between the two traits (Gebhardt & Stearns, 1988). This suggests that phenotypic plasticity and selection can interact in ways important for life-history evolution. For example, plasticity may affect the response to selection on the traits in different environments, because different amounts of genetic variance across environments could imply different heritabilities as well. Another possibility is the opportunity for selection on the plasticity itself, i.e. on
* Present address: Swiss Federal Office of Public Health, Epi-demiology and Infectious Diseases, CH-3097 Bern/Liebefeld, Switzerland.
t Corresponding author.
the shape of reaction norms, if a population lives in a heterogenous environment (Stearns & Koella, 1986; Via & Lande, 1985; de Jong, 1990).
We chose more than one trait because we were also interested in the correlation structure among different traits. We included temperature as a second en-vironmental factor because we wanted to know whether two factors with similar effects on the phenotype also have similar effects on the components of phenotypic variation, and whether one factor would modify the effect of the other. We chose the diallel design because it allows us to distinguish among more components of phenotypic variation than most other designs (Hayman, 1954; Cockerham & Weir, 1977).
2. Materials and methods (i) Flies
Twenty-one isofemale lines were established from inseminated D. melanogaster females caught at several sites in and around Basel, Switzerland, in late summer 1986. We consider the females as originating from a
Table 1. Genetic markers in the laboratory stocks used for the derivation
of homozygous lines. See Lindsley and Grell (1968) for a description of the mutant phenotypes"
Label Zl SDX Females Males" Chromosome First FM3, y B yjmal C(\)DX, y w f par IsoW v24 Second SM5,Cy L2If
VTf
Third TM3, y+ Ser Sb" The par IsoW v24 chromosome is documented by W. Gehring's Drosophila Stock Center (Biocenter, Basel)
Table 2. Protocol for the derivation of homozygous lines from wild-type
males. In generations la and Ib, the same individual male is used to fertilize the females. Extracted chromosomes are marked by subscripts
( + [), other wild-type chromosomes shown by +
Generation 0 I II III IV V (a) (b) (a) (b) Females C(1)DX FM3 C(1)DX Daughter FM3 C(1)DX Daughter + , + 1 Daughters + , Daughters + , // Tf SM5 Sp If If from la SM5 + 2 / / Tf from II a + 2 + 2 from III + 2 + 2 from IV + 2 + 2 X TM3 Sb~ TM3
sb-Sb + TM3 Sb TM3 Sb TM3 + 3 + 3 + 3 Males + i + + 2 + i V + 2 Sons from Ib + i V + 2 + 1 V + 2 Sons from l i b + i V + 2 S o n s from III + 1 + 2 + 2 Sons from IV + . +2 + 2 + + 3 Sb + 3 TM3 + 3 TM3 + 3 TM3 + 3 TM3 + 3 + 3 + 3
single population because there are no obvious geographical barriers, distances between sites were only a few kilometres, and meteorological conditions such as wind direction change frequently. The females were maintained at a population size of 100-200 by serial transfer (Buzzati-Traverso, 1955) with a period of 7 days and 3 serial vials to minimize selection on developmental time.
About 1 year after the isofemale lines had been established, homozygous stocks were derived by stepwise extraction of the first, second and third
chromosomes using a protocol similar to that of Craymer (1984), with slightly different balancers and markers (Table 1). Table 2 shows the extraction protocol. It exploits the fact that recombination is suppressed in Drosophila males and that the sex chromosomes are passed from fathers to sons in crosses involving females of the attached-X stock (labelled 'SDX' in Table 1). The apparent disad-vantage of extra generations is more than compensated for because never more than two chromosomes are balanced simultaneously in an individual and a
reduction of the efficiency of the balancers is therefore avoided.
From each isofemale line, 10 replicate extraction lines were started. Presumably due to the expression of lethal alleles, many lines were lost, especially in the step that made the third chromosome homozygous. Of the 210 lines, 43 were left, which represented 18 of the 21 isofemale lines. Thus, most losses occurred among replicate lines from a given isofemale origin.
(ii) Hybrid dysgenesis
The homozygous lines were derived by crossing females from laboratory stocks and males originating from a natural population. Complications arising from P-M hybrid dysgenesis (Engels, 1983) had therefore to be considered because the laboratory stocks had the M cytotype. Although recent surveys of European populations suggested this would be unlikely (Anxolabehere et al. 1984), it was not known whether active P elements were present in the local natural populations. If present, P elements may cause female sterility, recombination in males and muta-genesis, thus preventing the extraction of chro-mosomes from the wild-type males.
Crosses were made between females from the balancer stocks and wild-type males from the iso-female lines. The daughters were then back-crossed to the laboratory stocks in order to test them for sterility. No such case was found. The test was carried out at 28 °C, where dysgenic activity would have been highest: (Kidwell & Novy, 1979).
(iii) Experimental design
Six homozygous stocks were chosen from different isofemale lines but otherwise randomly. The use of homozygous stocks allowed us to produce the same homo- and heterozygous progenies repeatedly for testing in more environments than could be handled at once. They were used to set up the complete diallel crossing scheme which consisted of all 36 possible crosses among the stocks. The scheme was replicated within each environment in three randomized blocks. Each of the 30 heterozygous F1 families was rep-resented by one vial in each block, each of the 6 homozygous Fl families (identical to the parental stocks) by two vials. A block thus consisted of 42 vials that were randomly positioned in a device that sampled emerging flies at regular intervals to determine their developmental time (Stearns et al. 1987). Three such devices (each representing one block) were placed on separate shelves within the same climate chamber that controlled temperature to an accuracy of ± 0 1 °C and humidity to 8 0 ± 1 0 % .
The environments were defined by the following treatments. At each of three temperatures (22, 25 and 28 °C the main protein source, dead dry yeast, was given in three concentrations (40, 10 and 5 g kg"1
medium). In addition, a yeast concentration of 2-5 g kg"1 was used at 25 °C. The treatments were carried out one at a time and consisted of 3 main steps. First, the parental flies were raised under standardized conditions. Second, for each replicate vial, crosses were made using 7- to 8-day-old flies that had hatched from separate culture bottles to avoid environmental maternal effects. Groups of 12—15 females and 8 males were mated for 2 days. Eggs were laid separately for each replicate over 4 h at the experimental temperature in vials containing a me-dium with the experimental yeast concentration. Third, the day after egg laying, 12 larvae were collected for each replicate. They were placed in vials containing 2 ml of the experimental medium which were immediately moved back to the climate chamber. Emerging flies were sampled every 6 h until all had emerged. They were shock-frozen and the time interval of emergence was recorded. Later they were dried for 3 h at 70 °C and immediately weighed to the nearest 001 mg. A more detailed description of the culture medium and the experimental techniques is given in Gebhardt (1989).
(iv) Genetic analysis
A modified Hayman analysis (Hayman, 1954) was made by fitting a genetic model incorporating maternal effects (henceforth referred to as the maternal model, Walters & Gale, 1977):
YH =
= a+g(+g] + dtj + ml (for i 4= j),
where YtJ = the expectation of a cross among lines i and j ; a = the mean of the parental lines; gt = the additive genetic effect of the /th line (general combining ability, Griffing, 1956, or half the breeding value, Falconer, 1989); d(j = the dominance deviation; mt = the maternal effect of the rth line k(j = residual interaction effects.
The additive genetic (g,), maternal (m() and in-teraction (kt]) effects are assumed to be randomly distributed in the population with zero expectation and variances cr] (=VA/2, Griffing, 1956; Falconer 1989), a2m and a\, respectively. The dominance deviations were further subdivided as
where / is a fixed effect, the difference between mean performances of homozygous and heterozygous indi-viduals. It is a measure of mean directional dominance as may be caused by inbreeding depression. The /, and /0 parameters are assumed to be random variables in
the population with zero expectation and variances <r\t and (7,2y, respectively. The former are measures of
directional genetic dominance which is specific to the parental lines, and the latter are measures of residual genetic dominance effects which are specific to each individual. The li} parameters correspond to Griffing's
(1956) specific combining abilities and their variance
is equal to VD, the dominance variance in the
population (Falconer, 1989). Estimates for the par-ameters in this model were used to plot the effect of the environmental variables on the genetic com-ponents of the reaction norms.
In a preliminary factorial analysis of our data, where dams and sires were treated as main statistical effects (not shown), the sire mean square was sometimes larger than the dam mean square, indi-cating paternal contributions which are not considered in the maternal model. For this reason, variance components were estimated using a different genetic model, henceforth referred to as the bio-model (Cockerham & Weir, 1977). This model partitions the total phenotypic variance into the following six components: nuclear additive genetic (<r2n), nuclear
genetic interactions (erf), extranuclear maternal and paternal influences (<r2m and (r2p), higher interactions
among nuclear and extranuclear factors (<x£) and residual environmental factors (a*). For this analysis, the homozygous Fl families were omitted because inbreeding depression exhibited by them could have inflated the component cr2 (nuclear genetic inter-actions).
(v) Statistical methods
The experiments were designed with replication in three randomized blocks within each environment. However, mortality and unequal sex ratios in the replicates caused unbalanced numbers of individual data points or even empty cells in some blocks. The data were therefore analyzed as an unbalanced completely randomized design, because an analysis as a block design seemed unreliable. This reduced the efficiency of the statistical tests (Sokal & Rohlf, 1981).
The estimates for the parameters in the maternal model were obtained using the SAS-GLM procedure (Version 5, 1985). It is not possible to directly specify the maternal model in this procedure because of the special biological and statistical restraints imposed on some of the parameters (e.g. the symmetry of specific dominance effects, li} = l]t). The data were therefore
re-parameterized to include explicitly the effects corresponding to all 35 D.F. contained in the model as dummy variables. For example, the additive genetic effects in the maternal model were represented by five effects (g1 to g-a in the re-parameterized form,
corresponding to 5 D.F. among the six parental lines (the effect g6 was calculated according to the restraint
that the genetic effects sum up to zero).
Sums of squares (SS) were computed by model reduction. The SS for a particular effect was calculated as the difference between the SS of the full model and the SS of the model containing all parameters besides those corresponding to the effect of interest. The mean square of the replicates, which were specified as
random effects, was used as the error term in all F tests.
Because of the unbalanced nature of the data, restricted maximum likelihood was used to estimate the variance components in the bio-model (Shaw, 1987). Whenever possible, the log likelihood was calculated for the fully unconstrained model con-taining all six components (additive genetic, genetic interaction, maternal, paternal, higher interactions, and environmental) for both traits and their co-variances (18 parameters). The significance of a component was determined by calculating the log likelihood for a constrained model with the parameter of interest set to zero. Twice the difference between the log likelihoods for the constrained and the uncon-strained models is asymptotically distributed as x2 with 1 D.F. freedom (Shaw, 1987).
Because of limits imposed by the computing power required for maximum-likelihood estimates, means from replicate vials were used as datapoints. This does not bias the estimation of parameters or their standard errors, but reduces the power of the x2 test comparing log likelihoods.
3. Results
(i) Phenotypic response
The general effects of the environment on devel-opmental time and dry weight have been analyzed in detail elsewhere (Gebhardt, 1989; Gebhardt & Ste-arns, 1993) and only a qualitative account is given here.
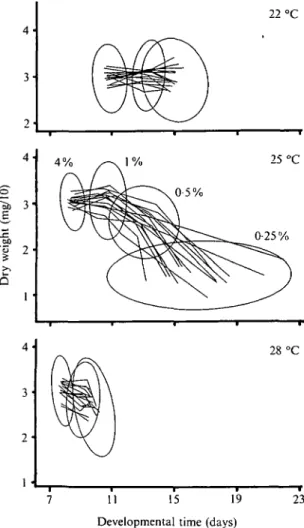
A decrease of yeast concentration generally caused decreased weight and increased developmental time (Fig. 1). Although there is considerable overlap of the phenotypic distributions among environmental con-ditions, the differences among environments are statistically significant (Gebhardt, 1989). There were significant interactions between the two environmental factors which are visible in Fig. 1 by the differences among slopes of the reaction norms at different temperatures. There were also significant genotype-environment interactions in both sexes with P < 0001 for almost all combinations of traits and environ-mental variables. Only the interaction between male dry weight and yeast concentration was not significant. The interactions could not be removed by scale transformations; this was expected because the re-action norms for the different genotypes crossed (Fig.
1)-(ii) Genetic analysis within environments
The analyses of variance were made with original and log-transformed data. We present only the results from the analyses of original data because no qualitative differences appeared between the two analyses.
22 °C 4 % (mg/10 ) j = Dr y we i 4- 3-2 • 1 • 4 %
v/v
^-x 1%Pi
\ 0-5% 25 °C 0-25% 28 °C 7 11 15 19 Developmental time (days)23
Fig. 1. Bivariate reaction norms (dry weight plotted against developmental time) for the heterozygous genotypes produced by the yeast gradient at the three temperatures (females only). The lines connect genotypic means obtained in each environment (reciprocal crosses pooled). The yeast concentration drops along the reaction norms from left to right as indicated on the 25 °C panel (no 0-25 % at 22 and 28 °C). The ellipses represent the bivariate phenotypic distributions in each environment and cover 75 % of the individual data points.
The ANOVA tables for the Hayman analyses (modified by incorporating maternal effects) are shown in Appendix Table 1 by environment, trait and sex. The main results can be summarized as follows (reference to particular environments is made by the following notation: 'temperature in °C/yeast con-centration in g kg"1').
There were significant differences among crosses in almost all environments for both traits and in both sexes (model MS). The only exception was dry weight in males in three environments (22/40; 25/2-5; 28/5). There was evidence for additive genetic effects (p item) in both sexes, in most environments, and for both traits. Significant effects were found more often for developmental time than for dry weight, and more often in females than in males.
There was strong evidence for dominance effects (b item) for developmental time in both sexes and most environments and for dry weight in the females. For
2 0 o. o -1 -2 1% 0-5% 22 25 Temperature (°C) 28
Fig. 2. The additive genetic contributions of the six parental lines plotted against temperature (within levels of yeast concentration as indicated on the panels) for developmental time. Plotted are estimates for the parameters g( in the maternal model with two standard errors (vertical bars). Only data from female flies are shown.
male dry weight, significant dominance effects were found only when both yeast concentration and temperature were high. The subdivision into direc-tional and non-direcdirec-tional components of genetic dominance showed that the latter (b3 item in the ANOVA table) made only a very small contribution to the overall significance of the dominance effects. The non-directional component reflects the dominance variation which would be found in a natural pop-ulation without the inbred parental lines (Griffing, 1956). The component due to mean directional dominance (bl item) was the most important com-ponent of dominance. As will be illustrated below, it reflects inbreeding depression in the parental lines. There was a trend that significances were higher for this component when the yeast concentration was higher, corresponding to larger absolute estimates for the / parameter in the maternal model at higher yeast concentrations (see below). A similar pattern showed up in part for the b2 item, which is also a measure of directional dominance. Variation in this component
indicates that the homozygous stocks differed in the extent to which inbreeding depression was exhibited. Maternal effects were also significant in many instances (c item). For developmental time, it appeared that significances were stronger at lower yeast con-centrations, at least at 25 and 28 °C.
(iii) Genetic parameters across environments The reaction norms shown in Fig. 1 were measured within homogeneous genotypes and reflect the changes of the total genetic effects across environments. The total genetic effects were broken into additive genetic effects (parameters gx to g6 in the maternal model) and
dominance deviations (various / parameters). Figs 2-5 show how the parameters changed across environ-ments for females. Males (not shown) were similar. Note that the parameters are relative to the population means in each environment and are therefore centered around zero.
The additive genetic effects of the six parental lines changed with temperature for developmental time (Fig. 2) and dry weight (Fig. 3) at each level of the yeast gradient. Similar plots were obtained when the parameters were plotted against the yeast concen-tration at each separate temperature (not shown). The plots can be interpreted as additive genetic reaction norms. It can be seen that they crossed each
5
Q
- 0 - 4
25 Temperature (°C)
Fig. 3. Same as in Fig. 2 for dry weight.
28 1 • 0 ' -1 • tim e ( c
1 o.
o. Devel o i 0 ' 2 • 22 °C ^ " — — — - _ _ _ _ ^ • . • \ .1
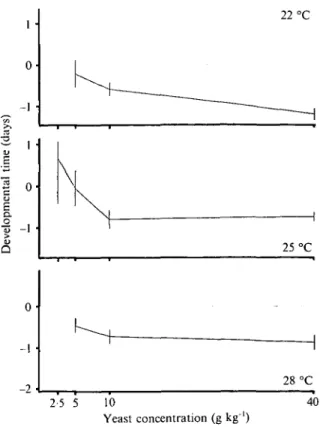
25 °C 28 °C 2-5 5 10 Yeast concentration (g kg'1) 40Fig. 4. Mean directional dominance (parameter / in the maternal model) plotted against yeast concentration (within temperatures as indicated on the panels) for developmental time. Vertical bars represent two standard errors of the estimates.
0-4 0 -0-4 "5b E -0-4 0-4 0 -0-4 22 °C 25 °C 28 °C 2-5 5 10 40 Yeast concentration (g kg"1) Fig. 5. Same as in Fig. 4 for dry weight.
other in a non-systematic way. Accordingly, when we computed the across-environment correlations of the parameter estimates, they were not significant. This shows that the genotype-environmental interactions visible in Fig. 1 (crossing reaction norms) have an additive genetic component.
22 °C "a CO we i >* Q 4 . 3. 9 , 1 • 4 % 1%
' ft
©
0-5% 25 °C 0-25 % . r N 28 °C « Heterozygous 0 Homozygous 11 15Developmental time (days)
23
Fig. 6. Comparison of homozygous and heterozygous flies that shows how inbreeding depression in the two traits changed with the environments (only females shown).
Ellipses indicating the bivariate data from each
environment are shown, as in Fig. 1 (dry weight plotted against developmental time). There is a pair of ellipses for each environment (filled for heterozygous genotypes, open for homozygous genotypes). Each panel (one for each temperature as indicated) assembles the data for the different yeast concentrations (dropping from left to right as indicated by the percentages on the 25 °C panel). The ellipses represent 95% confidence areas (analogous to two standard errors of the means) and indicate significant differences if they do not overlap.
concentration on the mean directional dominance (parameter /). At each temperature and for both traits, there was a clear trend that mean directional dominance was stronger at higher yeast con-centrations. Where the parameter was significantly different from zero, it was in a fitness-enhancing direction: when there was dominance, it caused increased weight and decreased developmental time. Temperature had a similar influence on the mean directional dominance of dry weight (stronger domi-nance at higher temperature), but there was no clear trend for developmental time (plots not shown).
In our analysis, mean directional dominance can be interpreted as a manifestation of inbreeding depression exhibited by the homozygous parental lines, as illustrated by Fig. 6. It is apparent that there were significant differences between the heterozygous and
the homozygous genotypes at the higher yeast concentrations (the corresponding filled and empty confidence ellipses do not overlap). The homozygous flies were slower and generally weighed less. These differences disappeared gradually with decreasing yeast concentration.
(iv) Variance components
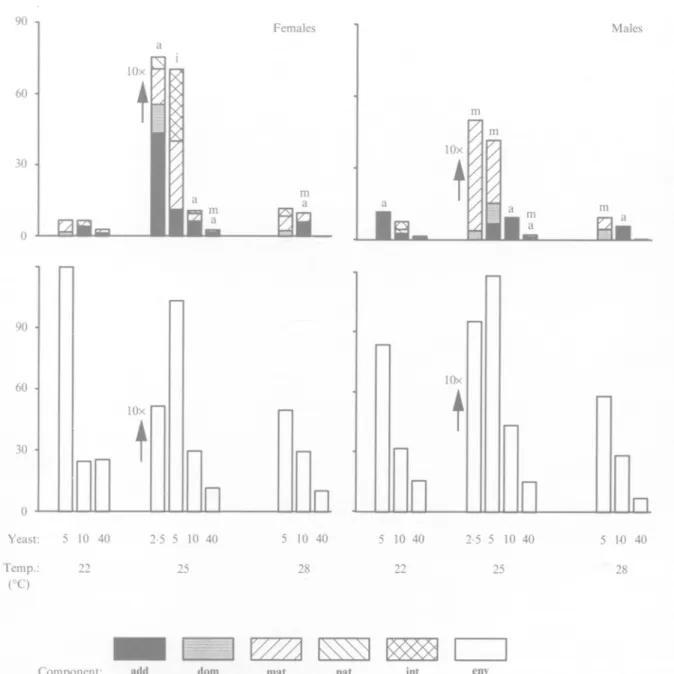
Figs 7 and 8 show the maximum-likelihood estimates for the variance components of the two traits, based on the bio-model that distinguishes between maternal and paternal effects. There were fewer statistically significant estimates than expected based on the Hayman ANOVAs. This is because the standard errors produced by maximum likelihood estimation are conservative (Shaw, 1987), and because we had to use replicate means as data due to computing limitations, which reduced the power of the tests. Therefore, only tentative inferences can be made, based partly on a comparison with the stronger tests available in the Hayman analysis.
In both sexes most variance components were higher at lower yeast concentrations for developmental time (Fig. 7). This is most clearly seen in the environmental component, but the other components generally scaled in parallel, although there were some exceptions (e.g. no additive genetic component was found for developmental time of males in 25/2-5). These exceptions probably occurred because large residual error reduces power. The component due to additive genetic effects was considerable in many instances, followed by dominance and maternal components. There were virtually no paternal con-tributions for developmental time, but higher inter-actions might have played some role in a few instances, mostly at lower yeast concentrations.
Taking the results of the Hayman analyses into account, we may conclude that the observed trends are real at least for the additive and the maternal components. The Hayman analysis was based on a modified genetic model that allows for maternal effects, avoiding the confounding of additive genetic and maternal effects. The only component that could have inflated the mean square for additive genetic effects in the analysis could be the paternal component, but it was zero for developmental time in almost all cases.
Temperature also influenced the variance com-ponents of developmental time (Fig. 7). However, the different components did not scale together as when yeast concentration changed. The environmental component changed differently across temperatures for each yeast level, while most other components appeared to be largest at the intermediate temperature. Narrow-sense heritabilities can be inferred from the variance components for each environment. They were low in general and ranged between 0 and 33 % (mean 11 % ) . Based on the maximum likelihood tests,
Variance x 100 90 T Males 30 90 6 0 • 30 0 lOx
_„ t
n
10xt
n
• — In
n
Yeast: 5 10 40 2-5 5 10 40 5 10 40 Temp.: 22 25 28 5 10 40 2-5 5 10 40 22 25 5 1-0 40 28Component: add dom mat pat int
Fig. 7. Variance components for developmental time (in days) as estimated from the bio-model. The components are: additive genetic (2<r;;), dominance (erf), maternal (<?„), paternal (o^), higher genetic interactions (al) and environmental (<rl). Note that the scale is reduced by a factor 10 at 2-5 g kg"1 yeast. For each column, the components that were statistically significant (P < 005) are indicated by the letters above the column ('a' for additive, 'm' for maternal, etc.). only 6 out of 20 were different from zero statistically.
The Hayman analysis suggested that there was some additive genetic variance of developmental time in almost all environments and in both sexes, but it was certainly not large.
For dry weight, the variance components showed no comparable trends with respect to the en-vironmental variables (Fig. 8). In general, most variance components were larger in females than in males for dry weight. Positive estimates for the additive genetic component were found in all environments for females and in most for males, and they were the largest contributions to the variation among the families in the diallels. Non-directional dominance was not important, and maternal effects were much
smaller for dry weight than for developmental time. However, there were several instances of sizable paternal effects, especially in females at the higher temperatures (25/2-5; 25/5; 25/40; 28/5; 28/40). Higher interactions are also suggested in several cases, especially in males.
Together with the Hayman analyses, these estimates suggest that there was additive genetic variation of dry weight but it was small: heritabilities were low, as for developmental time, with estimates ranging from 0 to 3 6 % (mean 12-5 %; 7 out of 20 statistically significant in the maximum likelihood analysis). Males showed less heritable variation for this trait than females, a trend supported by both the maternal model and the bio-model. However, some of the significances found
Variance x 10 80 Females Males 350 280 210 140 70 0
Da
n
Yeast: 5 10 40 Temp.: 22 2-5 5 10 40 25 5 10 40 28 5 10 40 22 2-5 5 10 40 25 5 10 40 28•
IZH
Component: add dom mat Fig. 8. Same as in Fig. 7 for dry weight (in mg).
in the Hayman analysis of female dry weight could be spurious and in fact due to paternal effects.
In several cases higher interactions other than genetic dominance were suggested for both traits. There are tests for such interactions based both on the maternal model (the d item) and the bio model (o-£). Both tests gave evidence for higher interactions in the same datasets, but with statistical significance only for developmental time in females in environment 25/5. 4. Discussion
We found that the components of phenotypic variation of developmental time and dry weight were influenced by temperature and yeast concentration in D.
melano-gaster. Although analogous results have been obtained
in other studies (e.g. Jinks & Pooni, 1987), the importance of such genotype-environment
inter-pat int
actions has not been considered in most quantitative genetic models of evolution (but see de Jong, 1990). First we discuss the relationship of our experimental flies to natural populations, and then the effects of different environments on the composition of genetic variation.
(i) Reference population
We used flies that were derived from a natural population. However, our parental lines may not have been fully representative of the natural genetic variation because the number of parental lines was small and because all recessive lethal alleles were lost when the lines were made homozygous. However, it has been found that recessive lethal alleles have little effect in heterozygotes (Simmons & Crow, 1977). Therefore, we assume that our reference population is
not the original natural population, but a derived population with gene frequencies defined by the six parental lines used for the diallel (Hinkelmann, 1977). We take this derived population as a model for natural populations because we assume that the effects of selection specific for laboratory environments were negligible between the time when the original sample of isofemales was taken and the time when the homozygous lines were derived, because the main-tenance procedures were chosen to reduce such selection as much as possible (Gebhardt, 1989). (ii) Components of genetic variation
(a) Additive genetic effects. The heritabilities were
consistently low in all environments. This result is typical for life-history traits (Roff & Mousseau, 1987). It appears that additive genetic variances for de-velopmental time were larger when the yeast con-centration was low. This was also observed for most other variance components, notably for the environ-mental component. Yeast concentration apparently had a very general scaling effect on the physiological system as both mean expression and most sources of variation were affected similarly (genetic, within-environmental effects, and developmental noise). In contrast, changes in temperature did not have such a scaling effect. No clear trend that relate the amount of additive genetic variance to temperature appeared for either trait (Figs 6, 7) although the means were strongly affected (Fig. 1). Similar observations were made by Murphy, Giesel & Manlove (1983) who found differences in heritabilities for several life-history traits in Drosophila simulans among tem-peratures, but without a clear pattern. A likely explanation for this lack of pattern is large standard errors combined with low heritability estimates.
Parsons (1987) reviewed results from experimental and field studies and concluded that genetic variances tend to be larger in more stressful environments, especially for traits closely related to fitness. This would suggest that the lower food levels in our experiments were more stressful for the flies but that the higher experimental temperatures were not. Parsons' generalization would also suggest that dry weight (not strongly affected by either factor) is less closely related to fitness than developmental time (affected by yeast concentration), a hypothesis that remains to be tested.
Several arguments have been put forward on the significance of phenotypic plasticity for evolution in heterogenous environments. For example, plasticity provides a mechanism for the maintenance of genetic variability if genotypes differ in their responses to environmental differences (Gillespie & Turelli, 1989). Empirical examples in plants have been given by Bradshaw (1965), and Mukai (1987) described a case where genotype-environment interactions may be responsible for the maintenance of genetic variance in
viability in natural populations of Drosophila. Using a quantitative genetic model of reaction norms, de Jong (1990) analyzed the case with two traits, where the mechanism is a change in the signs of the additive genetic covariances among the traits in different environments.
The data presented here suggest that the additive genetic effects of the parental lines changed ranks across environments for both traits (Figs 2, 3). This mechanism could play some role in the maintenance of genetic variation if the population were split into sub-populations spread over a heterogenous environ-ment with limited genetic exchange among them.
(b) Dominance. There was directional dominance
which could be interpreted as inbreeding depression in the homozygous lines, in accord with other studies on natural populations of Drosophila (Kearsey & Kojima, 1967; Mackay, 1985). It clearly depended on the yeast concentration for both traits and also on temperature for dry weight. It was stronger at higher yeast levels and at lower temperatures. Similar results were reported by Sork (1989) from a study on an annual plant and by Prabhu & Robertson (1961) from a study on Drosophila. In the former study, seed number and weight showed less inbreeding depression when the level of fertilizer was lowered. In the latter study it was found that inbred flies were 20 % smaller than crosses among them at 25 °C, but only 3% smaller at 18 °C. As in our study, the effect was due to the fact that the homozygous lines did not change as much among environments as the heterozygous lines, contrary to theories that predict a larger environmental sensitivity of homozygous genotypes (Lerner 1954; Gillespie & Turelli, 1989).
Following different arguments by Fisher (1931), Mather (1953) and Wright (1977), life history traits such as developmental time or weight are expected to exhibit directional dominance because of permanent directional selection on them. The pattern how yeast concentration and temperature influenced the strength of directional dominance in our experiments suggests that environmental factors such as food availability may influence the strength of directional selection on these traits in natural populations.
(c) Parental effect. Under most environmental conditions tested in this study, there was evidence for extranuclear parental effects. Maternal effects on insect development are well documented in the literature (Parsons, 1962; Delcour, 1969; Janssen et
al. 1988) and have been found to be important also for Drosophila in pilot experiments made in our laboratory
(unpublished data). Attempts have therefore been made to reduce this source of variability, at least as far as it concerns the maternal environment and maternal age: the virgin females hatched and were stored in separate vials for each replicate cross. We assume, therefore, that the observed effects were largely due to the maternal genotypes and not to the environments experienced by the females. Recent quantitative
models show that the evolutionary dynamics of traits can be influenced by maternal effects (Kirkpatrick & Lande, 1989). Because they were different among environments in our experiments for developmental time (stronger at lower yeast levels), we expect that they would also influence the evolution of phenotypic plasticity of this trait in environments with a hetero-genous food distribution. Reports by other vestigators document that maternal effects can in-fluence the sensitivity of development to environ-mental differences (Garrard, Harrison & Weiner, 1974, in mice; Murphy, Giesel & Manlove, 1983, in
Drosophila; Parker, 1984, in cockroaches).
In contrast to maternal effects, paternal effects are usually not expected in Drosophila melanogaster. The male does not contribute anything to the zygote in this species besides the nuclear genetic material (Markow & Ankney, 1988). Consequently no attempts are usually made to measure paternal variance com-ponents. There are few reports on the subject. Giesel & Nieman (1985) reported on an effect of parental exposure to alcohol on the expression of the mutant
vestigial, and Giesel (1988) reported on an effect of
photoperiod experienced by parents on the devel-opmental time and the response of this trait to larval density in their progeny. In both cases the effects were equally mediated by both parents. Cockerham & Weir (1977) mention meiotic drive (demonstrated in
Droso-phila) as a possible source for paternal effects.
Paternal effects would evidently have evolutionary implications similar to maternal effects, and the possibility that both may occur together would add to the complexity of the evolutionary process. If the phenomenon is general in natural populations, then one should check for both more frequently than is common practice. Paternal effects would inflate estimates of additive genetic variances and could also obscure the detection of maternal effects.
(d) Epistasis. There was circumstantial evidence
for epistatic interactions in some combinations of temperature and yeast level, not in others. This suggests that epistatic interactions would also be differently expressed in different parts of a hetero-genous environment, making the evolution of plas-ticity unpredictable. Scheiner & Lyman (1991) re-ported that they observed a negative response in the initial phase of a selection experiment on phenotypic plasticity in Drosophila. The unexpected response could have been the result of different epistatic interactions at the two temperatures they used for raising the larvae.
To conclude, our data show that the composition of phenotypic variance within a population may greatly depend on environmental factors such as temperature or food. Arguments that additive genetic variation could be maintained by mechanisms involving gene-environment interaction (crossing reaction norms) seem to be supported. On the other hand, the evolution of phenotypic plasticity could be constrained, because non-heritable components of gene expression may be involved in the plastic response between environ-mental conditions, either in clear patterns (directional dominance, perhaps maternal and paternal effects), or in ways not obviously related to the environmental factors (epistasis).
We thank H. Bachmann, T. Diggelmann and H. Zingerli who ran the laboratory and turned most of the data into computerized form. The manuscript was much improved by the comments of K. Bakker, D. Ebert, S. Henrich, E. Hillesheim, A. van Noordwijk, V. Perrot, and W. Scharloo and helpful suggestions by anonymous reviewers. W. Geh-ring and T. Kaufman provided laboratory stocks for the derivation of the homozygous lines, and advice on the ex-tracting scheme was given by H. Bellen and U. Kloter in W. Gehring's department. Financial support was provided by the Swiss National Fonds (grant nos. 3.642-084 and 3.643-087 to S.C.S.).
Appendix Table 1. Analyses of variance of the diallel tables for each
environment by sex and trait
Source Model P b bl b2 b3 c d Error (D.F.) D.F. 35 5 15 1 5 9 5 10
Mean squares for developmental time Males Females 7 = 22 °C; yeast = 5 g 2-961** 4-371*** 7-332*** 9-573*** 2-435 3-882* 0190 3-394 4-547* 5-264* 1-384 1-843 0-537 3-314 0-689 0943 1-520(89) 1-870(88)
Mean squares for dry weight Males kg-1 0-507*** 0-611** 0105 0051 0167 0081 0-607** 0075 0167(89) Females 0-983*** 0-580 0-711** 0-981 1-435*** 0-218 0-311 0-488 0-261 (88)
Appendix Table 1 (cont.) Source Model P b bl b2 b3 c d Error (D.F.) Model P b bl b2 b3 c d Error (D.F.) Model P b bl b2 b3 c d Error (D.F.) Model P b bl b2 b3 c d Error (D.F.) Model P b bl b2 b3 c d Error (D.F.) D.F. 35 5 15 1 5 9 5 10 35 5 15 1 5 9 5 10 35 5 15 1 5 9 5 10 35 5 15 1 5 9 5 10 35 5 15 1 5 9 5 10
Mean squares for developmental time Males Females r = 2 2 ° C ; yeast = 10 1-333*** 1-409*** 0-674 1150* 1039* 1-913*** 3-722** 21-014*** 0-536 1-337* 0-925 0-739 1-701** 0-432 0-731 0-643 0-528 (88) 0-443 (82) r = 2 2 ° C ; yeast = 40 1-263*** 2-940*** 1-496*** 4-677*** 2-494*** 5-324*** 29-344*** 64-699*** 1-059** 4-480*** 0-539 0-388 0106 0-752* 0-441 0-272 0-272 (84) 0-322 (84) r = 2 5 ° C ; yeast = 2-5 33-760*** 41-221*** 2-134 12-719 19-857 18-409** 0-640 3-768 3-963 14-213 28-822* 22-356** 73-586*** 50126*** 14-244 7-912 13-231(57) 6-873(57) T = 25 °C; yeast = 5 £ 5-945*** 6-976*** 3-574 0-221 3106 2082 0001 0001 3-456 2-781 3-387 2-127 7-955** 12-350*** 1-516 3-521* 1-842(82) 1-636(81) T = 25°C; yeast = 10. 2-481*** 2-920*** 2-825** 0-963 2172*** 2-648*** 21-632*** 17-849*** 3020** 2-452** 0-532 0-360 0-769 1-377* 0-660 0-742 0-703 (80) 0-555 (84)
Mean squares for dry weight Males gkg"1 0158* 0039 0137 0-003 0-224 0092 0124 0-158 0100(88) gkg-1 0124 0168 0139 0045 0091 0175 0-231* 0031 0098 (84) gkg"1 0-230 0-323 0157 0111 0144 0161 0-201 0-214 0166(57) ; kg- ' 0-364*** 0-766*** 0142 0005 0094 0184 0-478** 0107 0146(82) gkg"1 0-351* 0-281 0-329 0-240 0174 0-353 0-437 0123 0196(80) Females 0-481*** 1087*** 0-433** 0-511 0-576** 0-375* 0101 0-232 0-176(82) 0-456* 0-354 0-277 1108* 0-361 0178 0-251 0-152 0-261 (84) 0-377* 0104 0-267 1-240* 0-265 0-241 0-335 0166 0-226 (57) 0-504** 0-591* 0138 0001 0-123 0199 0-882** 0052 0-222(81) 1008*** 0-785** 0-644*** 4-278*** 0-400 0-203 0-566* 0-252 0-209 (84)
Appendix Table 1 {cont.) Source Model P b bl b2 b3 c d Error (D.F.) Model P b bl b2 b3 c d Error (D.F.) Model P b bl b2 b3 c d Error (D.F.) Model P b bl b2 b3 c d Error (D.F.) D.F. 35 5 15 1 5 9 5 10 35 5 15 1 5 9 5 10 35 5 15 1 5 9 5 10 35 5 15 1 5 9 5 10
Mean squares for developmental time Males Females r = 2 5 ° C ; y e a s t = 40gkg-1 0-878*** 1-706*** 0154 1-662*** 1-226*** 2-366*** 13-741*** 27-634*** 0-730** 1-662*** 0-215 0-200 0-592* 0-561** 0-221 0-305 0-202(86) 0182(83) 7"=28°C; yeast = 5 g k g - ' 1-537* 1-631*** 0-605 2-999*** 1-792* 1-821*** 1-378 7-782*** 1-730 1-476** 1-887* 1-679*** 1-287 4-210*** 0-587 0-661 0-875 (86) 0-439 (83) r = 2 8 ° C ; yeast = 10 g kg"1 1-598*** 1-919*** 4-763*** 6-363*** 1-816*** 2-908*** 19-811*** 24108*** 3-453*** 5-818*** 0-298 0-403 0-233 1066* 0-269 0-314 0-476 (80) 0-343 (75) r = 2 8 ° C ; y e a s t = 40gkg-1 1123*** 1014*** 2082*** 3191*** 2-028*** 2-097*** 18-843*** 23-339*** 1045*** 2-676*** 0032 0-229 0-262* 0-315 0073 0180 0106(82) 0-236(79)
Mean squares for dry weight Males 0149** 0182* 0146* 0-695** 0134 0102 0098 0054 0-673 (86) 0-489 0-271 0-324 0-748 0-476 0-243 0-300 0-562 0-401 (86) 0-585*** 0-215 0-484*** 1-282** 0-603** 0-238 0101 0-204 0155(80) 0-552*** 0-405* 0-892*** 6-457*** 0-325* 0036 0123 0137 0140(82) Females 1-391*** 0-822*** 0-257** 1-896*** 0121 0092 0-141 0084 0109(83) 0-953** 1-473* 0-724 2-685* 0-386 0-674 1085* 0-451 0-497 (83) 0-921*** 1091** 0-939*** 1-526* 1-569*** 0-321 0-709 0198 0-253 (75) 0-816*** 0-252 0-950*** 5-989*** 0-989** 0-318 0-887** 0136 0-239 (79)
The analyses are based on the Hayman model except that maternal effects are explicitly specified here (therefore Hayman's original a item is replaced by a p item (p for parental), which is not inflated by maternal effects).
Sources of variation are labelled: p for additive genetic effects; b for total genetic dominance; b l , b2, and b3 for mean directional, parent-specific directional, and cross-specific dominance components; c for maternal effects; d for higher interactions.
References
Anxolabehere, D., Kai, H., Nouaud, D., Periquet, G. & Ronsseray, S. (1984). The geographical distribution of P-M hybrid dysgenesis in Drosophila melanogaster. Ge'netique, Selection, Evolution 16, 15-26.
Bradshaw, A. D. (1965). Evolutionary significance of pheno-typic plasticity in plants. Advances in Genetics 13,115-155. Buzzati-Traverso, A. A. (1955). Evolutionary changes in
components of fitness and other polygenic traits in Drosophila melanogaster populations. Heredity 9, 153— 186.
Cockerham, C. C. & Weir, B. S. (1977). Quadratic analyses of reciprocal crosses. Biometrics 33, 187-203.
Craymer, L. (1984). A procedure for constructing isogenic stocks. Drosophila Information Service 60, 78-79. Delcour, J. (1969). Influence de Page parental sur la
dimension des oeufs, la duree de developpement, et la taille thoracique des descendants, chez Drosophila melano-gaster. Journal of Insect Physiology 15, 1999-2011. Engels, W. R. (1983). The P family of transposable elements
in Drosophila. Annual Review of Genetics 17, 315-344. Falconer, D. S. (1989). Introduction to Quantitative Genetics,
3rd edn. London and New York: Longman.
Fisher, R. A. (1931). Evolution of dominance. Biological Reviews 6, 345-368.
Garrard, G., Harrison, G. A. & Weiner, J. S. (1974). Genetic influences on mouse growth at 23 and 32 °C. Australian Journal of Biological Sciences 27, 197-204.
Gebhardt, M. D. (1989). The quantitative genetics of phenotypic plasticity of life history traits in Drosophila. PhD Thesis, University of Basel.
Gebhardt, M. D. & Stearns, S. C. (1988). Reaction norms for developmental time and weight at eclosion in Drosophila mercatorum. Journal of Evolutionary Biology 1, 335-354.
Gebhardt, M. D. & Stearns, S. C. (1993). Phenotypic plasticity for life history traits in Drosophila melanogaster. I. Effect on environmental correlations. Journal of Evolutionary Biology, (in the press).
Giesel, J. T. (1988). Effects of parental photoperiod on development time and density sensitivity of progeny in Drosophila melanogaster. Evolution 42, 1348-1350. Giesel, J. T. & Nieman, M. (1985). Effects of exposing
Drosophila melanogaster parents to ethanol on expression of vestigial in their progeny. Journal of Experimental Zoology 233, 467-471.
Gillespie, J. H. & Turelli, M. (1989). Genotype-environment interaction and the maintenance of polygenic variation. Genetics 121, 129-138.
Griffing, B. (1956). A generalised treatment of the use of diallel crosses in quantiative inheritance. Heredity 10, 31-50.
Hayman, B. I. (1954). The analysis of variance of diallel tables. Biometrics 10, 235-244.
Hinkelmann, K. (1977). Diallel and multi-cross designs: What do they achieve? In Proceedings of the First International Conference on Quantitative Genetics (ed. B. S. Weir, E. J. Eisen, M. M. Goodman and G. Nam-koong), pp. 659-676. Sunderland, Massachusetts: Sin-auer.
Janssen, G. M., de Jong, G., Joosse, E. N. G. & Scharloo, W. (1988). A negative maternal effect in springtails. Evolution 42, 828-834.
Jinks, J. L. & Pooni, H. S. (1987). The genetic basis of environmental sensitivity. In Proceedings of the Second International Conference on Quantitative Genetics (ed. B. S. Weir, E. J. Eisen, M. M. Goodman and G. Nam-koong), pp. 505-522. Sunderland, Massachusetts: Sin-auer.
Jong, G. de (1990). Quantitative genetics of reaction norms. Journal of Evolutionary Biology 3, 447-468.
Kearsey, M. J. & Kojima, K.-I. (1967). The genetic architecture of body weight and egg hatchability in Drosophila melanogaster. Genetics 56, 23-37. Kidwell, M. G. & Novy, J. B. (1979). Hybrid dysgenesis in
Drosophila melanogaster: sterility resulting from gonadal dysgenesis in the P-M system. Genetics 92, 1127-1140. Kirkpatrick, M. & Lande, R. (1989). The evolution of
maternal characters. Evolution 43, 485-503.
Lerner, I. M. (1954). Genetic Homeostasis. Edinburgh: Oliver and Boyd.
Lindsley, D. L. & Grell, E. H. (1968). Genetic variations of Drosophila melanogaster. Washington: Carnegie Institute. Publication no. 627.
Mackay, T. F. C. (1985). A quantitative genetic analysis of fitness and its components in Drosophila melanogaster. Genetical Research 47, 59-70.
Markow, T. A. & Ankney, P. F. (1988). Insemination reaction in Drosophila: found in species whose males contribute material to oocytes before fertilization. Evol-ution 42, 1097-1101.
Mather, K. (1953). The genetical structure of populations. Symposium of the Society for Experimental Biology 1, 66-95.
Mukai, T. (1987). Genotype-environment interaction in relation to the maintenance of genetic variability in populations of Drosophila melanogaster. In Proceedings of the Second International Conference on Quantitative Genetics (ed. B. S. Weir, E. J. Eisen, M. M. Goodman, and G. Namkoong), pp. 21-31. Sunderland, Massa-chusetts: Sinauer.
Murphy, P. A., Giesel, J. T. & Manlove, M. N. (1983). Temperature effects on life-history variation in Drosophila simulans. Evolution 37, 1181-1192.
Parker, Jr., E. D. (1984). Reaction norms of development rate among diploid clones of the parthenogenetic cock-roach Pycnoscelus surinamensis. Evolution 38, 1186-1193. Parsons, P. A. (1962). Maternal age and developmental
variability. Journal of Experimental Biology 39, 251-260. Parsons, P. A. (1987). Evolutionary rates under
environ-mental stress. Evolutionary Biology 21, 311-347. Prabhu, S. S. & Robertson, F. W. (1961). The ecological
genetics of growth in Drosophila. 5. Gene-environment interaction and inbreeding. Genetical Research 2,424-430. Roff, D. A. & Mousseau, T. A. (1987). Quantitative genetics
and fitness: lessons from Drosophila. Heredity 58, 103-118.
SAS (1985). User's Guide: Statistics, Version 5 edition. Cary, North Carolina: SAS Institute Inc.
Scheiner, S. M. & Lyman, R. F. (1991). The genetics of phenotypic plasticity. II. Response to selection. Journal of Evolutionary Biology 4, 23-50.
Shaw, R. G. (1987). Maximum-likelihood approaches ap-plied to quantitative genetics of natural populations. Evolution 41, 812-826.
Simmons, M. J. & Crow, J. F. (1977). Mutations affecting fitness in Drosophila populations. Annual Review of Genetics 11,49-78.
Sokal, R. R. & Rohlf, F. J. (1981). Biometry. San Francisco: W. H. Freeman and Company.
Sork, V. L. (1989). Effect of nutrient availability on inbreeding depression and seed paternity in a North American annual legume, Chamaecrista fasciculata. Second Congress of the European Society for Evolutionary Biology {Rome) (Abstract), 64.
Stearns, S. C. & Koella, J. C. (1986). The evolution of phenotypic plasticity in life-history traits: predictions of reaction norms for age and size at maturity. Evolution 40, 893-913.
Stearns, S. C , Diggelmann, T., Gebhardt, M., Bachmann, Walters, D. E. & Gale, J. S. (1977). A note on the Hayman H. & Wechsler, R. (1987). A device for collecting flies of analysis of variance for a full diallel table. Heredity 38, precisely determined post-hatching age. Drosophila In- 401-407.
formation Service 66, 167-169. Wright, S. (1977). Evolution and the Genetics of Populations.
Via, S. & Lande, R. (1985). Genotype-environment in- Chicago and London: The University of Chicago Press. teraction and the evolution of phenotypic plasticity.