Quantitative analysis of microstructures produced by creep of
Ti–48Al–2Cr–2Nb–1B: Thermal and athermal mechanisms
M. A. Morris and M. Leboeuf
Institute of Structural Metallurgy, University of Neuchˆatel, Av. Bellevaux, 51, 2000 Neuchˆatel, Switzerland
(Received 14 February 1997; accepted 5 June 1997)
A g-based TiAl alloy with equiaxed microstructure and fine grain size has been studied to analyze the deformation mechanisms responsible for the creep behavior. The microstructures produced by creep and high temperature deformation have been examined by TEM to obtain information about the different aspects characterizing the primary and secondary stages of creep. Mechanical twinning has been confirmed to occur in a fraction of the grains that never exceeds 50% while 1y2 k110l dislocations are active within all the g grains. The twins are only responsible for a small amount of strain, but they lead to a subdivision of the microstructure and determine (directly or indirectly) the hardening process observed during the primary stage of creep. We have proposed that during the secondary stage the creep rate is determined by the unblocking of pinned dislocations by processes such as a pipe diffusion or cross slip that allow thermally activated glide of 1y2 k110l dislocations on (001) planes.
I. INTRODUCTION
Titanium aluminides based on the two-phase (g 1 a2) microstructure are very attractive for intermediate
temperature (600 – 850±C) aerospace applications
be-cause of their excellent high temperature strength, low density, and good oxidation resistance.1,2 Considerable research effort has been devoted to study the creep deformation of this type of alloy and it has been shown that the creep resistance depends significantly on the
microstructure.3–8 The increase in creep resistance of
fully lamellar microstructures is generally attributed to
the a2 laths and gyg interfaces acting as barriers to
slip.4,9 On the other hand, it has been suggested that the decreased creep resistance of the duplex microstructure compared to that of the equiaxed g microstructure is a result of the increased glide mobility of 1y2 k110l dis-locations within the g matrix10 of the former. Although it is generally accepted that the alloys exhibit power law creep behavior, the values of the stress exponent,
n, appear to increase with increasing applied stress.9,11 This has been interpreted as being due to a transition from diffusional creep at low stresses to dislocation glide creep at high stresses.5,12–14
Although mechanical twinning during creep
deformation of TiAl alloys has been extensively reported,5,15–17 its contribution to the creep process is not easily interpreted since traditional creep theories do not include such contributions. Also it has been suggested that mechanical twinning differs between lamellar structures and equiaxed g grains.16
The present study has been carried out to exam-ine the creep behavior of an alloy of composition Ti – 48Al–2Cr –2Nb –1B with equiaxed microstructure
and fine grain size. The addition of boron prevented grain growth during high temperature forging carried out to reduce segregation. The aim of the study was to examine the creep resistance of such small grain size material and to relate it to the active mechanisms responsible for the deformation process. In particular, we have examined the influence of mechanical twinning on primary creep compared to that observed in alloys
with large grain size previously studied.17 Also, we
have separated the different contributions from glide of 1y2 k110l dislocations and twinning during the secondary stage of creep.
II. EXPERIMENTAL
The analyzed composition of the alloy used in the present study is Ti– 48Al –2Cr –2Nb – 1B (at. %). It was received in the as-forged state (carried out at 1150 ±C to 70% strain) and its microstructure examined before
and after annealing for 1 h at 1250 ±C followed by air
cool. This treatment produced an equiaxed microstruc-ture characterized by a distribution of small g grains
with the a2 phase distributed at boundaries and triple
junctions.
The creep tests were carried out in tension on cylindrical specimens machined to a diameter of 3 mm and with 28 mm gauge length. Their surfaces were subse-quently mechanically polished and electropolished using a solution of 5% perchloric acid in methanol. The creep machine used was equipped with Andrade’s type cam with a profile that allowed the stress to be maintained constant throughout the test. Tests were performed at
700±C for stresses ranging between 260 and 360 MPa.
unit which monitored the elongation of the specimens every second. The temperature of the specimens was
maintained constant with a precision of 60.2±C and
their elongation was monitored with a precision of about 62 mm. At the end of the creep tests, the specimens were rapidly cooled under load to avoid any disloca-tion rearrangement prior to microstructural observadisloca-tions. Also some tests were performed under stresses of 260 and 340 MPa to determine the activation energy of the creep process at constant structure by carrying out
fast temperature jumps every 15±C between 675 and
720±C. Between these jumps the structure was allowed
to stabilize before the next jump was performed in each case, ensuing that the new strain rate measured was characteristic of the controlling mechanism at the new temperature.
Microstructural analysis of the undeformed and de-formed specimens was perde-formed by x-ray diffraction, transmission electron microscopy (TEM), and scanning electron microscopy (SEM). The latter was carried out using crystallographic contrast from backscattered elec-trons to obtain information about any large scale sub-structure formation during the primary stage of creep. Quantitative measurements of the grain size, volume
fraction of the a2 phase, as well as other aspects of
the deformed structures were carried out using an image analyzer directly attached to the SEM which allowed accumulation of a large number of images. At least 300 grains were used for each measured condition.
For all TEM and SEM observations disks were cut perpendicular to the tensile axis from the deformed samples (i.e., the normal directions of the disks were parallel to the tensile axis) and electropolished. The electropolished samples were prepared by standard jet polishing techniques using a solution of 5% perchloric
acid, 30% butan-1-ol and 65% methanol at 220±C and
50 mA, but only the TEM samples were polished to produce a hole. Dislocation analysis was carried out from projected images obtained by tilting the specimens to different known orientations (zone axes) from which different diffraction vectors were chosen to obtain in-visibility under some contrast conditions. Weak beam images were taken using the g: 3g condition.
III. RESULTS
Figure 1(a) shows an example of the initial equiaxed microstructure of the annealed alloy obtained by atomic number contrast using backscattered electrons in the SEM. Quantitative measurements confirmed that the average size of the equiaxed g grains was about 12 6
2 mm and the volume fraction of a2 phase (seen as
brighter regions distributed along grain boundaries) was about 13%. Also present were large (about 1 – 5 mm in
size) TiB2 particles which were also analyzed by x-ray
(a)
(b)
FIG. 1. (a) Typical example of the initial equiaxed microstructure obtained by annealing at 1250±C. The bright regions correspond to the a2phase. ( b) X-ray spectrum obtained from the annealed material shown in (a).
diffraction as illustrated in the spectrum of Fig. 1( b). From the latter (as well as from the x-ray spectra obtained for any annealed condition) we confirmed, by comparing the relative peak heights of the alloy with those from powder samples, that there was no preferred orientation or specific texture in the material. Although the forged material contained a high density of defects, both in terms of low angle boundaries and individual dislocations, the annealed alloy that was used for creep and tensile tests was initially dislocation-free, with only some isolated grains still containing low angle boundaries.
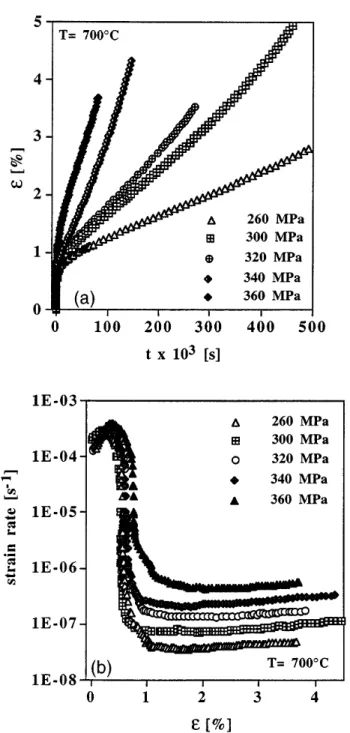
The strain-time curves obtained from the tensile creep tests are shown in Fig. 2 together with curves showing the variation of strain rate as a function of strain. From the latter we confirmed that the initial in-stantaneous strains obtained on loading are not sensitive
FIG. 2. (a) Typical strain-time curves and ( b) corresponding strain rate variation as a function of strain obtained from the creep tests carried out under different applied stresses.
to applied stress, ranging between 0.4 and 0.6% for the two extreme stresses of 260 and 360 MPa used in the present study. Also the initial strain rates ranged between 2 and 4 3 1024s21and decreased rapidly during the first
1% strain. Generally the strain rate reached minimum values at about 1.5 – 2% strain, and ranging between
3 3 1028 and 4.5 3 1027 s21 for the lower and higher
stresses used. Thereafter the strain rate remained rather constant to about 3% strain and slowly accelerated after 3 – 3.5% strain. Most tests were performed to about
4 – 5% strain. Other tests were interrupted at intermediate strains between 0.8 and 3% to analyze the evolution of the deformed microstructures. From temperature jumps carried out during the secondary stage of creep (between 1.5 and 2.6% strain), we have measured an activation energy of 430 kJymol independent of the applied stresses used for the tests.
In parallel, tensile tests were also performed at
700±C under constant strain rate control mode using
strain rates ranging between 3 3 1024and 4 3 1026 s21.
From these tests we remeasured the values of flow stress at 0.2% strain, the maximum flow strength and the tensile ductility, given in Table I. Also from these tests the work hardening rates were measured as a function of strain and the values are shown in Fig. 3. The hardening rate decreases steadily with strain and is ten times higher at about 0.2% strain than at about 3% deformation. The tensile ductility of the samples varied between 2 and 6% for the higher and lower strain rates used, respectively.
Finally additional tensile tests were performed at
700±C using strain rate jumps over a wide range of
strain. From these tests we have determined the acti-vation volume, V , characterizing the mechanism
con-TABLE I. Data from tensile tests (strain rate controlled).
Strain rate (s21) s0.2(MPa) smax(MPa) e (%)
3 3 1024 398 530 1.93
3 3 1025 360 503 1.53
1 3 1025 347 433 2.3
4 3 1026 335 456 6.1
FIG. 3. Plot of strain hardening versus strain measured from the tensile test carried out at constant strain rate 4 3 1026s21.
trolling the deformation process as given by V mkT
(D ln ÙeyDsd, where m 3 is the Taylor factor, k the
Boltzmann constant, T the absolute temperature, Ùe the
strain rate, and s the corresponding stress. The value
measured, V (7.5 6 0.5) 3 10227 m3, was confirmed
to be strain independent. Such a value corresponds to
about V 330 6 25b3, where b 2.83 3 10210 m
is the Burgers vector of either a single 1y2 k110l or a dissociated 1y2 k101l superdislocation.
A. Deformed microstructures
The main feature observed in the deformed micro-structures of this alloy was the extensive twinning activ-ity which was already observed after only 0.8% strain in the specimens crept at the lower stress of 260 MPa. As seen in Fig. 4 some grains were already deformed by several twin systems, as analyzed in the example shown. Detailed diffraction analysis of these twins and others observed under different conditions of strain or applied stress confirmed that they all exhibited the true twin relationship between the matrix and the twinned layer. In this sense the twinned interfaces were exactly the same as the gyg interfaces of the true-twin type
producing a rotation of 180±around a k111l pole and
analyzed in some of our previous work.18,19This twinned microstructure was confirmed to be produced by emis-sion and glide of 1y6 k112l dislocations on h111j planes confirming our previous studies18,19 and those by other authors.20
On the other hand, a large number of grains deform both by mechanical twinning and glide of single disloca-tions and their density was rather high even after strains as low as 0.8%. This is the case of the example shown in Fig. 5 (using two diffraction conditions) from the specimen crept under 340 MPa. The tensile axis of this
grain was near [010] (15±away) and we note that all the dislocations active in the entire grain are invisible with
g 002; therefore they are 1y2 k110l segments. At this
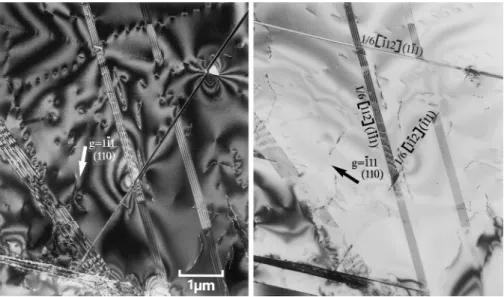
higher stress, detailed analysis of the line directions was carried out from grains containing a lower dislocation density such as the one illustrated in Fig. 6. In this grain the tensile axis was close to [110], and besides the twin we see long dislocation segments with Burgers vector 1y2 [1¯10] (visible with g ¯111 and 1¯11) which have screw character, confirming that the short edge segments propagate by trailing the long screw segments behind. In all cases the long screw segments exhibit pinning points along their lines, with debris and small dislocation loops also detected.
However, many other grains did not deform by me-chanical twinning and, although much effort was denoted to investigate a large number of grains in search for other modes of deformation involving superdislocations, only single 1y2 k110l dislocations were observed in all the grains. Figure 7 shows another example of a grain also deformed to 0.8% strain under 260 MPa which
did not deform by twinning, and where only 1y2 k110l
dislocations were active. In this figure we see a grain whose tensile axis was [011], and the images taken under different diffraction conditions confirm the presence of both systems, namely 1y2 [110] (visible with g ¯1¯11)
and 1y2 [1¯10] (visible with g ¯220). In both cases
the directions of the long segments have been analyzed as the corresponding screw directions while the short segments have pure edge orientation. Thus, the two line directions of each dislocation define the (001) plane on
which both types of 1y2 k110l dislocations propagate
trailing the long screw segments behind. The Schmid
factor for these slip systems is m 0.35. Also seen in
these micrographs are large, elongated loops with the
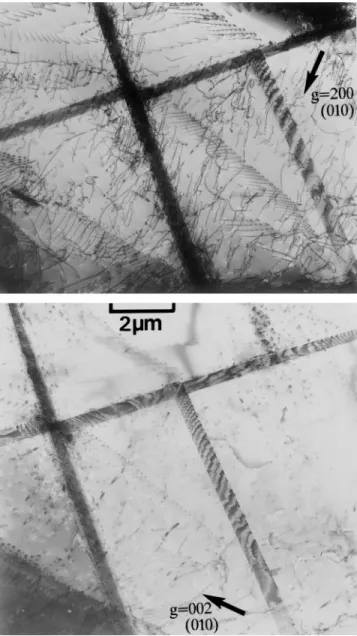
FIG. 5. Typical deformed microstructure observed after 0.8% creep strain under 340 MPa. The tensile axis of this grain is close to [010] (see text for details).
same 1y2 k110l Burgers vector and also lying on the
(001) plane.
After higher creep strains, the major differences observed were the higher density of dislocations and mechanical twins active within given grains. Figure 8 shows an example of a grain observed after 1.5% strain crept under 340 MPa. Here the tensile axis was close
to [110] (about 10±) and two twin systems are active
together with a high dislocation density. Practically all
the dislocations are invisible with g 002
determin-ing their Burgers vector as 1y2 k110l. In the image taken
with g ¯1¯11 we note that only a small fraction
re-main visible, and these have a Burgers vector 1y2 [110]. This means that the large majority of the dislocations
ob-served with g 1¯11 belong to the primary slip system
FIG. 6. Typical microstructure observed after 0.8% creep strain under 340 MPa from which Burgers vectors and line directions have been analyzed (see text for details).
and have a Burgers vector 1y2 [1¯10]. The trace
analy-sis has confirmed that the line direction between pinning points of the bowed segments is [1¯10]; therefore, it is the screw segments that are pinned along their lines.
FIG. 7. Typical example of a grain with a tensile axis [001] and deformed by 1y2 k110l slip (see text for details). Creep conditions s 260 MPa, e 0.8%.
Two major twin systems have been analyzed, namely 1y6 [112] (¯1¯11) and 1y6 [¯1¯12] (111) both of which have
Schmid factors m 0.48 for the specific grain
ori-entation. Figure 9 shows another grain observed after the same creep conditions (namely 1.5% strain under 340 MPa) in which an increase in twinning activity is confirmed compared with samples deformed to lower strains. The tensile axis for this grain is [121] and the major twins subdividing the grains correspond to
the system 1y6 [112] (¯1¯11) which has a Schmid factor
m 0.47 for this grain orientation. Also seen are
dislocations analyzed as 1y2 [110] (001) with a Schmid
factor m 0.23. From this creep condition we show in
Fig. 10 detailed images taken by weak beam contrast at two different orientations to allow analysis of the twins and measurement of the twinned layer thickness. The latter was carried out by measuring the spacing between interfaces when the twins are imaged vertically in the foil [as seen in Fig. 10(b)]. The values measured were 20–30 nm and 40 –50 nm after respective strains of 0.8 and 2.6% for a stress of 260 MPa (as in Fig. 4) and became about 100 nm after 2.6% strain under 360 MPa. Figure 11 shows an example of the microstructure observed in specimens crept to a strain after the onset of the minimum creep rate. In this case after 2.6% creep strain we see two adjacent grains that are subdivided by the twin interfaces an also containing a high dislocation
density. The latter had a Burgers vector 1y2 [110] and
corresponds to the large majority of the total density, with the second system 1y2 [1¯10], invisible with this diffraction condition, being a minority number. Since the tensile axis of the large grain is [112], the slip system 1y2 [110] (001) has a Schmid factor m 0.47 while the secondary system cannot glide on plane (001) since the Schmid factor is zero. Thus, at this stage when the minimum creep rate has been reached, the deformation process is characterized by the propagation of single dislocations across the g matrix between twin interfaces (the twin interfaces being new sites where dislocations accumulate) at the same time as the passage of Schockley partials continues to increase the thickness of the existing twinned layers.
Similar TEM observations made from specimens deformed under constant strain rate conditions con-firmed that the same dislocation and mechanical twin-ning mechanisms were active within the g grains. Those in which twinning was not active deformed only by single 1y2 k110l dislocations whose long screw segments were pinned along their length. Also, the emission of 1y2 k110l edge segments was observed from twin inter-faces and grain boundaries. An example of such mech-anism is shown in Fig. 12 from a specimen deformed
to 2% at a constant strain rate of 4 3 1026 s21. The
tensile axis of the grain shown is [112] and all the visible dislocations have Burgers vector 1y2 [110] since they are
FIG. 8. Deformed microstructure observed after 1.5% creep strain under 340 MPa from a grain with a tensile axis close to [110]. Note in ( b) a detail taken from (a) where the 1y2 [1¯10] dislocation segments are pinned along their screw orientation and bow out under the action of the local stress.
all invisible with both g 002 and g 1¯11. Therefore, all the deformation in this grain is produced by a primary slip system. The bowed dislocation segments that are emitted from the grain boundary (see in the lower part of
Fig. 12) have pure edge orientation and define the (001) glide plane. For this grain orientation, the Schmid factor of the active slip system 1y2 [110] (001) is m 0.47 while it is zero for a secondary system 1y2 [1¯10] (001).
FIG. 9. Deformed microstructure observed after 1.5% creep strain under 340 MPa from a grain with a tensile axis [121] (see text for details).
Although the TEM observations allow correct iden-tification of active deformation mechanisms, the number of deformed g grains that can be examined is limited. To quantify the total number of grains that deform by mechanical twinning we have examined in the SEM complete deformed sections cut from the gauge length of the specimens perpendicular to the tensile axis. Be-fore examining these disks they were electropolished such that the observation of twins was possible from crystallographic contrast (using backscattered electrons) due to the fact that the thin twinned regions are rotated
by 180± with respect to the matrix. Therefore, a thin
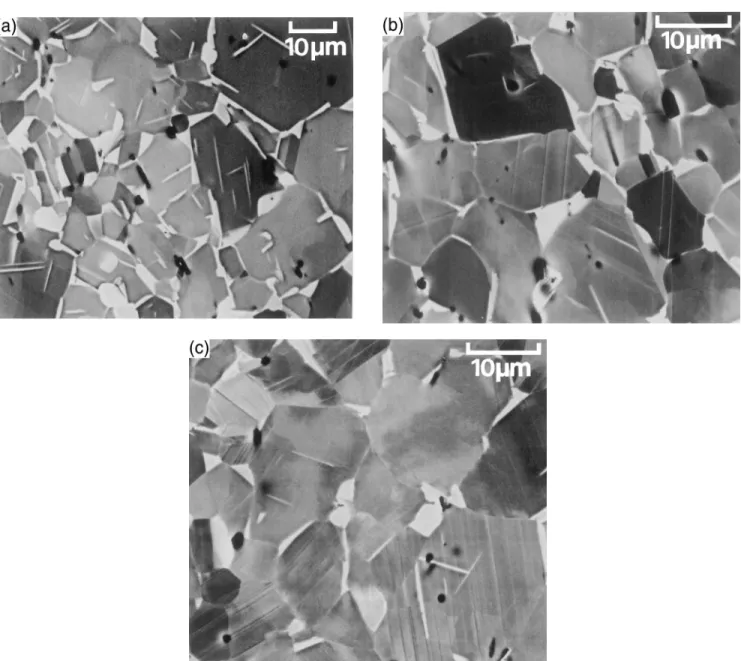
slab of twinned region appears as a line due to its different crystallographic contrast. Figures 13 –15 show examples comparing grains taken from sections of the undeformed specimens (head of tensile sample) and after creep or tensile deformation to different strains. The major difference between the grains of undeformed and deformed samples is the total absence of mechanical twins in the former while in the latter the appearance of mechanical twins is similar to that observed by TEM under the same creep conditions. From these SEM observations a large number of images was accumulated, the total number of twinned grains counted, and the average spacing between twins measured as a function of strain for different conditions of applied stress (at least 300 grains were counted in each case). Figure 16 shows
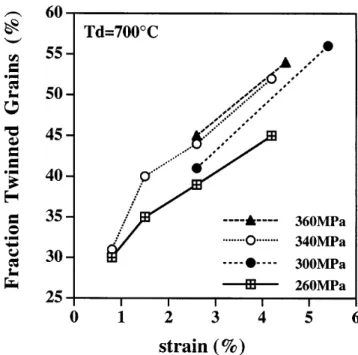
the fraction of twinned grains as a function of strain measured from the crept specimens, and in Table II we see those measured from the specimens tested in tension under a constant strain rate of 4 3 1026 s21.
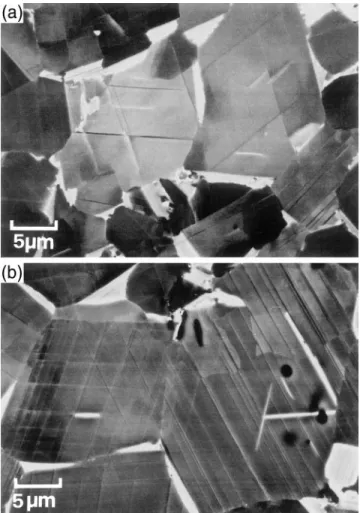
From these values we note that the number of grains that deform by mechanical twinning increases with in-creasing strain both under creep conditions (constant applied stress) and under constant strain rate tests. Under creep conditions, for a given amount of strain the applied stress seems to have little effect on the number of grains that deform by mechanical twinning, it affects, however, the twinning intensity (total number of twins as well as the thickness of the twinned layer) activated within each grain. This is confirmed by comparing the images in Fig. 14 illustrating twinned grains observed after 2.6% strain under two different stresses of 260 [14(a)] and 340 MPa [14(b)]. The average spacings between twins measured were 5 –8 mm and 2–3 mm from the low and high stress, respectively. Similarly, as seen in Fig. 15, in the specimens deformed under constant strain rate conditions not only the total number or twinned grains increases with increasing strain but also the twinning intensity within each grain increases substantially. On the other hand, the fraction of twinned grains reaches a saturation value of about 50% at 6% strain which corresponds to the maximum tensile ductility measured under constant strain rate conditions.
IV. DISCUSSION
The behavior of the alloy under creep will be dis-cussed from the microstructural point of view, taking into account the two stages observed in the creep curves. During the primary stage we measure very high instan-taneous strain rates on loading which decrease very fast during the first 1% strain to reach minimum values at about 1.5 –2%. Parallel constant strain rate tests have confirmed that work hardening is very pronounced at the onset of plastic flow, decreasing rapidly to about one third of the initial value after 1.5% strain (see Fig. 3). During this period the twinning activity is very pronounced as well as primary slip by 1y2 k110l dislocations. Since only about 40% of the grains deform by mechanical twinning at the onset of the minimum creep rate, hardening (responsible for the fast decrease of strain rate) is produced by twins in some grains but must
TABLE II. Volume fraction of twinned grains measured from speci-mens deformed at constant strain rate 4 3 1026s21.
eplastic(%) Fv twinned grains (%)
1 34
3 45
(a) (b)
FIG. 10. (a, b) Detailed weak beam images of mechanical twins taken under two different orientations from a deformed grain with tensile axis [110] (s 340 MPa, e 1.5%).
be produced by interactions of 1y2 k110l dislocations in the rest of the grains.
From the x-ray diffraction as well as from the TEM analysis, we have confirmed that there is no specific texture or preferred grain orientations in this alloy and that the observed twinning activity corresponds to those slip systems favored by the Schmid factors in most cases. In particular, we have noted that grains with tensile orientation [110] exhibit a high twin density of
the two systems with maximum Schmid factors (m
0.48) (as the example in Fig. 8). This is also the case for grains with [001] orientation. On the other hand, grains with tensile axis [121] for which only one twinning
system has the maximum Schmid factor m 0.47 are
subdivided by one major twinning system (see Fig. 9). In the case of grains with tensile axis [011] in which the
Schmid factor for twinning (m 0.28) is always lower
than that for 1y2 k110l (001) slip (m 0.36), the grains deform only by the latter (example of Fig. 7). This is also the case for grains with [112] orientation in which the Schmid factor for 1y2 [110] (001) slip (m 0.47) is higher than that for twinning (m 0.32) and the grain is deformed by the former. Thus, twinning is only favored for those twinning systems whose Schmid factors are higher than those to activate single dislocations. The presence of 1y2 k110l (001) dislocations in grains with a tensile axis near to [010] or [100] (as the example of Fig. 5 with an orientation about 15±from [010]) has been attributed to the local stresses at twin intersections from which emission of these segments has been
confirmed in this and other studies.17–19 In conclusion, the twinning activity observed from the early stages of the creep process is due to the macroscopic applied stress which favors mechanical twinning as a major slip system. Only in the specific grain orientations for which 1y2 k110l (001) slip has a larger Schmid factor than twinning does slip take over. This does not exclude the activation of twinning in that type of grain due to harden-ing at a later stage in the deformation process when local constraints across adjacent grains will determine local shear stresses responsible for the deformation process.
The contribution that twinning dislocations make to the total strain of the material has been estimated for the two extreme values of stress used, for which measurements of the twin spacings and of the twinned layer thickness have been made. From the microstruc-ture obtained after 1.5% strain at 360 MPa, the spacing
between twins in the matrix, dtwin, was measured as
about 2 mm, and the twinned layer thickness, ttwin as
80 nm. Assuming that all the twins traverse the grains
of diameter D 12 mm, and section area, S 1.13 3
10210 m2, the number of twins per grain is given by
Nt Dydtwin 6 and the twin density (number of
twins/area) is NtyS 5.3 3 1010 m22. Since twin
propagation occurs by glide of 1y6 k112l dislocations
on every adjacent h111j plane,20 the number of twin
dislocations can be obtained by dividing the twinned layer thickness by the interplanar spacing ofh111j planes (d111 0.2316 nm). Thus, for an average layer thickness of 80 nm we obtain value of about 345 dislocations per
FIG. 11. Deformed microstructure observed at the onset of minimum creep rate from a grain with tensile axis [112] (s 340 MPa, e 2.6%).
twin. Multiplying this number by the twin density we calculate a twinning dislocation density, rtwin 1.8 3 1013 m22. Since these dislocations traverse the entire
grains, the total shear strain produced by this twinning process is gtwin rtwinbD, where b is the Burgers vector
of the twinning dislocation ø 1.6 3 10210 m and D
the grain size. This yields a contribution to the total creep strain by twin activity gtwin 0.036. This value corresponds to a macroscopic strain etwin gtwiny3 0.012. Since the total fraction of grains that deform by mechanical twinning is only 40%, this corresponds to a total contribution to the creep strain etwin 0.0048 (ø0.5%), which is about 30% of the total strain of the specimens studied. Similar calculations made from the specimen crept at the lower stress of 260 MPa, where the matrix spacing between twins was measured as about
dtwin 6 mm and the twinned layer thickness, ttwin 40 nm, yield a total contribution of the twin activity to
the macroscopic strain, etwin 0.001 (ø0.1%), which
is only 7% of the total creep strain produced in the specimen. It is interesting to note that the contribution from twinning to the total creep strain increases with increasing applied stress.
Therefore, the importance of the twins is not so much that they are responsible for a significant amount of strain, but that they lead to a subdivision of the micro-structure during the primary stage of creep reducing the
mean free path of the 1y2 k110l dislocations as they
propagate between twins instead of propagating across the entire grain. As the dislocations are accumulated at twin interfaces, this leads to a decrease of strain rate. However, in those grains that do not deform by mechanical twinning the same decrease in strain rate needs to occur to ensure a homogeneous deformation of the specimen, and this can occur either by a decrease
FIG. 12. Example of deformed microstructure observed after tensile deformation at constant strain rate 4 3 1026s21, e 2%. Note the bowed segments being emitted from the boundary (marked by the arrows).
in the density of primary 1y2 k110l dislocations or by a decrease of their speed. In this way, the twinning activity determines (directly or indirectly) the hardening process observed during the primary stage of creep.
Thus, at the end of the primary stage the mini-mum creep rate is reached by the exhaustion of mobile 1y2 k110l dislocations, either because they accumulate at twin interfaces or grain boundaries or because their high density leads to a large number of pinning points and debris within the g matrix. Since we have observed that in a large number of grains the majority of dislocations correspond to a primary slip system only (see Figs. 8 and 12), the existence of large numbers of pinning points cannot be attributed to a forest cutting mechanism. Instead the pinning events seen along the screw segments are produced by intrinsic obstacles that exist in the g
FIG. 13. Examples of microstructures observed by crystallographic contrast in the SEM. Note the absence of mechanical twins in the undeformed sample (a) and the existence of twinned grains after creep conditions ( b) s 260 MPa, e 1.5% and (c) s 340 MPa, e 2.6%.
matrix and that hinder dislocation motion. This leads to intrinsic hardening as observed in the early stages of deformation during tensile tests performed under constant strain rate (see Fig. 3) or during the primary stage of creep. These conclusions are confirmed by the strain-independent values of activation volumes meas-ured during the strain rate jump tests and also by TEM observations that show that the number of cusps seen
along the 1y2 k110l segments does not change
signifi-cantly with strain. A strain-rate controlling mechanism that is independent of strain eliminates forest cutting as a possible mechanism since the latter would imply a decreasing value of activation volume with increasing dislocation density and, thus, with increasing strain.21
Instead, two mechanisms can be proposed as controlling deformation: lattice friction or solute pinning. When lat-tice friction controls the dislocation mobility, we expect smaller values of the activation volumes (i.e., 10 – 50b3). However, the higher values obtained in our study might represent a deformation process controlled by solute atoms (or fine particles) pinning the dislocations at certain intervals, L dependent on solute concentration,
c, L bc21/2. Then the activation volumes would be
determined by the solute concentration as V c21/2 b3.
The activation volume measured experimentally (330b3)
would correspond to very small solute concentrations (of the order of 10 ppm) which does not fit with Nb or Cr being the solute atoms responsible for the pinning effect.
FIG. 14. Comparison of the different twinning intensity (twin thickness and separation between twinned layers) observed after 2.6% creep strain under two different stresses: (a) 260 MPa and ( b) 340 MPa.
Other impurities (such as oxygen, boron, or even carbon) could produce this effect.
During the secondary stage of creep (i.e., between 2 and 3% strain) the strain rate remains rather constant near its lower value. During this stage our observations confirm that the deformation process is characterized by dislocation motion across twin interfaces or across entire g grains (depending on whether the grains have been subdivided by mechanical twinning or not). In order to analyze the thermally activated mechanism that controls the constant strain rate we have examined the details of dislocation configurations to determine whether the observed motion of 1y2 k110l dislocations on (001) planes involved climb processes. Figure 17 shows
a detailed example of 1y2 k110l dislocation segments
and loops together with a schematic diagram which shows the glide and climb planes that could possibly
be involved. The 1y2 [110] segments and loops shown
are characterized by the two major line directions [110] (screw orientation) and [1¯10] (pure edge) and lie on the
(001) plane. If climb processes were involved this should take place on the (110) plane shown, perpendicular to the Burgers vector, and this would mean that there should be a pure edge segment trailing behind. Instead we observe that the loops are on (001) planes and that the trailing segments left behind have screw orientation. This confirms that the 1y2 k110l dislocations observed in our alloy propagate on (001) planes by glide only and climbing processes are not involved.
From the values of minimum creep rates we have evaluated the stress exponent, n, characterizing the de-pendence on applied stress given by the general power
law equation: Ùe sn exp 2sQyRTd. Figure 18 shows
the plot ln Ùe versus ln s from which the stress
expo-nent was obtained as the slope of the line. The values
obtained, n 8, is typical of this type of alloy11,14
and indicates that the secondary stage of creep
can-not be described by simple recovery processes.22 When
such high stress exponents are obtained, it is possible to rationalize the creep behavior assuming the exis-tence of an athermal threshold stress, s0, and express
the strain rate as: Ùe A (s 2 s0)n
0
exps2QyRTd.
This threshold stress represents a friction stress or a stress concentration that needs to be overcome to initiate dislocation mobility in the g matrix. As a consequence the thermally activated glide of dislocations takes place under the action of the effective stress represented by the term s 2 s0. To obtain the value of the threshold stress,
the stress exponent n0 used should be that normally
obtained for creep of the matrix in the absence of other obstacles. Generally, in pure metals this value ranges
between n0 3 and 5 and in the case of single phase
TiAl alloys deformed at low stresses the value obtained is n0 4.6Using this value we have plotted in Fig. 19 the applied stress, s, versus Ùe1/4 and from the intercept of
the line obtained we have measured the threshold stress
as s0 167 MPa. On the other hand, the threshold
stress varies with the value n0 such that for n0 3
we obtain s0 130 MPa and for n0 5 we have
s0 202 MPa. Under such conditions it is difficult to
justify the threshold stress concept, and for this reason, when high stress exponents are observed and thermally activated glide of dislocations has been confirmed, it is more appropriate to interpret the creep data using an equation in which the creep rate is expressed as23:
Ùe Ùe0exp 2
µ
Q0 2 V tloc
RT ∂
,
where Ùe0represents a temperature independent parameter
that will depend on the microstructure. The term inside the exponential corresponds to an apparent activation
energy, Q Q0 2 V tloc which can be considered as
the sum of two terms: the thermal energy itself, Q0, and
a mechanically produced energy, V tloc. The term V is
FIG. 15. Increased twinning intensity with increasing strain observed after tensile deformation at constant strain rate 4 3 1026 s21. (a) e 1% and (b) e 3%.
product V Ab, of the activation area A over which the
activated event occurs and the Burgers vector. The value tloc is the local shear stress acting on the dislocation
segment helping the thermally activated event to occur. In our alloy we have measured a high value of
activation energy, Q 430 kJymol, much higher than
that for self-diffusion (Qself-difø 300 kJymol), indicating that the value measured represents an apparent activation energy. Introducing this value in the above equation as well as that of our experimentally measured activation volume, V , we have been able to calculate the value of the local shear stress, tloc, acting on the thermally
activated dislocation segment. Two possible cases need to be considered, one in which a self-diffusion process is taking place (i.e., Q0 ø 300 kJymol) that results in
a value of the local shear stress tloc 30 MPa. The
second case assumes a thermally activated mechanism controlled by a process such as pipe diffusion or
cross-slip (i.e., Q0 ø 150kJymol) and leads to a local shear
stress tloc 62 MPa. This latter value represents the
shear stress necessary to bow out a dislocation segments
FIG. 16. Plot of the fraction of grains deformed by mechanical twinning as a function of strain measured from the specimens crept under different applied stresses.
of size L 250–300 nm (t mbyL) and is consistent
with the link length of 1y2 k110l segments typically
seen between pinning points in our micrographs [see Fig. 8( b)]. Thus we would like to suggest that this local stress represents the athermal stress necessary to bow out a dislocation segment and unpin it over a given length to initiate its movement in the g matrix. According to the analysis made here, we suggest that the activation energy required to allow thermally activated glide of dislocations is that corresponding to pipe diffusion along the dislocation core or cross-slip, which must be required for segments to break away from their pinning points.
V. CONCLUSIONS
The creep behavior of a g-based TiAl alloy with equiaxed microstructure and fine grain size has been analyzed using detailed observations of the deformation process as a function of strain and applied stress.
One important feature of the creep process is the extensive twinning activity observed from the early stages of deformation. Although the total fraction of grains that twin increases with increasing strain it tends to saturate at about 50%. Also, for a given amount of strain the applied stress seems to have little effect on the number of grains that deform by mechanical twinning, but affects, however, the twinning intensity activated within each grain.
However, the importance of the twins is not their contribution to the total amount of strain, but that they
lead to a subdivision of the microstructure during the primary stage of creep reducing the mean free path of the 1y2 k110l dislocations and leading to a decrease in strain rate. In those grains that do not twin, the decrease in strain rate occurs either by a decrease in the density
of primary 1y2 k110l dislocations or by a decrease of
their speed. In this way, the twinning activity determines (directly or indirectly) the hardening process observed during the primary stage of creep.
We suggest that the mechanism controlling the creep rate during the secondary stage of creep is the thermally activated glide of 1y2 k110l dislocations which becomes possible as the screw segments can bow out between pinning points under the action of a local athermal stress with the help of processes such as the pipe diffusion energy along the dislocation core or cross-slip.
FIG. 17. (a) Detailed example of typical 1y2 [110] dislocation segments showing analyzed line directions [1¯10] and [110], and ( b) schematic diagram confirming that a climb process is not possible since the trailing segments has screw orientation (s 260 MPa, e 0.8%).
ACKNOWLEDGMENTS
We would like to thank Professor D. G. Morris for reading this manuscript and for the many useful discussions. F. Maccabiani is also acknowledged for carrying out some of the tensile and creep tests. The
FIG. 18. Plot lnÙe versus ln s from which the stress exponent n 8 has been obtained.
FIG. 19. Plot of the applied stress, s, versus Ùe1/4 from which the threshold stress s0 has been measured.
OFES is also acknowledged for financing this study under the project COST 513.
REFERENCES
1. Y. W. Kim and F. H. Froes, High Temperature Aluminides and Intermetallics, edited by S. H. Whang, C. T. Liu, D. P. Pope, and J. U. Stiegler (TMS, Warrendale, PA, 1990), p. 465.
2. M. P. Brady, W. J. Brindley, J. L. Smialek, and I. Locci, JOM 48, 46 (1996).
3. T. Takahashi, H. Nagai, and H. Oikawa, Mat. Trans. JIM 30, 1044 (1989).
4. R. W. Hayes and B. London, Acta Metall. Mater. 40, 2167 (1992). 5. M. Es-Souni, A. Bartels, and R. Wagner, Acta Metall. Mater. 43,
153 (1995).
6. J. Beddoes, W. Wallace, and L. Zhao, Int. Mat. Rev. 40, 197 (1995).
7. S. Mitao, S. Tsuyama, and K. Minakawa, Mater. Sci. Eng. A 41, 51 (1991).
8. M. F. Bartholomeusz, Q. Yang, and J A. Wert, Scripta Metall. 29, 389 (1993).
9. R. W. Hayes and P. A. McQuay, Scripta Metall. Mater. 30, 259 (1994).
10. B. D. Worth, J. W. Jones, and J. E. Allison, Metall. Mater. Trans. A 26, 2947 (1995).
11. D. A. Wheeler, B. London, and D. E. Larsen, Jr., Scripta Metall. Mater. 26, 934 (1995).
12. R. W. Hayes and P. L. Martin, Acta Metall. Mater. 40, 2761 (1995).
13. J. N. Wang, A. J. Schwartz, T. G. Nieh, C. T. Liu, V. K. Sikka, and D. Clemens, in Gamma Titanium Alumindes, edited by Y-W. Kim, R. Wagner, and M. Yamaguchi (TMS, Warrendale, PA, 1995), p. 949.
14. J. Beddoes, L. Zhao, J. Triantafillou, P. Au, and W. Wallace, in Gamma Titanium Aluminides, edited by Y-W. Kim, R. Wagner, and M. Yamaguchi (TMS, Warrendale, PA, 1995), p. 959. 15. H. Oikawa, High Temperature Aluminides and Intermetallics,
edited by S. H. Whang, C. T. Liu, D. P. Pope, and J. U. Stiegler (TMS, Warrendale, PA, 1990), p. 353.
16. Z. Jin, S-W. Cheong, and T. Bieler, in Gamma Titanium Alumin-des, edited by Y-W. Kim, R. Wagner, and M. Yamaguchi (TMS, Warrendale, PA, 1995), p. 975.
17. M. A. Morris, Intermetallics 5, 339 (1997). 18. M. A. Morris, Philos. Mag. A 68, 237 (1993).
19. J. Luster and M. A. Morris, Metall. Mater. Trans. 26A, 1745 (1995).
20. Z. Jin and T. R. Bieler, Philos. Mag. A 71, 925 (1995). 21. P. Groh, Dislocations et D´eformation Plastique, edited by P. Groh,
L. P. Kubin, and J. L. Martin (Diffusion les Editions de Physique, Societ´e Franc¸ aise de Physique, 1979), p. 67.
22. T. G. Langdon, in Dislocation and Properties of Real Materials (The Institute of Metals, London, 1985), p. 221.
23. J. P. Poirier, Plasticit´e `a Haute Temperature des Solides Cristallins (Editions Eyroles, Paris, 1976).
![FIG. 7. Typical example of a grain with a tensile axis [001] and deformed by 1 y 2 k 110 l slip (see text for details)](https://thumb-eu.123doks.com/thumbv2/123doknet/14907145.656653/6.918.82.442.111.1056/fig-typical-example-grain-tensile-axis-deformed-details.webp)
![FIG. 8. Deformed microstructure observed after 1.5% creep strain under 340 MPa from a grain with a tensile axis close to [110]](https://thumb-eu.123doks.com/thumbv2/123doknet/14907145.656653/7.918.468.829.115.587/deformed-microstructure-observed-creep-strain-grain-tensile-close.webp)
![FIG. 9. Deformed microstructure observed after 1.5% creep strain under 340 MPa from a grain with a tensile axis [121] (see text for details).](https://thumb-eu.123doks.com/thumbv2/123doknet/14907145.656653/8.918.81.444.112.541/deformed-microstructure-observed-creep-strain-grain-tensile-details.webp)
![FIG. 11. Deformed microstructure observed at the onset of minimum creep rate from a grain with tensile axis [112] (s 340 MPa, e 2.6%).](https://thumb-eu.123doks.com/thumbv2/123doknet/14907145.656653/10.918.470.825.114.704/deformed-microstructure-observed-onset-minimum-creep-grain-tensile.webp)