FIELD CALIBRATION STUDIES FOR IONISATION CHAMBERS
IN MIXED HIGH-ENERGY RADIATION FIELDS
C. Theis1,*, D. Forkel-Wirth1, M. Fuerstner1, S. Mayer2, Th. Otto1, S. Roesler1and H. Vincke1 1
CERN, CH-1211 Geneva 23, Switzerland 2
PSI, CH-5232 Villigen, Switzerland
The monitoring of ambient doses at work places around high-energy accelerators is a challenging task due the complexity of the mixed stray radiation fields encountered. At CERN, mainly Centronics IG5 high-pressure ionisation chambers are used to monitor radiation exposure in mixed fields. The monitors are calibrated in the operational quantity ambient dose equivalent H*(10) using standard, source-generated photon- and neutron fields. However, the relationship between ionisation chamber reading and ambient dose equivalent in a mixed high-energy radiation field can only be assessed if the spectral response to every component and the field composition is known. Therefore, comprehensive studies were performed at the CERN-EU high-energy reference field facility where the spectral fluence for each particle type has been assessed with Monte Carlo simu-lations. Moreover, studies have been performed in an accessible controlled radiation area in the vicinity of a beam loss point of CERN’s proton synchrotron. The comparison of measurements and calculations has shown reasonable agreement for most exposure conditions. The results indicate that conventionally calibrated ionisation chambers can give satisfactory response in terms of ambient dose equivalent in stray radiation fields at high-energy accelerators in many cases. These studies are one step towards establishing a method of ‘field calibration’ of radiation protection instruments in which Monte Carlo simulations will be used to establish a correct correlation between the response of specific detectors to a given high-energy radiation field.
INTRODUCTION
Operating high-energy accelerators requires careful monitoring of the radiation environment. Due to the fact that the radiation environment encountered at such accelerators is quite different from the standard uses of such systems it is necessary to perform a thorough investigation of the envisaged devices. Radiation fields around high-energy accelerators like the Large Hadron Collider (LHC) show a compo-sition of many different particle types (neutrons, charged hadrons, leptons and photons) and a wide range of energies from fractions of eV up to several GeV. Consequently, it is necessary to use detectors that respond to various particle types at the same time and exhibit the required sensitivity. At CERN, mainly Centronics IG5 high-pressure ionisation chambers are used to monitor radiation exposure in mixed fields around accelerators. The monitors are calibrated in the operational quantity ambient dose equivalent H*(10) using standard, source-generated photon- and neutron fields. However, these sources cover only photons in the energy range of 1 MeV (137Cs,60Co) and neutrons (238Pu – Be) ranging up to 11 MeV, which is much lower than the energies encountered around high-energy accelerators. Therefore, the relationship between detector reading and ambient dose equivalent in a mixed high-energy radiation field can only be assessed if the spectral response of the monitor to every field component is
known. Since the radiation environment around the LHC is not yet available for measurements, studies at existing facilities like the CERN-EU high-energy reference field facility (CERF) or the proton syn-chrotron (PS) were performed. During these exper-iments a set of two hydrogen-filled IG5 chambers were used to measure ambient dose equivalent in mixed fields. Accompanying FLUKA Monte Carlo simulations(1,2) were performed to determine the spectral fluence and the corresponding dose at the exposure locations.
STUDIES AT THE CERF FACILITY
In 1992, the CERF facility was installed in the H6 secondary beam-line of the super PS (SPS) at CERN. A beam with a momentum of 120 GeV/c and a composition of 61% pions, 35% protons and 4% kaons originating from a primary target, was directed at a secondary copper target. This cylindri-cal target with a diameter of 7 cm and a length of 50 cm can be installed inside a cave under concrete or iron shielding. The beam intensity is measured by a precision ionisation chamber (PIC) and given in PIC counts which are proportional to the number of particles impinging on the secondary copper target (22116 + 92 particles per PIC count(3)). Outside the 80 cm thick concrete shielding a mixed radiation field is provided which is sufficiently similar to the one that is to be expected at the LHC. Details about the facility and the reference positions can be found in ref.(4). During the measurements a set of hydro-gen-filled IG5 ionisation chambers was placed at
*Corresponding author: christian.theis@cern.ch
Radiation Protection Dosimetry (2007), Vol. 126, No. 1 – 4, pp. 299–305 doi:10.1093/rpd/ncm062 Advance Access publication 22 May 2007
different exposure locations (see Table 1) outside of the concrete shielding and measurements were con-ducted for beam intensities of 500, 1000, 2000 and 4000 PIC counts.
During the experiment the created charge in the active volume of the ionisation chambers was recorded as a function of the beam intensity and the exposure location. This quantity is converted into counts by a charge digitizer and after the application of the neutron calibration factor (see Table 2), which was previously determined with a238Pu – Be source, one obtains the corresponding ambient dose equivalent.
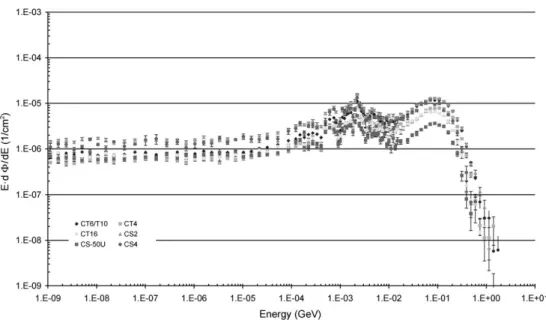
During the standard calibration procedure at CERN also a photon calibration factor is deter-mined. But as can be seen from the calculated par-ticle fluence spectra for the CT6/10 position in Figure 1, the dominant field component are neu-trons. Consequently, the application of the neutron calibration factor is assumed to be justified. In pre-vious studies(5) particle fluence spectra were calcu-lated for the respective reference locations using FLUKA. Additionally, energy dependent response functions of the detector were obtained for various particles by FLUKA calculations of the energy deposition within the active volume, and subsequent conversion into charge by the application of the energy required to produce an electron/ion pair (W-factor). Convoluting the particle spectra given at various locations with the response functions yields the total created charge in the active detector volume. Comparing these values to the experimentally obtained detector counts, which correspond directly
to the created charge within the active volume, showed good agreement within 15% (see reference (5)).
The next step was the application of the source-based calibration factor (see Table 2) to the detector readings to calculate ambient dose equivalent. In order to calculate a radiation field dependent cali-bration factor, a convolution of the calculated par-ticle fluence spectra at the various positions with the corresponding fluence-to-ambient-dose-equivalent conversion factors had to be performed. All results were normalised to a beam intensity of 1000 PIC counts. Table 3 shows the results for the different exposure locations that were obtained from the simu-lations as well as the average results of the measure-ments expressed in terms of ambient dose equivalent using the source-based calibration factor. In addition, the respective ratio of the simulation to the measured values are given for the ambient dose equivalent rates, as well as the unbiased, charge-based comparisons of previous studies(5).
As can be seen from Table 3, the comparison of the simulation and the experiment in terms of ambient dose equivalent shows reasonably good agreement for the top locations. For the side pos-itions of the concrete shielding the simulations give higher results than their measured values. The most significant deviation is visible for the position CS-50U, but this is a geometric effect in the simu-lations and was explained in detail in ref. (5). The positions CS2 and CT6/T10 should show compar-able results because the distance from the ionisation chamber to the target and the amount of shielding in between, was chosen to be identical. However, the simulations as well as the charge measurements (last column in Table 3) showed higher values for the CS2 position. Closer investigation yielded that in com-parison to the top locations the calculated particle fluence spectra at the side positions show a signifi-cantly higher contribution of low-energetic neutrons (see Figure 2), which can be attributed to back-scattered particles due to an additional shielding wall. The charge-based comparisons take this effect into account correctly and consequently good agree-ment was observed in the comparison of simulation and measurements. However, this was not the case for the ambient-dose-equivalent-based comparisons as can be seen from the respective ratios in Table 3. MEASUREMENTS AT THE CERN PS
The PS is the oldest of the accelerators in operation at CERN. Protons are injected at a momentum of 1.4 GeV/c into the PS, where they are accelerated to momenta between 14 GeV/c and 26 GeV/c. The PS has a radius of 100 m. It is installed in a ring-shaped accelerator building, slightly under normal ground level and covered with the excavated soil to form a shielding hill. The shielding of the PS has been
Table 1. Exposure locations used for the IG5 chambers at CERF. The abbreviations, as given in the first column, will
be used throughout this paper.
Abbreviation Description
CS2 Concrete side position 2 CS4 Concrete side position 4
CS-50U Concrete side position, 50 cm upstream of the target’s front face
CT4 Concrete top position 4
CT6/T10 Boundary of concrete top position 6 and 10
CT16 Concrete top position 16
Table 2. Neutron calibration factors including absolute errors for hydrogen-filled IG5 ionisation chambers, which
were determined with a standard238Pu – Be source.
Detector ID Calibration factor [nSv/count]
H20-1 7.20 + 0.51 H20-2 6.95 + 0.50
designed 50 years ago for a beam intensity which has since been exceeded by approximately a factor of 100. In addition, legal dose limits for personnel and for the public have been lowered, and together with them guideline values for assessing the environ-mental impact of sources of ionising radiation. The weakest part of the shielding is the so-called ‘PS Bridge’, 30 m long concrete structure covering the accelerator at the location where it traverses two former experimental halls. The concrete thickness of
the roof over the accelerator measures only between 1.80 and 3.40 m.
For the measurements, two IG5 ionisation chambers were used on the PS Bridge, one filled with hydrogen, and one with argon(6). Table 4 shows the results of the measurement.
In contrast to the situation at CERF, in the PS the exact location of the beam loss and its intensity are unknown. The loss is approximately situated at the location of maximum activation of the PS vacuum chamber, measured after stop of the accelerator. A loss of protons at an energy Ekin¼ 13.1 GeV ( p ¼ 14 GeV/c) in the centre of a PS magnet unit has been modelled within FLUKA(1,2). As for CERF, particle fluence spectra of neutrons, photons, protons and pions were scored on top of the PS Bridge at the location of the ionisation chambers. Ambient dose equivalent calculated from fluence spectra and conversion factors(7) yields a result of H*(10) ¼ (2.22 + 0.03) mSv/1012 protons on the PS Bridge. Additional details of the simu-lation can be found in ref. (8). The monitor indi-cations are calculated from the response functions from ref. (5). Since information about the intensity of the beam loss is not available, the ratio of the different monitor indications is compared with the measurement. Table 5 shows the calculated values and their ratios.
The observed and calculated ratios of monitor indications from stray radiation at the PS Bridge coincide within their uncertainties, proving that the
Figure 1. Calculated particle fluence spectra per primary particle at the position CT6/T10 for various particles (lethargy representation)(5).
Table 3. Ambient dose equivalent for different reference locations at the CERF facility normalised to a beam intensity of 1000 PIC counts. Additionally, the ratios for the calculated versus the measured ambient dose equivalent rates are given, as well as the ratios of the calculated versus the
measured charge(5). Location FLUKA H*(10) [mSv/h/ 1000 PIC] (%) IG5 H*(10) [mSv/h/ 1000 PIC] (%) Ratio H*(10) sim/exp (%) Ratio charge sim/exp (%) CS2 121.55 + 13 95.33 + 1 1.28 + 13 1.11 + 14 CS4 89.68 + 12 72.93 + 4 1.23 + 12 1.23 + 16 CS-50U 34.54 + 22 25.96 + 13 1.33 + 26 1.38 + 21 CT4 56.14 + 9 48.08 + 5 1.17 + 10 1.14 + 15 CT6/T10 94.10 + 10 94.25 + 7 1.00 + 10 1.10 + 13 CT16 54.08 + 10 53.25 + 1 1.02 + 10 0.96 + 15
assumptions on beam loss and the simulations are based on a sufficiently accurate description of the real situation. This allows for comparing the direct Monte Carlo estimation of H*(10) and the calcu-lated charge response of the monitor, converted into a dose equivalent reading with a measured
calibration factor (Table 6). A hydrogen-filled IG5 ionisation chamber, calibrated with a 238Pu – Be neutron source, indicates ambient dose equivalent in the composite stray radiation field at the PS Bridge with a deviation of only a few percent. The smaller response of the ionisation chamber for neutrons at
Figure 2. Neutron fluence spectra per primary particle for the different CERF exposure locations that were obtained from FLUKA simulations (lethargy representation).
Table 4. Observed monitor indications on the PS Bridge.
Protons extracted (h21)
Monitor indication IG5-H20
Monitor indication IG5-A20
Ratio of Monitor indications (charge) IG5-H20/IG5-A20
6.9 1015 78.2 + 5.1 mSv h21 13.1 + 0.1 mSv h21 0.17 + 0.02 6.9 1015 11.3 + 1.0 pC h21 66.2 + 0.5 pC h21 0.17 + 0.02
Note: The charge response of the ionisation cambers is calculated from the monitor calibration factor obtained from the
238
Pu – Be source. In the last columns, the monitor indication and the generated charge are compared between the two monitors.
Table 5. Calculated charge generated in monitors.
Calculated charge IG5-H20 Calculated charge IG5-A20 Ratio of calculated charges IG5-H20/IG5-A20
297 + 12.5 pC/(1012p) 1530 + 65 pC/(1012p) 0.19 + 0.01 2.05 + 0.08 mSv/(1012p) 0.31 + 0.01 mSv/(1012p) 0.19 + 0.01
Note: The charge generated in the monitors is estimated from calculated response functions and fluence spectra. The collected charge is converted into a dose equivalent indication with the measured calibration factor of the monitor. In the last column, the generated charge is compared between the two monitors.
an energy of about 100 MeV (Figure 4) is compen-sated by the response of the chamber to other par-ticles, mainly photons and protons.
COMPARISON WITH SOURCE CALIBRATION OF THE DETECTOR
Figure 3 illustrates the neutron ambient dose equiv-alent spectrum obtained for the 238Pu – Be source at CERN(9) and the CT6/T10 position at CERF. As can be seen from Figure 3 the major contribution to the ambient dose equivalent at CT6/T10 is coming from high-energetic neutrons above 10 MeV. Therefore, it is striking that in general the appli-cation of the source-based calibration factor, which does not cover the energies encountered in the radi-ation field of CERF, still yields reasonably good agreement.
Finally, a calibration factor of the IG5 detector with respect to the 238Pu – Be source was calculated
by the convolution of the neutron fluence spectrum with the respective calculated response function expressed in terms of ambient dose equivalent(5). The same procedure was performed for different exposure locations at the CERF facility using the respective mixed particle spectra and response func-tions. Comparing the 238Pu – Be source calibration factors with the calculated field calibration factor for CERF shows good agreement despite differing source spectra (Table 7).
Taking the neutron response of the detector into account one would expect an underestimation as it shows a lower sensitivity to neutrons above 10 MeV than to those below this threshold (see response function in Figure 4). However, in total this is mainly compensated by the contribution of other particles (mainly protons and photons) and thus, fairly good agreement is achieved for this specific field composition. However, one should keep in mind that such a source-based factor is not generally
Table 6. Comparison of the ‘direct’ Monte-Carlo calculation of ambient dose equivalent and the calculated monitor indication, using the measured calibration coefficient of the IG5-H20 ionisation chamber. The calibration coefficient is suitable for the radiation field at the PS Bridge and the CERN boundary although it has been determined in a different
radiation field.
Location Calculated ambient dose equivalent HMC*(10) Calculated monitor indication HMon*(10) Ratio MC/ Monitor PS Bridge (2.22 + 0.03) mSv/(1012p) (2.05 + 0.08) mSv/(1012p) 1.08 + 0.04
Figure 3. Neutron ambient dose equivalent spectrum for the238Pu – Be source measured at CERN (including scattered
neutrons which contribute about 30% at the position of calibration) and for the mixed CERF field at the exposure location CT6/T10.
applicable to every mixed high-energy radiation field, as there is a strong dependence on the fluence spectrum as well as the field composition.
SUMMARY AND CONCLUSIONS
Several measurement campaigns were performed at the CERF facility to test the behaviour of hydrogen-filled IG5 ionisation chambers in a mixed high-energy radiation field. Accompanying FLUKA simulations were performed to obtain the spectral particle fluence, as well as the ambient dose equival-ent rates for various exposure locations. Subsequently, the detector readings were converted into dose equivalent values by the application of a 238
Pu – Be source-based calibration factor. Even though the neutron energy range covered by the
calibration source does not fully account for the different particle types and the energy range observed at the CERF facility, the results showed reasonably good agreement with the simulations in terms of ambient dose equivalent. This can be explained by the fact that this limitation is recovered by the relatively high sensitivity of the detector in the energy range of the238Pu – Be source in compari-son to neutron energies above 10 MeV, and also because of the contribution of other particles in the mixed field. Still, it should be noted that from this agreement one cannot deduce that a source-based calibration factor is generally applicable to every mixed high-energy radiation field. However, it was shown that in radiation environments outside shielded areas, which exhibit the particle and energy composition comparable to the one encountered at the top locations of CERF, the application of the source-based calibration factor has been appropriate. Nevertheless, improvement can be achieved by calcu-lating field specific calibration functions based on Monte Carlo simulations. Presently, such studies and calculations are under way.
ACKNOWLEDGEMENTS
The authors would like to express their gratitude to Norbert Aguilar, Pierre Carbonez, Michel Pangallo, Daniel Perrin and Markus Rettig for their support in setting up the experiments.
Figure 4. Neutron response of IG5-H20 ionisation chamber (data points, left-hand scale) and fluence spectrum of neutrons on the PS Bridge (histogram, right-hand scale) and. Calibrated with 238Pu – Be, at a neutron energy of approximately 4 MeV, the chamber will underestimate dose equivalent from the high-energy peak in the spectrum. This is
partly compensated by the chamber response to other particles, mainly protons and photons.
Table 7. Measured and calculated neutron calibration factors for hydrogen-filled IG5 chambers in the field of the
238
Pu – Be source at CERN and calculated mixed field calibration factor for the CT6/T10 position at CERF.
Calibration factor [nSv/pC] 238Pu – Be – H20-1 7.20 + 0.51 238 Pu – Be – H20-2 6.95 + 0.50 238Pu – Be – FLUKA 6.97 + 0.34 CERF– FLUKA 6.98 + 0.36 C. THEIS ET AL.
REFERENCES
1. Fasso`, A., Ferrari, A., Ranft, J. and Sala, P. R. FLUKA: a multi-particle transport code. CERN Yellow Report (2005), INFN/TC_05/11, SLAC-R-773. 2. Fasso`, A., Ferrari, A., Roesler, S., Sala, P. R., Battistoni,
G., Cerutti, F., Gadioli, E., Garzelli, M. V., Ballarini, F. and Ottolenghi, A. et al. The physics models of FLUKA: status and recent developments. Computing in High Energy and Nuclear Physics 2003 Conference (CHEP2003), La Jolla, CA, USA, March 24 – 28, 2003 ( paper MOMT005) eConf C0303241 (2003), arXiv:hep-ph/0306267.
3. Vincke, H., Mayer, S., Efthymiopoulos, I., Fabich, A., Forkel-Wirth, D., Mu¨ller, M. J. and Theis, C. Accurate PIC calibration by the use of a coincidence of two scintillators. CERN Technical Note CERN-SC-2004-090-RP-TN (2004).
4. Mitaroff, A. and Silari, M. The CERN-EU high-energy Reference Field (CERF) facility for dosimetry at
commercial flight altitudes and in space. Radiat. Prot. Dosim. 102, 7 – 22 (2002).
5. Theis, C., Forkel-Wirth, D., Perrin, D., Roesler, S. and Vincke, H. Characterisation of ionisation chambers for a mixed radiation field and investigation of their suitability as radiation monitors for the LHC. Radiat. Prot. Dosim. 116, 170 – 174 (2005).
6. Mayer, S. Dose equivalent measurements in mixed andtime varying radiation fields around high-energy accel-erators. Doctoral thesis, CERN-THESIS-2003-012, (2003).
7. Pelliccioni, M. Overview of fluence-to-effective dose and fluence-to-ambient dose equivalent conversion coefficients for high energy radiation calculated using the FLUKA code. Radiat. Prot. Dosim. 88, 279 – 297 (2000). 8. Otto, Th. Beam Loss in the CERN PS and
Consequences for Radiation Protection. CERN-SC-2005-144-RP-TN (2006).
9. Naismith, O. F. and Siebert, B. R. L. Manual for SPKTBIB. NPL Report CIRA (EXT) 005 (1996). FIELD CALIBRATION STUDIES