Carcinogenesis vol.15 no.2 pp.359-363, 1994
No tumor-specific expression levels of protein kinase C isoenzymes
and of c-fos in human breast cancer cell cultures
R.Imber, F.Haberthiir, F.Meier, I.Filipuzzi and
A.C.Almendral
Laboratory for Molecular Tumorbiology, Departmetu of Research and Department of Gynecology and Obstetrics, University Hospital, Basel, Switzerland
Epithelial cells derived from 46 human breast tissue samples
of patients suffering from breast cancer have been cultivated.
Twenty-five of these cell cultures stemmed from normal and
21 from tumor tissues. Moderate to large variations of protein
levels of three protein kinase C (PKC) isoenzymes (a, 8 and
e) were found among the various cell cultures. The cell
cultures also exhibited very heterogeneous basal as well as
inducible levels of c-fos mRNA. However, none of these
variations could be correlated with the character of the
original tissue nor with any clinical parameter of the
respective patient. Our results suggest that altered levels of
PKC isoenzymes or of the protooncogene c-fos per se cannot
serve as an indication for a transformed behavior of the
epithelial cell fraction of human breast tissue.
Introduction
Breast carcinoma is the commonest type of cancer occurring in
women and is the main cause of death from cancer in Europe.
The relationship between growth of breast cancer and endocrine
regulatory mechanisms governed by steroids is well established
(1). Steroid hormones play an important role in growth regulation
of both normal human breast tissue and breast tumors (2).
Estrogen is known to induce mRNA expression and secretion
of polypeptide growth factors like TGFa, PDGF, and IGF-II (3).
Since many cells also possess receptors for GFs an autocrine
pathway is indicated.
Stimulation of growdi factor receptors by growth factors
activates protein kinase C (PKC*) via production of the second
messengers Ca
+ +and diacylglycerol (4). Members of the PKC
family are recognized as key enzymes in signal transduction, cell
differentiation and tumor promotion (5). PKC modulates the
synthesis of the epithelial growth factor receptor (EGF-R) as well
as its binding to EGF or TGFa (6). Therefore it has been
suggested that high levels of EGF-Rs displayed by the late stage
of breast cancer may be caused by the high levels of PKC
activities.
Altered levels of PKC activities or protein levels have been
reported also for ouier types of cancer. Decreased levels of PKC
activities have been found for human colon tumors compared to
normal mucosa (7). Elevated PKC activities have been described
in human gastric cancer (8), lung cancer cells (9) and in neoplastic
squamous epithelia cancer from the upper aero digestive tract
(10). The expression of PKCa is increased in glioblastoma cells
compared to the low levels of the isoenzyme in glia cells of
normal tissue (11). In contrast, PKCa as well as nPKCe are
•Abbreviations: PKC, protein kinase C; EGF-R, epidermal growth factor receptor; DMEM, Dulbecco's modified Eagle medium.
downregulated in neuroblastoma which in turn showed increased
expression of cPKQS (12). Distinct PKC isoforms have tiierefore
been suggested to be involved in the tumorigenesis of different
brain tumors (13).
The expression of me protooncogene c-fos has been implicated
in the control of both cell proliferation and differentiation (14,15).
Agents which stimulate cell cycle transitions and cell
prolifera-tion such as peptide growth factors, phorbol esters, cyclic
nucleotides and Ca ionophores all can activate expression of c-fos
(16,17). c-Fos binds together with c-Jun protein as a heterodimer
to AP-1 recognition sites mediating induction of the controlled
genes (18). AP-1 activity is positively modulated by phorbol
esters, cytokines and growth factors dial activate protein kinase
C by a variety of mechanisms inducing transcriptional activation
of the c-jun and c-fos genes and posttranscriptional modifications
of the protein products (19). We studied protein levels of six PKC
isoforms (a, /3, y, 8, e and f) using cultures of epithelial cell
fractions from individual breast carcinomas or from normal breast
tissue. Also basal c-fos mRNA levels as well as inducibility of
this message by the phorbol ester TPA in these cultures were
measured with respect to a possible correlation to the character
of the original tissue or to clinical parameters.
Materials and methods
Preparation and culturing of epithelial cells from human breast tissue
Preparation and culturing of human epithelial breast tissue was basically performed according to Stampfer et at (20-23). Tissues from human primary breast tumors and from normal human breast tissues derived from patients suffering from breast cancer were provided by the Institute of Pathology (J.Torhorst) and by the Department of Gynecology and Obstetrics of the University Hospital of Basel. Data about the patients and the respective tumor tissues are listed in Table I. The tissue samples (1 g) were cut, digested at 37°C for 12 - 1 5 h with coDagenase CLS m (10 000 U/ml, Flow Laboratories) and hyaluronidase Type m (10 000 U/mL Sigma, St Louis) and finally seeded for culturing into medium containing Dulbecco's modified Eagle medium (DMEM) and Ham's F12 (1:1). The medium was supplemented with 5% horse serum and various additions as described (23). Enrichment of the cultures in epithelial cells was achieved by repeated trypsinizations during which fibroblasts come off the plastic faster than epithelial cells. After 2 - 3 passages only the epithelial cell fractions remained and could be expanded to the cell volumes needed for the preparation of mRNA and protein fractions.
Immunoftuorescence staining
Cells were grown on glass slides using the medium described (23). The slides were washed with PBS, fixed with 3.7% of formaldehyde in PBS and stained with the anti-cytokeratin antibody (clone* AE1/AE3, Boehringer, Mannheim) for 45 min. After three washes with PBS an FTTC conjugated rabbit ami mouse antibody was added and incubated for another 45 min. The slides were then washed with water, dried and embedded.
Immunoblotting
Cytosol and membrane protein fractions were prepared, separated by PAGE, transferred to nitrocellulose and exposed to antibodies using the Western technique as described (24). The antibodies used were as follows: amicytokeratin antibody (AE1/AE3, Boehringer, Mannheim); monoclonal antibodies specific for a- (MC5, Amersham), /3- and 7-PKC (Seikagaku Kogyo, Tokyo); polydonal antibodies specific for 5-, e and f-PKC (25).
Northern analysis
Total mRNA was prepared following the procedure described by Chomczynski and Sacchi (26). Formaldehyde agarose gels, Wotting of RNA to Zeta Probe (Biorad) and hybridisations were as described (27). The 1.3 kb EcoVUHinSR
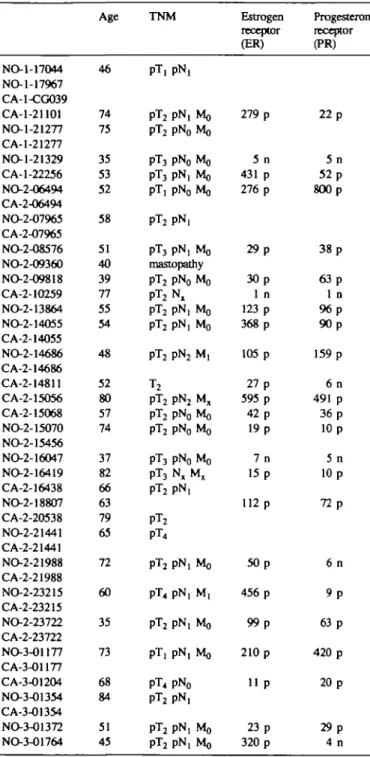
Table I. Clinical NO-1-17044 NO-1-17967 CA-1-CG039 CA-1-21101 NO-1-21277 CA-1-21277 NO-1-21329 CA-1-22256 NO-2-06494 CA-2-06494 NO-2-07965 CA-2-07965 NO-2-08576 NO-2-09360 NO-2-09818 CA-2-10259 NO-2-13864 NO-2-14055 CA-2-14055 NO-2-14686 CA-2-14686 CA-2-14811 CA-2-15056 CA-2-15068 NO-2-15070 NO-2-15456 NO-2-16047 NO-2-16419 CA-2-16438 NO-2-18807 CA-2-20538 NO-2-21441 CA-2-21441 NO-2-21988 CA-2-21988 NO-2-23215 CA-2-23215 NO-2-23722 CA-2-23722 NO-3-01177 CA-3-01177 CA-3-01204 NO-3-01354 CA-3-01354 NO-3-01372 NO-3-01764
data of patients and the respective tumors Age 46 74 75 35 53 52 58 51 40 39 77 55 54 48 52 80 57 74 37 82 66 63 79 65 72 60 35 73 68 84 51 45 TNM pT, pN, pT2 pN, Mo pT2 pN0 Mo pT3 pN0 Mo pT3 pN, Mo pT, pN0 MQ pT2 pN, pT3 pN, MQ mastopathy pT2 pN0 MQ p T2Nx pT2 pN, MQ pT2 pN, MQ pT2 pN2 M, T2 pT2 pN2 Mx pT2 pN0 Mo pT2 pN0 Mo pT3 pN0 MQ pT3 Nx Mx pT2 pN, PT2 PT4 pT2 pN, MQ pT4 pN, M, pT2 pN, Mo pT, pN, Mo pT4 pN0 pT2 pN, pT2 pN, Mo pT2 pN, Mo Estrogen receptor (ER) 279 p 5 n 431 p 276 p 2 9 p 3 0 p 1 n 123 p 368 p 105 p 27 p 595 p 42 p 19 p 7 n 15 p 112 p 5 0 p 456 p 9 9 p 210 p 11 p 23 p 320 p Progesterone receptor (PR) 22 p 5 n 52 p 800 p 38 p 6 3 p 1 n 9 6 p 9 0 p 159 p 6 n 491 p 36 p 10 p 5 n 10 p 7 2 p 6 n 9 p 63 p 420 p 20 p 2 9 p 4 n Normal (NO) and turaor (CA) tissue was taken from patients suffering from breast cancer (except 2-09360).
T, tumor size; N, nodal status; Mo, no metastases; M,, mettstases diagnosed. Index x, not examined, p, diagnosed by histologies] methods. ER and PR (frnol/mg protein). Tumor tissues exhibiting ER or PR values higher than 10 fmol/mg are considered to be positive (p), those with values below negative (n).
DNA fragment of the plasmid pRNfos (27) was used as a probe. The intensities of the 18/28 S rRNA (stained by ethidium bromide) bands were used for stan-dardisations.
Results and discussion
Cultivation of epithelial cell fractions of normal human breast
tissue and of primary breast tumors
The cultivation of epithelial breast tissue cells was basically
performed as described (20—33) but some important
modifica-tions had to be introduced in order to obtain large and
homo-geneous cultures of the epithelial cell fraction from die tissues.
Cell cultures drat initially consisted of a mixture of fibroblasts
and of epithelial cells (Figure 1) were stepwise enriched in
epithelial cells by fractionated trypsinization as well as by the
use of a relatively high Ca concentration (0.3 mM).
Homogeneous epithelial cell cultures were obtained after 2—4
passages (Figure lb). To verify die epithelial character of these
cell cultures irnmunostaining was performed using anticytokeratin
antibodies (see Materials and methods). The cells that were
assumed to be epithelial became stained by tiiis antibody, whereas
fibroblasts obtained from tiiese tissues did hardly bind the
antibody (Figure 2). Using die same antibody in a Western blot
analysis revealed in addition that mainly die membrane fractions
of die epithelial cells exhibited several proteins in the range
between 30 and 50 kDa that are recognized by the anticytokeratin
antibody whereas fibroblasts exhibited only very weak and
unspecific hybridization, mainly to proteins of the cytosolic
protein fraction (Figure 3). These results demonstrate diat the
distinction between fibroblasts and epithelial cells judged by
morphological criteria is reliable enough.
Forty-six epithelial cell cultures were grown that stemmed from
breast tissues of patients suffering from breast cancer.
Twenty-five of diem were derived from normal breast tissue and 21 from
breast tumors of diese patients. Twenty-two of them represented
pairs of carcinoma and of normal tissue respectively, of eleven
patients. Within 6 - 9 weeks ( 5 - 7 passages) the cells were grown
to high cell volumes (5 x 10
8cells). When using complete
growth medium (supplemented wim horse serum, hydrocortisone,
insulin and EGF) all cell cultures exhibited very similar growdi
rates independent of die nature of die original tissue (normal or
tumor). Ten per cent of die cultures exhibited no drastic but still
distinct specific differences in tiieir cellular morphologies but
diese differences could not be connected with features of die
respective tissue or patient. Some typical morphologies of die
46 cultures are shown in Figure lb.
Besides diese 46 cultures there were 25 cultures whose cells
ceased growing after few passages. Ten of diem were derived
from normal and 15 from tumor tissues. We conclude tiiat
epidielial cell cultures exhibited about die same probability to
grow to higher passage numbers independent of the character
of die original tissue.
Taken together, our observations suggest dial cell morphologies
and growdi properties of epidielial short-term cell cultures derived
from breast tissue exhibited some individual but no tumor-linked
variations.
Protein levels of PKC isoenzymes
Using die primary cell cultures described in the previous section
die content of various PKC isoenzymes was determined. The goal
was to analyze possible differences in die expression levels of
various PKC isoenzymes comparing normal and tumor tissues.
Using monoclonal or polyclonal antibodies protein levels of die
PKC isoforms a, 0, y, 5, e and f respectively, were determined
by Western blot analysis. Protein fractions (cytosol and
membrane) of each individual culture were prepared before and
after die addition of die phorbol ester and PKC activator TPA.
Figure 4 shows die typical pattern of die down-regulation of die
various PKC isoenzymes upon treatment with TPA. aPKC is
very efficiendy translocated to die membrane and subsequendy
down-regulated upon treatment of die cells by die phorbol ester.
ePKC is only partially translocated to the membrane and is very
slowly down-regulated. The efficiency of die translocation as well
Tumor-specific expression levels in human breast
A B
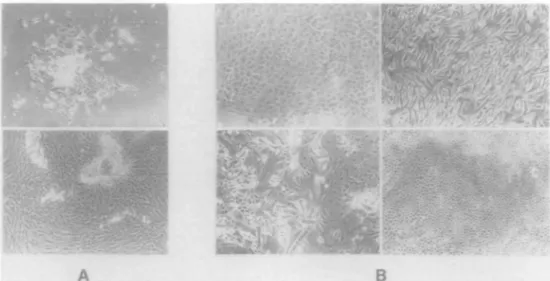
Fig. 1. Cell cultures from various tissues and culturing times. (A) Upper: cell culture NO-2-15056 10 days after initial seeding of the normal breast tissue.
Epithelial cells in the middle, fibroblasts on the top right. Lower: the same culture 10 days later. (B) Cell cultures CA-2-21441 (top left), NO-2-18807 (top right), NO-1-15644 (bottom left) and CA-2-20538 (bottom right) after 4 weeks exhibiting different morphologies. The cells were grown as described in Materials and methods.
as the subcellular distribution of this subspecies varied from
culture to culture. 6- and f -isoenzymes did not at all translocate
or down-regulate upon the addition of TPA in any of the cultures.
Basal PKC protein levels exhibited by the individual cell
cultures are shown in Table I and discussed in the following.
No /3- or 7-PKC could be found at detectable levels in any of
the cultures. The levels of f-PKC were found to be very similar
in all of the cultures. Comparing the cell cultures differences of
the total protein levels (membrane plus cytosol) of up to a factor
of five were found for each of the three isoenzymes, a-, 5- and
e-PKC. No positive or negative correlation between expression
levels of the three subspecies in the individual cultures could be
detected suggesting that there is no mutual dependence of
expression levels of PKC isoenzymes. Cell cultures exhibiting
high levels (relative values of 3 - 5 in Table II) of any of these
three PKC isoenzymes occurred as frequently with cultures
originating from tumors as with those from normal tissues: high
a levels with 4/25 of the NOs versus 3/21 of CAs, high <5 levels
with 7/25 of the NOs versus 4/21 with CAs and high e levels
with 7/25 NOs versus 7/21 CAs. This indicates that high levels
of specific PKC isoenzymes did not correlate with tumor tissues.
Finally we asked the question whether there was a connection
of high PKC protein levels and clinical parameters like age, tumor
size, nodal or estrogen or progesterone receptor status. Groups
of patients (like 9 out of 32 patients for T > 3, 13 patients for
N > 1, 11 patients with high ER or 10 patients with high PR)
were compared with strong PKC expressors but not even one
significant correlation could be found. Our results suggest that
PKC protein levels feature naturally random variations and that
epithelial cell fractions of carcinomas and of normal breast tissues
can therefore not be simply distinguished by such protein levels.
Our finding is opposing reports that describe altered PKC levels
or enzyme activities in various types of tumors (7-13,28) but
the finding is in accordance with the report by Regenass et al.
(23) where no difference in PKC enzyme activities could be found
when primary cell cultures derived from normal human breast
tissue had been compared to those derived from breast
carcinomas. However, specific isoforms of this kinase might still
be involved in the development of breast cancer but rather on
the level of their enzymatic activation along the signal
transduc-tion pathways to which they belong.
Fig. 2. Immunostaining of epithelial cells and of fibroblasts by
anticytokeratine antibodies. The epithelial (A) and the fibroblast (B) cell fractions of the cell culture of CA-2-21441 were stained with the
anticytokeratine antibody (AE1/AE3) as described in Materials and methods. 1 C M 2 c '<• 3 4 M C M 3 C M 2 C M
B
Fig. 3. Western blot analysis. 70 jig of fractionated proteins (C = cytosol, M = membrane) of the various cell cultures were separated on a 12% SDS-PAGE, blotted to nitrocellulose and hybridized to the anticytokeratine antibody (AE1/AE3, Boehringer, Mannheim). (A) Epithelial cell fraction of NO-2-14686 (1), CA-2-14686 (2), NO-2-14055 (3) and CA-2-14055 (4). (B) Fibroblast cell fraction of the same cultures as under (A). No fibroblast fraction could be obtained from culture CA-2-14055. The bars represent marks for proteins with mol. wts of 35 kDa (lower) and 45 kDa (upper).
Basal and inducible levels of c-fos mRNA
It is known that activation of PKC leads to the induction of nuclear
proteins like c-FOS (19). The induction of FOS as a component
of the transcription factor AP-1 is an essential event for cell cycle
progression and mitosis (16,17,29). Up- and down-regulation of
c-fos mRNA upon TPA induction has been analyzed using 41
of the 46 cell cultures derived from 24 normal and from 17
carcinoma tissues (Figure 5a). The very heterogeneous
indu-c
2 3M
2 3C
2 3
M
1 2 3Fig. 4. Western blot analysis for PKC isoenzymes. Using the cdl culture
NO-1-21329 a time course experiment was performed to follow the various PKC isoenzymes upon the addition of the phorbol ester TPA to the cells. 70 fig of fractionated proteins (C = cytosol, M = membrane) were separated by SDS-PAGE (8%), blotted to nitrocellulose and hybridized to the PKC isoenzymes-specific antibodies against a-, 5-, e and f-PKC (see Materials and methods). Without phorbol ester TPA (1), 30 min (2) and 4 h (3) after the addition of TPA. Arrows represent mol. wt markers: 93 kDa (upper) and 68 kDa (lower).
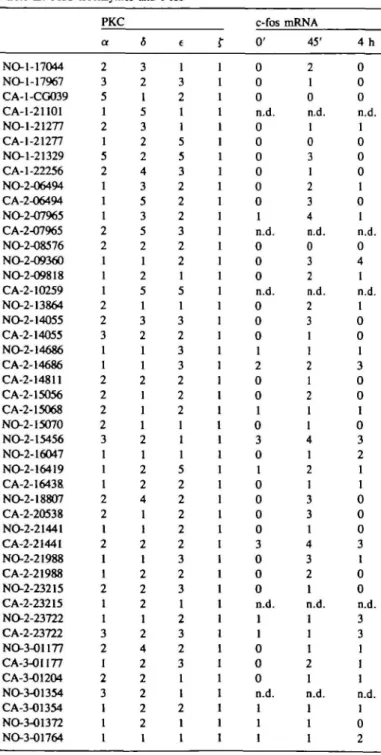
Table U. PKC NO-1-17044 NO-1-17967 CA-1-CG039 CA-1-21101 NO-1-21277 CA-1-21277 NO-1-21329 CA-1-22256 NO-2-06494 CA-2-06494 NO-2-07965 CA-2-07965 NO-2-08576 NO-2-09360 NO-2-09818 CA-2-10259 NO-2-13864 NO-2-14055 CA-2-14055 NO-2-14686 CA-2-14686 CA-2-14811 CA-2-15056 CA-2-15068 NO-2-15070 NO-2-15456 NO-2-16047 NO-2-16419 CA-2-16438 NO-2-18807 CA-2-20538 NO-2-21441 CA-2-21441 NO-2-21988 CA-2-21988 NO-2-23215 CA-2-23215 NO-2-23722 CA-2-23722 NO-3-01177 CA-3-01177 CA-3-01204 NO-3-01354 CA-3-01354 NO-3-01372 NO-3-01764 isoenzymes PKC or 2 3 5 1 2 1 5 2 1 1 1 2 2 1 1 1 2 2 3 1 1 2 2 2 2 3 1 1 1 2 2 1 2 1 1 2 1 1 3 2 1 2 3 1 1 1 and 5 3 2 1 5 3 2 2 4 3 5 3 5 2 1 2 5 1 3 2 1 1 2 1 1 1 2 1 2 2 4 1 1 2 1 2 2 2 1 2 4 2 2 2 2 2 1 c-fos e 1 3 2 1 1 5 5 3 2 2 2 3 2 2 1 5 1 3 2 3 3 2 2 2 1 1 1 5 2 2 2 2 2 3 2 3 1 2 3 2 3 1 1 2 1 1 c-fos
r o'
1 0 1 0 1 0 1 n.d. 1 0 1 0 1 0 1 0 1 0 1 0 1 n.d. 1 0 0 0 n.d. 0 0 0 1 2 0 0 1 0 3 1 0 1 1 0 0 1 0 1 0 3 0 1 0 1 0 1 n.d. 1 1 1 1 0 0 I 0 n.d. 1 1 1 1 1 1 mRNA 45' 2 1 0 n.d. 1 0 3 1 2 3 4 n.d. 0 3 2 n.d. 2 3 1 1 2 1 2 1 1 4 1 2 1 3 3 1 4 3 2 1 n.d. 1 1 1 2 1 n.d. 1 1 1 4 h 0 0 0 n.d. 1 0 0 0 1 0 1 n.d. 0 4 1 n.d. 1 0 0 1 3 0 0 1 0 3 2 1 1 0 0 0 3 1 0 0 n.d. 3 3 1 1 1 n.d. 1 0 2Relative protein levels of four isoenzymes of PKC and relative levels of c-fos mRNA (before and after induction by the pborbol ester TPA were determined in the various epithelial cell cultures stemming from normal human breast tissue (NO) or from breast carcinoma tissue (CA). The figures represent relative levels determined by denshometric measurements of protein or mRNA bands obtained after Western analysis for the PKC isoenzymes (see also Figure 4) and after Northern analysis for c-fos mRNA (0' = without TPA, 45' and 4 h after the addition of 100 nM TPA). The figures for the PKC isoenzymes are understood as relative levels (denshometric determination) of each isoenzyme among the various cell cultures. This means that only the figures in each column can be compared with each other but not the figures within lines. All figures can be compared with each other for the relative levels of c-fos mRNA. n.d., not determined.
a
0 C 0a
0b
0 1ed
0 1 0 « c-fos »Fig. 5. Northern analysis after induction of c-fos mRNA by phorbol ester
TPA. Cell cultures were analysed for their basal levels of c-fos mRNA (lanes 0) and for the respective c-fos mRNA levels 1 and 4 h after the addition of the phorbol ester TPA (100 nM). Total mRNA was prepared and 10 pg were separated on an agarose gel (see Materials and methods). The gel was transferred to Zeta-Probe (Biorad) and hybridized against the c-fos probe as described in Materials and methods. (A) represents the cell cultures NO-2-14055 (a), CA-2-14686 (b) and NO-2-09360 (c).
(B) represents the established breast carcinoma cell line MDA-MB-134 (a), the breast carcinoma cell line ZR-75-1 (b), the breast carcinoma breast cell line MCF-7 (c) and the normal breast cell line HBL-lOO (d).
cibilities of c-fos mRNA by TPA are shown in Table I and are
summarized in the following, (i) In three cases (two tumors and
one normal tissue) c-fos mRNA could not be induced at all by
the phorbol ester, (ii) A 'normal' time course of c-fos mRNA
induction—that is a very pronounced peaking at around 45 min
followed by a rapid down-regulation—was observed in 17 cases
(8 normal tissues, 7 tumors), (iii) In 11 cases (8 normal tissues,
3 tumors) c-fos mRNA was induced but was not rapidly
down-regulated, (iv) The remaining 12 cultures (7 normal tissues, 5
tumors) were identical to (iii) but exhibited, in addition, relatively
high basal c-fos mRNA levels. We can therefore state that basal
c-fos mRNA levels as well as the inducibility of this message
by the phorbol ester TPA are very heterogeneous among the cell
cultures. The ratios NOs versus CAs in these groups demonstrate
that there are no significant correlations between any of these
groups and the tumor or the normal tissues. The four groups have
also been compared to tumor and patients' data (Table I) but
basically no interconnections could be detected. The most
promising—although weak—correlation was that 6 out of a total
of 12 cultures exhibiting high basal c-fos levels (group iv)
belong-ed to the group of 15 patients with N ^ 1.
In this context it is worthwhile to mention that the established
cell line HBL-lOO (normal breast tissue) as well as the breast
carcinoma cell line ZR-75-1 exhibit an induction pattern of the
c-fos gene like group ii (Figure 5b). In contrast, c-fos can hardly
be induced in MDA-MB-134 (breast carcinoma cell line) by TPA
whereas MCF-7 (breast carcinoma cell line) already exhibits high
basal c-fos mRNA levels and very high levels of this message
are reached upon the addition of TPA. It can therefore be stated
that the very heterogeneous levels of c-fos mRNA and its
inducibility by TPA as well as the independence of this pattern
Tumor-specific expression levels in human breast
from the character of the original breast tissue are not only a
feature of the 41 primary cell cultures but also of established
human breast cell lines.
Our results suggest that altered cellular growth regulation in
human breast tumors is not connected with altered expression
levels of specific isoenzymes of PKC nor with an altered
PKC-driven expression of c-fos.
Acknowledgements
We would like to thank J.Torborst (Institute of Pathology, University Hospital, Basel) who provided us with samples of human breast tissues. We are grateful to K.Ballmer for his help with immunofluorescence staining. The work has been supported by the Swiss National Science Foundation (32-26429 and 32-38022), the Schweizerischen Krebsliga (FOR 492.90) and the Krebsliga Beider Basel.
References
1. Darbre,P.D. (1990) Steroids and steroid receptors in growth control of cultured breast cancer cells. Int. J. Cancer, Suppl. 5, 6 7 - 7 5 .
2. Dkkson,R.B. and Iippman.M.E. (1987) Estrogenk regulation of growth and polypeptide growth factor secretion in human breast carcinoma. Endocrine
Rev., 8, 2 9 - 4 3 .
3. Brunner.N. (1990) Human breast cancer growth and progression: role of secreted polypeptide growth factors. Int. J. Cancer, Suppl. 5, 6 2 - 6 6 . 4. CullenJCJ., Smith,H.S., Hfll.S., Rosen.N. and Lippman,M.E. (1991) Growth
factor messenger RNA expression by human breast fibroblasts from benign and malignant lesions. Cancer Res., 51, 4978-4985.
5. Nishizuka.Y. (1988) The molecular heterogeneity of protein Itinase C and its implications for cellular regulation. Nature, 334, 661—665.
6. Roos.W., Fabbro.D., KQng.W., Costa.S.D. and Eppenberger.U. (1986) Correlation between hormone dependency and the regulation of epidermal growth factor receptor by tumor promoters in human mammary carcinoma cells. Proc. NatL Acad Sd. USA, 83, 991-995.
7.Kopp,R., Noelke.B., Sauter.G., Schildberg.F.W., Paumgaitner,G. and Pfeiffer.A. (1991) Altered protein kinase C activities in biopsies of human colonic adenomas and carcinomas. Cancer Res., 51, 205—210. 8.Hashimoto,Y., Chida.K., Huang,M., Katayama.M., Nishihira.T. and
Kurolti.T. (1989) Levels of protein kinase C activity in human gastro-intestinal cancers. Biochem, Biophys. Res. Commun., 163, 406—411.
9. Hirai,M.,Gamou,S.,Kobayashi,M. and Shimizu,N. (1989) Lung cancer cells often express high levels of protein kinase C activity. Jpn. J. Cancer Res., 80, 204-208.
10. Rydell.E.L., Axelsson.K.L. and OlofssonJ. (1988) Protein kinase C activity in normal and neoplastic squamous epithelia from the upper aero-digestive tract. Second Messengers and Phosphoproteins, 12, 155-162.
11. Shimosawa,S., Hachiya.T., Hagiwara.M., Usuda.N., Sugita.K. and Hidaka.H. (1990) Type-specific expression of protein kinase C isoenzymes in CNS tumor cells. Neurosci. Lett., 108, 11-16.
12. Wada.H., Ohno.S., Kubo.K., Taya.C, Tsuji.S., Yonehara.S. and Suzuki.K. (1989) Cell type-specific expression of the genes for the protein kinase C family: down regulation of mRNA for PKCa and PKCe upon in vitro dif-ferentiation of a mouse neuroblastoma cell line neuro 2a. Biochem. Biophys.
Res. Commun., 165, 533-538.
13. Reifenberger.G., Deckert,M. and Wechsler.W. (1989) Immunohistochemical determination of protein kinase C expression and proUftrative activity in human brain tumors. Ada NeuropathoL, 78, 166-175.
14. Kelly.K., Cochran.B.H., Stiles.C.D. and Leder.P. (1983) Cell specific regulation of the c-myc gene by lymphocytic mitogens and platelet derived growth factor. Cell, 35, 603-610.
15. Muller.R., Curran.T., Miller.D. and Guilbert.L. (1985) Induction of c-fos during myelomonocytic differentiation and macrophage proliferation. Nature,
314, 546-548.
16. Ran,W., Dan.M., Levine.R.A., Henlde.C. and CampisiJ. (1986) Induction of c-fos and c-myc mRNA by epidermal growth factor or calcium kmophore is cAMP dependent. Proc. Nail. Acad. Sd. USA, 83, 8216-8220. 17. Tramontano.D., Chin,W.W., Moses.A.C. and Ingbar.S.H. (1986)
Thyrotropin and dibutyryl cyclic AMP increase levels of c-myc and c-fos mRNAs in cultured rat thyroid cells. /. Biol Chan., 261, 3919-3922. 18. Chiu.R., Boyte.W.J., MeekJ., Smeal.T., Hunter.T. and Karin.M. (1988)
The fos protein interacts with c-Jun/AP-1 to stimulate transcription of AP-1 responsive genes. Cell, 55, 1 - 3 .
19. Hunter.T. and Karin,M. (1992) The regulation of transcription by phosphoryla-tion. CeU, 70, 375-387.
20. Stampfer.M., Hallowes.R.C. and Hackett,A.J. (1980) Growth of normal human mammary cells in culture. In Varo, 16, 415-425.
21. Stampfer.M. (1982) Cholera toxin stimulation of human mammary epithelial cells in culture. In Vitro, 18, 531-537.
22. Soule.H.D. and McGrath.C.M. (1986) A simplified method for passage and long-term growth of human mammary epithelial cells. In Vitro CeilDev. Biol, 2 2 , 6 - 1 2 .
23. Regenass.U., Geleik.D., Curschellas.E., Meyer.T. and Fabbro.D. (1989)
In vitro cultures of epithelial cells from healthy breast tissues and cells from
breast carcinomas. Recent Results Cancer Res., 113, 4 - 1 5 .
24. Bomer.C, Wyss.R., Regazzi.R., Eppenberger.U. and Fabbro.D. (1987) Immunologica] quantitation of phospholipid/Ca2+-dependent protein kinase of human mammary carcinoma cells: inverse relationship to estrogen receptors.
Int. J. Cancer, 40, 344-348.
25. Crabos.M., Imber.R., Woodtli.T., Fabbro.D. and Eme.P. (1991) Different translocation of three distinct PKC isoforms with tumor-promoting phorbol ester in human platelets. Biochem. Biophys. Res. Commun., 178, 878-883. 26. Chomcynski.P. and Sacchi.N. (1986) Single step method of RNA isolation by acid guanidinium thiocyanate-phenol-chloroform extraction. AnaL
Biochem., 162, 156-159.
27. Imber.R. and Fabbro.D. (1991) Tumor-promoting phorbol ester and activated Ha-ras synergistically reduce the interleukin 3 requirement in a mast cell line.
Cancer Res., 50, 632-638.
28. Yamanishi.D.T., Graham.M., BuckmeierJ.A. and Meyskens.F.L.Jr (1991) The differential expression of protein kinase C genes in normal human neonatal melanocytes and metastatic melanomas. Carcinogenesis, 12, 105 — 109. 29. Cantley,L.C, Auger.K.R., Carpenter.C, Duckworth.B., Grazini.A.,
Kapeller.R. and Soltoff.S. (1991) Oncogenes and signal transduction. Cell, 64, 281-302.
Received on May 27, 1993; revised on November 12, 1993; accepted on November 18, 1993