Reactions
of
proteins with oxidizing lipids
1. Analytical measurements of lipid oxidation and of amino acid losses in a whey protein-methyl linolenate model system
B Y H E N R I K K. NIELSEN*, J. L O L I G E R A N D R. F. H U R R E L L Research Department, Nestlt! Products Technical Assistance Co. Ltd,
CH-1814 La Tour-de-Peilz, SwitzerIand (Received 8 May 1984 - Accepted 18 July 1984)
1. The reactions between protein-bound amino acids and oxidizing lipid were investigated in a whey protein-methyl linolenate (C18 &water model system. The extent of fat oxidation was followed by measuring oxygen uptake, hydroperoxide formation and hydrocarbon (ethane and pentane) formation.
2. Significant losses occurred with lysine (up to 71 %), tryptophan (up to 31 %) and histidine (up to 57%). Methionine was extensively oxidized to its sulphoxide but less than 2% was further oxidized to the sulphone. No other amino acids were affected.
3. Increasing storage temperature (20", 37", 55") resulted in an enhancement of fat oxidation reactions and amino acid degradation.
4. Increasing water activity (0.28, 0.65, 0.90) increased losses of lysine and tryptophan but had no influence on the oxidation of methionine, the level of remaining hydroperoxides or 0, uptake. Hydrocarbons were decreased.
5. Limitation of 0, uptake to 1 mol/mol lipid instead of excess 0, (0, uptake about 2.5 mol/mol lipid in 4
weeks) significantly reduced the degradation of lysine and tryptophan but had less influence on the oxidation of methionine. The level of remaining hydroperoxides was increased but hydrocarbons were unaffected.
Lipid oxidation occurs when unsaturated fatty acids autoxidize via free radical reactions into hydroperoxides, cyclic peroxides, epoxides, etc. These primary products subsequently degrade into a vast number of secondary products such as saturated or unsaturated aldehydes and ketones, bi- and trifunctional compounds and hydrocarbons (Karel, 1973 ; Chan & Levett, 1977; Frankel, 1982). Many of the latter compounds give off-flavours and cause rancidity in foodstuffs. Such reactions have been reported in potato flakes (Labuza
& Bergquist, 1983; Loliger & Jent, 1983), fish products (Khayat & Schwall, 1983), cereals
(Harrison et al. 1976), poultry (Dawson & Gartner, 1983) and milk products (Hicks, 1980). Lipid oxidation products can also react with protein-bound amino acids. The most sensitive amino acids have been reported to be methionine (Braddock & Durgan, 1973; Gamage & Matsushita, 1973), cyst(e)ine (Roubal, 1971), tryptophan (Kanazawa et al. 1975), lysine (Horigome & Miura, 1974; Chiba et al. 1976), histidine (Desai & Tappel, 1963; Yanagita et al. 1973; Matoba et al. 1982) and tyrosine (O'Brien, 1966; Roubal & Tappel, 1966). Tryptophan and the sulphur amino acids are assumed to be oxidized by the primary products (Tannenbaum et al. 1969; Yong et al. 1980; Finley et al. 1981) whereas lysine is thought to react with the secondary products (Kanazawa et al. 1975). In some studies, almost all amino acids appear to have reacted (Roubal & Tappel, 1966; Horigome & Miura, 1974).
In the present work, the influence of different factors (time, temperature, water activity and oxygen limitation) on lipid oxidation and amino acid losses has been investigated chemically in a whey protein-methyl linolenate-water model system. In the following paper (Nielsen et al. 1985) the nutritional importance of the interaction between protein and oxidizing lipid has been evaluated using animal assays.
62
H. K. NIELSEN,
J. LOLIGER
A N DR. F. H U R R E L L
E X P E R I M E N T A L
The study consisted of two storage trials in which whey protein was stored with a mixture of methyl linolenate and water. In the first trial, we investigated the influence of storage time and temperature, water activity (a,) and 0, on lipid oxidation and on the losses of lysine, methionine and tryptophan. In the second trial, all amino acids were measured and the levels of lysine and methionine were determined by different analytical procedures. The test materials from the second storage trial were subsequently evaluated in rat assays (Nielsen et al. 1985).
Preparation of test materials
Protein. Whey protein was prepared from skimmed milk by a procedure similar to that described by Hilpert et al. (1977). The ultrafiltration step was extended so as to give a very low lactose content (2 mg/g).
Lipid. For cost considerations, technical grade methyl linolenate was used (Fluka AG ; Buchs, Switzerland). It contained (mmol/mol) 700-800 methyl linolineate (CIS:
&,
200-250 methyl linoleate (C18:2) and a small amount of other methyl esters (primarily methyl oleateModel systems. In order to investigate the influence of time and temperature of storage, a, and 0, on fat oxidation and amino acid losses, a series of model systems were prepared and stored for 1,2 and 4 weeks under the conditions described in Table 1. A given quantity of whey protein (100-300 g) was mixed with half its weight of methyl linolenate in a handmixer (type 394; Moulinex SA, Zurich, Switzerland). Either no water, or some water (0.09 g/g protein or 0.27 g/g protein respectively) was sprayed into the product while mixing. The mixture was then milled (3 x 30 s) in a coffee mill (type A 70; Eisenbach, W.
Germany) before being weighed (0.75-3.53 g) into 400-ml enamelled aluminium tins (type AKU 84.5; Cebal, Clichy, France) which were sealed under air and stored. After storage, the mixture was ground, extracted once with 20 ml methanol/g lipid and twice with 20 ml methanol-hexane (2: 1, v/v) per g lipid (both reagents from E. Merck, Darmstadt, W. Germany). It was then left to dry in air and stored overnight in an evacuated desiccator containing sodium hydroxide. Finally the mixture was ground again and stored at 4” until analysed.
A second trial was made in which larger quantities of test materials were stored for
4
weeks under identical conditions to the first trial (Table l), except that the conditions of ‘low temperature’ and ‘medium a,’ were not included. These larger quantities (1 kg) were mixed in a Hobart mixer and were passed through a sieve of 1.5 mm mesh size before weighing (13-342.7 g) into 7.1-litre lacquered tins (Pulverdose 4.5 kg; NestlC, Vevey, Switzerland) and stored.Analytical methods
In the first storage trial, duplicate samples were prepared and each analysed once. The sample-to-sample variation was therefore included in the standard errors. Head-space analysis was only run on duplicate samples for the ‘basal conditions’. For the second storage trial, single samples only were prepared, but they were analysed in duplicate.
Lipidoxidation. 0, uptake and hydrocarbon formation were determined by the head-space technique described by Loliger & Jent (1983). Lipid hydroperoxides were determined by their ability to oxidize ferrous to ferric, which forms a red complex with thiocyanide (Stine
et al. 1954). The reaction was carried out in methanol-hexane (5: 1, v/v).
Nitrogen. N was measured by a Kjeldahl procedure using mineralization and distillation units from Buchi Laboratoriums Technik AG, Flawil, Switzerland (Digestor 430, Distillation Unit 322 and Control Unit 342) and titration units from Metrom AG, Herisau, Switzerland
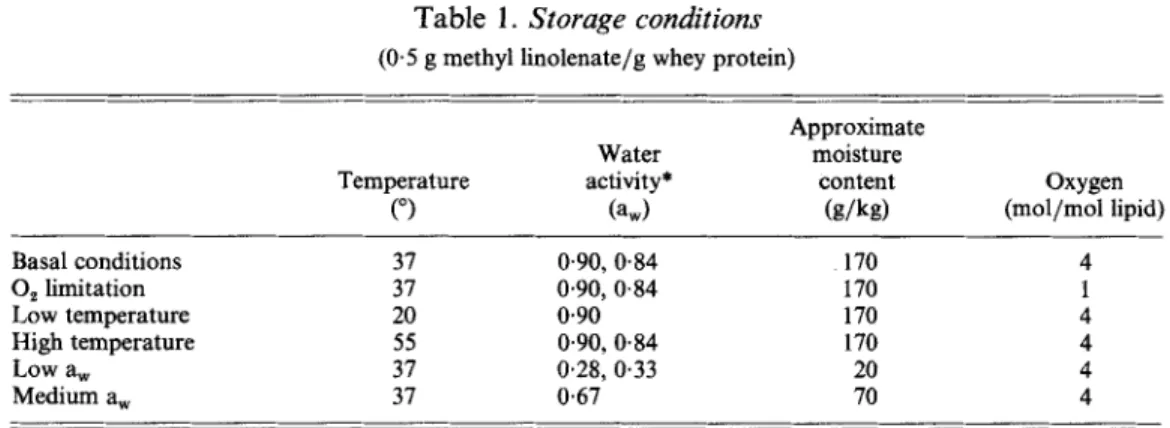
Table 1 . Storage conditions (0.5 g methyl linolenate/g whey protein)
Approximate Water moisture
Temperature activity* content Oxygen
(“) (a,) ( g / W (mol/mol lipid) Basal conditions 0, limitation Low temperature High temperature Low a, Medium a, 37 0.90, 0.84 170 37 0.90, 0.84 170 20 0.90 170 55 0.90, 0.84 170 37 0.28, 0.33 20 3 1 0.67 70
* First value is a, in first storage trial, second value is the a, in second storage trial.
(Dosimat 655, Titrator E 526 and Dosiprint E 533A). A factor of 6.25 was used to convert
N to protein.
Tryptophan. Tryptophan was measured by reverse-phase high pressure liquid chromatography with fluorimetric detection after hydrolysis in NaOH under vacuum. 5- Methyltryptophan was added as an internal standard before hydrolysis and its recovery was used to correct for tryptophan losses (Nielsen & Hurrell, 1985).
Total amino acids. These were determined by ion-exchange chromatography on an amino acid analyser (Beckman Multichrom or Beckman 121 ; Beckman Instruments, Munich, W.
Germany, or Biotronik LC 7000; Biotronik Wissenschaftliche Gerate GmbH, Munich, W.
Germany) after 24 h acid-hydrolysis under reflux in 6 M-hydrochloric acid with N,-bubbling.
Total methionine and cyst(e)ine. The protein was first oxidized with performic acid (16 h,
4”). Excess performic acid was destroyed with HBr and total methionine and cyst(e)ine were determined as methionine sulphone and cysteic acid respectively, after 24 h acid-hydrolysis in 6 M-HCl under reflux (Moore, 1963).
Methionine and methionine sulphoxide. Methionine and its sulphoxide were determined separately after alkaline-hydrolysis (Neumann, 1967). The same NaOH-hydrolysates, in which tryptophan was measured, were run on the amino acid analyser. The measured values were corrected using the recoveries of added free methionine (90%) and methionine sulphoxide (83%) and for the 5 % of free methionine that was transformed into the sulphoxide during the hydrolysis.
a-Amino adipic acid. This proposed lysine degradation product was measured after acid-hydrolysis or after dimethyl sulphoxide (DMS0)-HC1 hydrolysis (Spencer & Wold,
1969). a-Amino adipic acid was purchased from Calbiochem, Los Angeles, CA., USA.
Fluorodinitrobenzene (FDNB)-reactive lysine (direct method). The direct FDNB procedure of Carpenter (1960) as modified by Booth (1971) was used. A factor of 1.09 was used to correct for the loss of dinitrophenol (DNP)-lysine during acid-hydrolysis. FDNB and methoxycarbonyl chloride were purchased from Fluka AG, Buchs, Switzerland and Eastman Kodak Co., Rochester, NY., USA respectively.
FDNB-reactive lysine (by dzference). Lysine (rather than DNP-lysine) was determined in the acid-hydrolysates which had been prepared for the direct FDNB method. This value was taken as a measure of the inaccessible or ‘bound’ lysine which had not reacted with FDNB, but was released as lysine on acid-hydrolysis. Reactive lysine by difference was then calculated as ‘total lysine’ minus ‘bound lysine’ (Roach et al. 1967).
64
H.
K.
NIELSEN,
J. LOLIGER
A N DR. F. H U R R E L L
R E S U L T SLipid oxidation
Preliminary experiments showed that the small quantity of test material (0.75-3.53 g)
contained in the 400 ml tin readily-absorbed 0, from the air of the headspace. The partial pressure of 0, did not appear to influence the reaction velocity and the transport of 0, from the air to the powder was not rate-limiting. The results from the first storage trial are shown in Fig. l(a-d).
0 , uptake. After 1 week, there was no 0, left in the samples in which 0, uptake was
limited to 1 mol/mol lipid (Fig. 1 (a)). In other samples, between 2 and 2.5 mol 0, were absorbed per mol lipid in the first week and afterwards little 0, disappeared. 0, uptake at 20" was slightly slower than at 37" or 55".
Hydroperoxides. Temperature had an important effect on the formation and subsequent destruction of hydroperoxides (Fig. l(b)). After 1 week at 20", the level of hydroperoxides
present in the sample was still high although it was reduced progressively on further storage. After 1 week's storage at 37", the samples contained less hydroperoxides than at 20". It
was subsequently shown that the hydroperoxides in this sample had increased rapidly during the first few days, reached a maximum and then fallen to the 7 d level. No hydroperoxides were left after 1 week at 55". The effect of 0, limitation was surprising; when 0, intake was limited, more hydroperoxides were detected.
Hydrocarbons. Fig. l(c) shows the amount of ethane and pentane found in the head-space
analyses. The ratio ethane:pentane was in accordance with the levels of their respective precursors (methyl linolenate and methyl linoleate) present in the model system. Decreasing a, gave higher hydrocarbon levels. 0, limitation had no effect, whereas lowering the temperature significantly slowed down the reaction.
Non-extractable lipids. The protein content of the samples reflects the increasing amount
of bound lipid which was resistant to extraction. All factors had an influence on the level of non-extractable lipid and hence the protein content (Fig. l ( d ) ) . The non-extractable lipid was high at high a,, excess 0, and higher temperatures (37" or 55"). Assuming that the changes in protein content are due to incorporation of lipids only, a decrease in protein content (N x 6.25) from 827 g/kg (day 0) to 649 g/kg (55" sample, 4 weeks) means that the
amount of lipid bound to the protein in the stored sample was 0.33 g/g protein. During
the incubation, 0.57 g lipid was present per g protein (N x 6.25). During the storage period more than half the lipid had thus reacted with the protein or, in other ways, become unextractable.
Amino acid losses
Znjluence of time and temperature of storage, a, and 0,. The kinetics of lysine, methionine
and tryptophan losses together with the formation of methionine sulphoxide under the different storage conditions are shown in Fig. 1 (e-h). FDNB-reactive lysine was progressively
reduced over the 4-week storage period up to a maximum of 71
%
.
Lysine degradation increased with increasing temperature and a, and was significantly reduced by limiting the 0, uptake to 1 mol/mol lipid. Tryptophan was far more stable than lysine and significant degradation occurred only at high a,, excess 0, and elevated temperature. A maximum loss of 31%
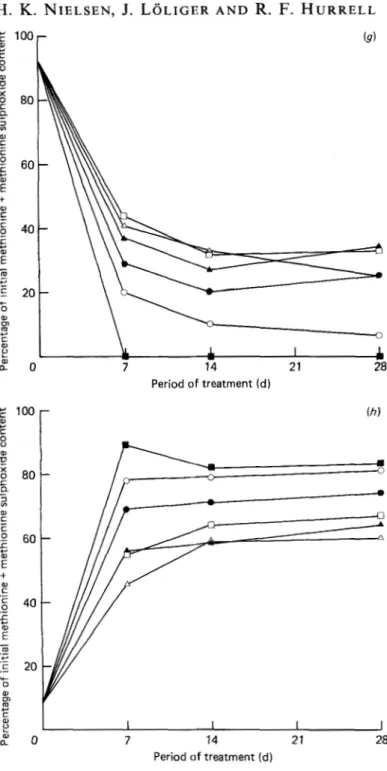
was observed (Fig. l(e)).Methionine was readily oxidized by the oxidizing lipid and was the least stable of the three amino acids studied. At 55", it had completely disappeared after 1 week and, under all conditions, more than 60% was oxidized after 2 weeks. Normally the decrease in methionine led to a corresponding increase in methionine sulphoxide.
Control samples without lipid were also prepared and stored at 37" and at 55". Table 2 shows the amino acids remaining in these samples after 28 d storage. At 55", small losses
65 7 14 21 28 0 6000 5000
-
4000 ._-
-"
-
E,
Z 3000 0 2 2 A 2000 a U I 1000 0 Period of treatment (d) I-
1 L 7 14 21 28 Period of treatment fd)66 8 600 cn Y
.
-
c al 0 .- 4- 400 200H. K. NIELSEN,
J. LOLIGER
A N DR.
F.
H U R R E L L
-
-
-
loool
7 14 21 28 Period of treatment (d) 800 1 I I I 1 0 7 14 21 28 Period of treatment (d) Fig. 1 (c,4.
For legend, see p. 68.Protein-lipid reactions
100 80 m 3 m-
5 .- 60 4- .- C O m 0, .- Y- 40 e Q) lx 20I
1 I I 1 0 7 14 21 28 Period of treatment (d) 0 7 14 21 28 Period of treatment ( d ) Fig. 1 ( e , f ) . For legend, see p. 68.68
H. K.
NIELSEN,
J.
L O L I G E R A N DR.
F. H U R R E L L
r (9) m w m P f? a " 0 7 14 21 28 Period of treatment ( d ) Period of treatment ( d )Fig. 1. Kinetics of (a) oxygen, (b) hydroperoxides, ( c ) ethane (-) and pentane (----), (d) protein content, (e) tryptophan, (f) fluorodinitrobenzene (FDNB)-reactive lysine, (g) methionine, (h) methionine
sulphoxide in a whey protein-methyl linolenate model system stored under different conditions. Basal conditions (O), 0, limitation
(a),
low water activity (a,) (A), medium a, (A), low temperature(n),
high temperature(H)
(see Table 1 for experimental details). Pooled standard errors for mean of duplicate samples: 0, 0.7% (only basal conditions in duplicate), hydroperoxides 30 pmol/g lipid, ethane 0.30 pmollg lipid and pentane 0.1 pmollg lipid (only basal conditions in duplicate), protein content2 g/kg, tryptophan 1.2%, FDNB-reactive lysine 1.4%, methionine 3.2% and methionine sulphoxide 2.0%. Initial value (mg/g crude protein (N x 6.25)) at day 0 for tryptophan was 23.4, FDNB-reactive lysine was 107, methionine was 22.9 and methionine sulphoxide as methionine equivalent was 2.0.
Table 2. Amino acids (mglg crude protein (nitrogen x 6.25)) in control samples (without
lipid) stored at 37" and 55" for 28 d
28 d storage at: Day 0 37" 55" SEM* Pooled ~~~ Tryptophan 23.4 23.4 22.6 0.3 Methionine 22.9 24.3 21.7 0.8
FDNB-reactive lysine 107 I04 102 1
.o
Methionine sulphoxide as methionine equivalents 2.0 0.2 2.7 0.5
FDNB, fluorodinitrobenzene.
* Pooled standard error of mean for all values given in Fig. 1 and Table 2.
of both tryptophan ( 3
%
) and lysine (5%
) were found whereas, at 37", no significant losses were observed. Methionine appeared to be slightly oxidized to methionine sulphoxide during the sample preparations at day 0 and during the storage of the control at 55".Total amino acids. Table 3 shows the total amino acids remaining in the model systems
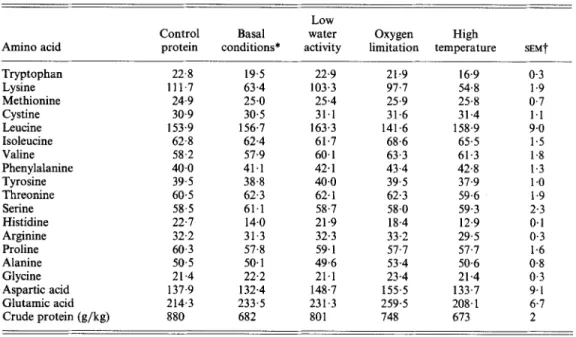
after the second 4-week storage trial. Most amino acids were unaffected but important losses occurred for lysine, histidine and tryptophan. Degradation was highest at high a,, excess 0, and high temperature. The variations in leucine, aspartic acid and glutamic acid were due to the large standard errors.
Lysine degradation. Table 4 shows the lysine content of the five samples from the second storage trial as measured in different ways. The total lysine values of the stored samples show that not all the original lysine molecules were released during acid-hydrolysis. Lysine values measured by the direct FDNB-method were lower than the total values. This indicates that some lysine residues had reacted with fat-oxidation products and could no longer react with FDNB. During acid-hydrolysis these lysine residues regenerated lysine, which was measured by ion-exchange chromatography of the FDNB-treated protein hydrolysates. When these bound-lysine values were subtracted from the total lysine values, FDNB-reactive Iysine ' by difference ' was obtained. The values 'by difference ' were in good agreement with the 'direct' values.
Using ion-exchange chromatography, a-amino adipic acid could not be detected in the acid hydrolysates (with or without DMSO) of the 'basal conditions' sample.
Methionine oxidution. Alkaline-hydrolysis was used to determine separately methionine and methionine sulphoxide in the test material from the second storage trial. The two compounds were measured in the same NaOH-hydrolysates as were prepared for tryptophan. The results are shown in Table 5. The recoveries of free methionine and methionine sulphoxide added to casein or to a lipid oxidation sample were on average 90 (SE 3)% and
83 (SE 2)% respectively (four determinations). Of the added free methionine, 5% was oxidized to methionine sulphoxide. In the sample stored at high temperature (55"), no methionine was detected after alkaline-hydrolysis, i.e. methionine sulphoxide was not reduced to methionine during the hydrolysis. Based on these findings, the values for methionine and methionine sulphoxide were corrected.
In the samples incubated with methyl linolenate, methionine was extensively oxidized to its sulphoxide. Even in the low a, sample, in which virtually no changes in total amino acids had occurred (see Table 3 ) , 75% of the methionine was oxidized.
No changes in total methionine, measured as methionine sulphone after performic acid oxidation and acid-hydrolysis, were seen (Table 5). In addition, during the standard 6 M-HCl
hydrolysis with N,-bubbling, methionine sulphoxide appeared to be quantitatively reduced to methionine.
H. K. NIELSEN,
J.
L O L I G E R A N DR. F.
H U R R E L L
Table 3. Total amino acids (mglg crude protein (nitrogen x 6.25)) of whey protein control
and stored whey protein-methyl linolenate model systems from second storage trial
Low
Control Basal water Oxygen High
Amino acid protein conditions* activity limitation temperature SEMt
Tryptophan 22.8 19.5 22.9 21.9 16.9 0.3 Lysine 111-7 63.4 103.3 97.7 54.8 1.9 Methionine 24.9 25.0 25.4 25.9 25.8 0.7 Cystine 30.9 30.5 31.1 31.6 31.4 1.1 Leucine 153.9 156.7 163.3 141.6 158.9 9.0 Isoleucine 62.8 62.4 61.7 68.6 65.5 1.5 Valine 58.2 57.9 60.1 63.3 61.3 1.8 Phenylalanine 40.0 41.1 42.1 43.4 42.8 I .3 Tyrosine 39.5 38.8 40.0 39.5 37.9 1
.o
Threonine 60.5 62.3 62.1 62.3 59.6 1.9 Serine 58.5 61.1 58.7 58.0 59.3 2.3 Histidine 22.7 14.0 21.9 18.4 12.9 0.1 Arginine 32.2 31.3 32.3 33.2 29.5 0.3 Proline 60.3 57.8 59.1 57.7 57.1 1.6 Alanine 50.5 SO. 1 49.6 53.4 50.6 0.8 Glycine 21.4 22.2 21.1 23.4 21.4 0.3 Aspartic acid 137.9 132.4 148.7 155.5 133.7 9.1 Glutarnic acid 214.3 233.5 23 1.3 259.5 208.1 6.7 Crude protein (g/kg) 880 682 801 748 673 2* For storage conditions, see Table 1.
t
Pooled standard error of mean of duplicate analyses.Table 4. Lysine contents (rnglg crude protein (nitrogen x 6.25)) in samples from second storage trial
FDNB-reactive Total* Bound? By difference
(A) (B) (A-B) Direct
Control protein 112 0 112 105
Basal conditions 63 23 40 42
Low water activity 103 9 94 89
Oxygen limitation 98 11 87 78
High temperature 5 5 30 25 31
POOled SEM 2 1 2 1
FDNB, fluorodinitrobenzene.
* Acid-hydrolysis (6 M-hydrochloric acid).
7 Lysine regenerated on acid-hydrolysis of the FDNB-treated proteins.
Regarding the sum of methionine and methionine sulphoxide, virtually constant values were obtained except for the ‘high temperature’ sample which was slightly lower. No loss in total methionine after performic acid oxidation was observed for this sample, and when an acid-hydrolysate was run on the amino acid analyser, a very small methionine sulphone peak was seen. It corresponded to 0.3 mg/g crude protein and could only account for a
fraction of the observed decrease in the sum of methionine and methionine sulphoxide after alkaline-hydrolysis (21.7
-,
20.1 mg/g crude protein).Protein-lipid reactions
71
Table 5 . Methionine content (mglg crude protein (nitrogen x 6.25)) in samples fromsecond storage trial
Methionine Methionine
+
Methionine sulphoxide in methioninemethionine sulphoxide Performic Alkaline- equivalents (alkaline- Acid- acid
+
acid- hydrolysis (alkaline- hydrolysis) hydrolysis hydrolysis (A) hydrolysis) (B) (A+
B) Control protein 21.6 24.9 21-5 0.2 21.7 Basal conditions 23.6 25.0 1.2 20.1 21.3 Low water activity 23.0 25.4 5.4 16.3 21.7 Oxygen limitation nd 25.9 4.0 18.1 22.1 High temperature 22.6 25.8 0.0 20.1 20.1Pooled SEM 0.9 0.7 0.3 0.4 0.9
nd, Not determined.
D I S C U S S I O N
We have investigated the reactions of protein-bound amino acids with oxidizing lipids by storing a mixture of whey protein, methyl linolenate and water in sealed cans under a large excess of air. The extent of fat oxidation was followed by measuring 0, uptake, the level of hydroperoxides (primary fat-oxidation products) and the hydrocarbons ethane and pentane, which are two of the many secondary fat-oxidation products. Pentane formation in stored food products has been shown to correlate with the development of oxidative rancidity (Loliger & Jent, 1983).
As storage time progressed, the polyunsaturated lipid oxidized and the oxidation
products reacted with the amino acids lysine, methionine, tryptophan and histidine. The reactivity of tyrosine, serine, arginine, proline, alanine and valine reported by other workers (Desai & Tappel, 1963; Roubal & Tappel, 1966; Horigome & Miura, 1974) could not be confirmed. From a chemical point of view, those amino acids with purely aliphatic side-chains would be assumed not to react. As already found by Tannenbaum et al. (1969), Karel et
al. (1975) and Cuq et al. (1978), methionine was readily oxidized to its sulphoxide, with little further oxidation to the sulphone. It was not possible to determine whether cyst(e)ine was oxidized since we were not able to measure the different oxidation products. Ion-exchange chromatograms of acid-hydrolysates did not show any cysteic acid peak, but this, of course, does not exclude formation of the intermediate oxidation products as reported by Finley
et al. (1981).
Storage temperature, a, and 0, level all influenced the extent of fat oxidation and the consequent amino acid losses. Increasing storage temperature, as would be expected, enhanced all reactions. Increasing a, increased the degradation of lysine and tryptophan and decreased hydrocarbon formation but had little influence on the 0, uptake, the level of remaining hydroperoxides, or on the oxidation of methionine. Similar results have been reported for lysine (Yanagita et al. 1973, Matoba et al. 1982) and for methionine (Cuq
el al. 1978). It would appear therefore that methionine oxidation is mechanistically different from the degradation of tryptophan and lysine and that the loss of tryptophan may not result from oxidative degradation, as often assumed (Yong et al. 1980), but from reactions of the indole ring with the secondary products of fat oxidation.
0, limitation also markedly reduced lysine and tryptophan degradation but had little influence on the oxidation of methionine. Rather surprisingly, more hydroperoxides were formed when 0, was limited than when it was in excess, indicating that 0, might enhance
72
H .
K. NIELSEN,
J. LOLIGER
A N DR.
F. H U R R E L L
hydroperoxide decomposition. As with the samples stored at different a,, the levels of ethane and pentane did not correlate with the extent of lysine damage despite the fact that these hydrocarbons are markers for the secondary lipid oxidation products. This is perhaps not unexpected since the hydrocarbons form only a small part of the many different lipid degradation products and they themselves would not be expected to react with lysine. The maximum level of ethane (10 pmol/g lipid) detected in our model systems represents only 1/300th of the methyl linolenate original present, most if not all of which had been oxidized. Lysine degradation would presumably correlate better with the formation of aldehydes and ketones. Only by more thorough examination of the fat oxidation products would a clearer interpretation of this aspect be possible.
The mechanism of lysine degradation is not precisely known. In our stored model systems large losses of lysine were observed and, from Table 4, it would appear that those lysine residues in the stored samples which failed to react with FDNB comprised residues which both did and did not regenerate lysine on acid-hydrolysis. Good agreement was observed between the FDNB-reactive lysine values determined by the ‘direct’ and by the ‘difference’ methods, indicating that the bound lysine residues regenerated the same amount of lysine on acid-hydrolysis before and after FDNB treatment. This is in contrast to the behaviour of lactulosyl-lysine after early Maillard reactions (Hurrell et al. 1983) and bound lysine after caffeic acid reactions (Hurrell et al. 1982) but similar to the behaviour of glutamyl-lysine or aspartyl-lysine (Hurrell et al. 1976).
Karel et al. (1975) reported that a-amino adipic acid could be formed from lysine during lipid oxidation. An acid-hydrolysate of the sample stored under the ‘basal conditions’, however, did not contain this compound. It has also been suggested that the position of the double bond of the Schiff’s base (the primary condensation product between lysine and an aldehyde) could change to the other side of the N (Holtemand, 1966) so that acid-hydrolysis would liberate a-amino adipic acid semialdehyde. In order to verify this, an acid-hydrolysis was made in the presence of DMSO, which would be expected to have oxidized the aldehyde to a-amino adipic acid ; the ion-exchange chromatogram, however, showed no such peak.
Tryptophan was less degraded than were lysine and methionine. Only at hgher temperatures, high moisture content and no 0, limitation was more than 10% of tryptophan
lost. This is in contrast to the results of Kanazawa et al. (1975), who reported large tryptophan losses. Their results could partly be explained by the use of an acid-hydrolysis procedure for the determination of tryptophan. O’Brien (1966), however, used alkaline- hydrolysis and also found in an aqueous system that tryptophan was more sensitive to losses than lysine. It is possible that their aqueous model system favoured oxidative reactions.
In conclusion, the above-mentioned results confirm previous findings that the reactions between proteins and oxidizing lipids can lead to a considerable loss of the essential amino acids lysine and methionine (by oxidation to the sulphoxide). They do not support claims that the extent of tryptophan degradation is equally large. Loss of tryptophan in the present study, although significant, was much less than that of either lysine or methionine. Animal assays are needed to evaluate the nutritional consequences of these reactions and such assays are described in the following publication (Nielsen et al. 1985).
The authors wish to thank Miss A. Jent, Miss A. Klein and Mr J. Vuichoud for technical
assistance; Mr L. Gagnebin and Mr L. Cerise for preparation of the whey proteins, and
73 R E F E R E N C E S
Booth, V. H. (1971). Journal of the Science of Food and Agriculture 22, 658-666.
Braddock, R. J. & Durgan, L. R. (1973). Journal of the American Oil Chemists' Society 50, 343-374. Carpenter, K. J. (1960). Biochemical Journal 77, 604-610.
Chan, H. W. S. & Levett, G. (1977). Lipids 12, 839-840.
Chiba, H., Doy, H., Yoshikawa, M. & Sugimoto, E. (1976). Agriculturaland Biological Chemistry 40, 1001-1010. Cuq, J.-L., Besancon, P., Chartier, L. & Cheftel, C. (1978). Food Chemistry 3, 85-101.
Dawson, L. E. & Gartner, R. (1983). Food Technology 37, 112-116. Desai, I. D. & Tappel, A. L. (1963). Journal of Lipid Research 4, 204-207.
Finley, J. W., Wheeler, E. L. & Witt, S. C. (1981). Journal of Agricultural and Food Chemistry 29,404-407. Frankel, E. N. (1982). Progress in LipidResearch 22, 1-33.
Gamage, P. T. & Matsushita, S. (1973). Agricultural and Biological Chemistry 37, 1-8. Harrison, B. N., Pla, G. W., Clark, G. A. & Fritz, J. C. (1976). Cereal Chemistry 53, 78-84. Hicks, C. L. (1980). Journal of Dairy Science 63, 11 19-1204.
Hilpert, H., Gerber, H., Amster, H., Pahud, J. J., Ballabriga, A., Arcalist, L., Farriaux, F., de Peyer, E. & Nusslk, D. (1977). In Food and Immunology, vol. 13, Swedish Nutrition Foundation Symposium, pp. 182-196 [L. Hambraeus, L. A. Hansen and H. McFarlane, editors]. Stockholm: Alqvista Wilksell International. Holtemand, A. (1966). Stiirke 18, 319-328.
Horigome, T. & Miura, M. (1974). Journal of the Agricultural Chemistry Society of Japan 48, 437444. Hurrell, R. F., Carpenter, K. J., Sinclair, W. J., Otterburn, M. S. & Asquith, R.S. (1976). British Journal of Hurrell, R. F., Finot, P. A. & Cuq, J. L. (1982). British Journal ofNutrition 47, 191-211.
Hurrell, R. F., Finot, P. A. & Ford, J. E. (1983). British Journal of Nutrition 49, 343-354.
Kanazawa, K., Danno, G. & Natake, M. (1975). Journal of Nutritional Science and Vitaminology 21, 373-382.
Karel, M. (1973). Journal of Food Science 38, 756763.
Karel, M., Schaich, K. & Roy, R. B. (1975). Journal of Agricultural and Food Chemistry 23, 159-163. Khayat, A. & Schwall, D. (1983). Food Technology 37, 130-140.
Labuza, T. P. & Bergquist, S. (1983). Journal of Food Science 48, 712-715.
Labuza, T. P., Tsuyuki, H. & Karel, M. (1969). Journal of the American Oil Chemists' Society 46, 409416.
Loliger, J. & Jent, A. (1983). American Potato Journal 60, 51 1-525.
Matoba, T., Yoshida, H. & Yonezawa, D. (1982). Agricultural and Biological Chemistry 46, 979-986. Moore, S. (1963). Journal of Biofogical Chemistry 238, 235-237.
Neumann, N. P. (1967). In Methods in Enzymology, vol. 1 1 , Enzyme Structure, pp. 487490 [C. H. W. Hirs, editor].
Nielsen, H. K., Finot, P. A. & Hurrell, R. F. (1985). British Journal of Nutrition 53, 75-86.
Nielsen, H. K. & Hurrell, R. F. (1985). Journal of the Science of Food and Agriculture (In the Press). OBrien, P. J. (1966). Biochemical Journal 101, 12P-13P.
Roach, A. G., Sanderson, P. & Williams, D. R. (1967). Journal of the Science of Food and Agriculture 18,274-278. Roubal, W. T. (1971). Lipids 6 , 6 2 4 4 .
Roubal, W. T. & Tappel, A. L. (1966). Archives of Biochemistry and Biophysics 113, 5-8. Spencer, R. L. & Wold, F. (1969). Analytical Biochemistry 32, 185-190.
Stine, C. M., Harland, H. A,, Coulter, S. T. & Jennes, R. (1954). Journal of Diary Science 37, 202-208.
Tannenbaum, S. R., Ahern, M. & Bates, R. P. (1969). Journal of Agricultural and Food Chemistry 17, 1353-1354. Yanagita, T., Sugano, M., Cho, S. & Wada, M. (1973). Journal of the Agricultural Chemistry Society of Japan Yong, S. H., Lau, S., Hsiek, Y. & Karel, M. (1980). In Autoxidation in Food and Biological Systems, pp. 237-247
Nutrition 35, 383-395.
New York: Academic Press.
47, 73-78.
[M. G. Simic and M. Karel, editors]. New York: Plenum Press.