Adsorption
Kinetics, Orientation, and Self-Assembling of N-Acetyl-
L-cysteine
on Gold: A
Combined
ATR-IR, PM-IRRAS, and QCM Study
Marco Bieri and Thomas Bu1rgi*
Institut de Chimie, UniVersite´ de Neuchaˆtel, Rue Emile-Argand 11, 2007- Neuchaˆtel, Switzerland
The adsorption of N-acetyl-L-cysteine from ethanol solution on gold has been studied by in situ attenuated total reflection infrared (ATR-IR) spectroscopy, polarization modulation infrared reflection absorption spectroscopy, and a quartz crystal microbalance. After an initial fast adsorption, in situ ATR-IR revealed two considerably slower processes, besides further adsorption. The appearance of carboxylate bands and the partial disappearance of the carboxylic acid bands demonstrated that part of the molecules on the surface underwent deprotonation. In addition, the CdO stretching vibration of the carboxylic acid group shifted to lower and the amide II band to higher wavenumbers, indicating hydrogen-bonding interactions within the adsorbate layer. Based on the initial ATR-IR spectrum, which did not reveal deprotonation, the orientation of the molecule within the adsorbate layer was determined. For this, density functional theory was used to calculate the transition dipole moment vectors of the vibrational modes of N-acetyl-L-cysteine. The projections of the latter onto the z-axis of the fixed surface coordinate system were used to determine relative band intensities for different orientations of the molecule. The analysis revealed that the amide group is tilted with respect to and points away from the surface, whereas the carboxylic acid is in proximity to the surface, which is also supported by a shift of the C-O-H bending mode. This position of the acid group favors its deprotonation assisted by the gold surface and easily enables intermolecular interactions. Periodic acid stimuli revealed reversible protonation/deprotonation of part of the adsorbed molecules. However, only non-hydrogen-bonded carboxylic acid groups showed a response toward the acid stimuli.
Introduction
Self-assembled monolayers (SAMs) have been studied ex-tensively in recent years,1 due to their large potential for applications in surface-based technologies such as the sensing of biomolecules.2,3 The gold alkanethiol system served as a prototype to study self-assembling phenomena. However, many applications of SAMs rely on the buildup of complex structures on top of functionalized SAMs.4This implies the presence of functional groups, besides the thiol, that fulfill a desired recognition function or that are amenable to chemical modifica-tions. These functional groups influence or even dominate the self-assembling through intermolecular interactions and interac-tions with the surface. An important group, particularly for biochemical applications, are SAMs of cysteine5-7or cysteine-containing molecules, such as, for example, glutathione ( γ-Glu-Cys-Gly).8-13Cysteine adsorption on gold surfaces is influ-enced by intermolecular interactions involving the carboxylic acid groups, as revealed by scanning tunneling microscopy (STM).14Glutathione, a tripeptide containing cysteine, contains two carboxylic acid groups. It was shown recently by in situ infrared spectroscopy that at least one of these carboxylic acid groups forms an additional anchor to the gold surface, besides the strong gold-sulfur bond. Upon interaction with the surface, part of the carboxylic acid groups deprotonates. Although quite detailed molecular level information could be obtained on the adsorbed layer, the multitude of functional groups of the glutathione molecule complicated much deeper insight.
N-Acetyl-L-cysteine (NAC, Figure 1) is much simpler in this respect, containing only one amide and carboxylic acid group,
* Corresponding author. Tel.: ++41 32 718 24 12. Fax: ++41 32 718 25 11. E-mail: [email protected].
Figure 1. Structure of N-acetyl-L-cysteine (NAC, top) and pictorial
representation of the optimized structure of NAC (bottom) as found by density functional theory calculations using a polarizable continuum model (see text for details). The molecular coordinate system is depicted as a box around the molecule with its axes parallel to the principal axes of inertia of the molecule. The fixed surface coordinate system (x,y,z) with the x-y plane defining the surface plane and z the surface normal has the same orientation as the molecular coordinate system for the reference orientation of the molecule. The molecular coordinate system is allowed to rotate around the angles R (x-axis) andβ (y-axis), respectively, providing different orientations of the molecule with respect to the surface coordinate system. The orientation of the amide II transition dipole moment is also given.
1-ethyl-3-(3,3-dimethylaminopropyl)carbodiimide.19
In this contribution, we report on the self-assembling of NAC on gold, as investigated mainly by attenuated total reflection infrared (ATR-IR) spectroscopy.20After a fast initial adsorption, which leads to an adsorbate layer with a well-defined infrared spectrum, two subsequent processes are identified besides the slow increase in coverage. The infrared spectra give evidence for a slow deprotonation of part of the molecules and for intermolecular interactions involving the (protonated) carboxylic acid groups and the N-H of the amide. The orientation of the molecule within the adsorbate layer is determined from a comparison of band intensities of dissolved (randomly oriented) and adsorbed (oriented) molecules. Furthermore, the response of the N-acetyl-L-cysteine SAM toward concentration and acid stimuli is investigated.
Experimental Section
Chemicals. NAC (Figure 1, Sigma-Aldrich Inc., >99%) was used as received. Ethanol (EtOH, Merck p.a.) served as solvent for all ATR-IR, polarization modulation infrared reflection absorption spectroscopy (PM-IRRAS), and quartz crystal mi-crobalance (QCM) measurements reported here. Before each ATR-IR measurement, solutions were treated with nitrogen gas (99.995%, CarbaGas) to remove dissolved oxygen.
In Situ ATR-IR Spectroscopy. Sample Preparation. Ge internal reflection elements (IRE; 50 mm× 20 mm × 2 mm, Komlas) were used for ATR-IR experiments. The IREs were first polished with a 0.25-µm-grain size diamond paste (Buehler, Metadi II) and afterward rinsed copiously with EtOH before the surface was plasma cleaned under a flow of air for 5 min (PlasmaPrep 2, Gala Instrumente). In a subsequent step, a gold layer with a thickness of∼2 nm was sputtered onto the Ge-IRE (Balzers Union SCD 030). For each experiment, a fresh gold layer was prepared. Control experiments with a bare Ge-IRE revealed no NAC adsorption during several hours of exposure to a corresponding solution.
Data Acquisition. ATR-IR measurements were performed with a Bruker Equinox 55 FT-IR spectrometer equipped with a liquid nitrogen-cooled narrow-band MCT detector. A home-built liquid flow-through cell with a volume of 0.077 mL and a gap of 265µm between the IRE and the polished steel surface was used to record ATR-IR spectra at room temperature (T ) 298 K) with a resolution of 4 cm-1. More detailed information about the ATR-IR cell can be found elsewhere.21,22
Modulation Experiments. A typical modulation experiment started with a flow of solvent (EtOH) over the gold-coated Ge-IRE until no variation in the spectrum could be detected (after
∼5 min). The corresponding spectrum, recorded by coadding
200 interferograms, served as reference for all subsequent measurements. Then a solution of NAC (0.6 mM) was allowed to flow at 0.18 mL/min over the gold-coated Ge-IRE. The adsorption and self-assembling process of NAC was followed in situ for 4 h by recording spectra in time intervals of 5 min. In a subsequent step, two kinds of modulation experiments were performed with the N-acetyl-L-cysteine SAM: (i) concentration modulation and (ii) “pH” modulation. In both modulation experiments, the flow of EtOH was replaced by an equally long flow of NAC in EtOH (0.6 mM, modulation experiment i) and HCl in EtOH (∼0.013 mM, modulation experiment ii),
respec-where k ) 1, 2, 3, ..., determines the demodulation frequency, i.e., fundamental, first harmonic, and so on, T is the modulation period, ν˜ denotes the wavenumber, ω is the stimulation fre-quency, and φkPSDis the demodulation phase angle. With a set of time-resolved spectra A(ν˜,t), eq 1 can be evaluated for differ-ent phase angles φkPSDresulting in a series of phase-resolved spectra AkφkPSD. Only spectra demodulated at the fundamental frequency (k ) 1) are reported here. A more detailed description of the modulation technique can be found elsewhere.13,22,23
PM-IRRAS Spectroscopy. Sample Preparation. A cover glass for microscopy (Milian SA, 24 mm× 40 mm) served as substrate. After rinsing the surface copiously with EtOH, the substrate was plasma cleaned under a flow of air during 5 min. A thin gold layer with a thickness of ∼100 nm was then sputtered onto the substrate (Balzers Union SCD 030, sputtering rate ∼0.5 Å/s). Before the immersion in solutions of NAC (typical concentrations of NAC for PM-IRRAS measurements were∼7 mM), the Au surface was again plasma cleaned. After immersion in the solutions for 24 h, the gold sample was rinsed copiously with EtOH and dried in a stream of argon.
Data Acquisition. A Bruker PMA 50 connected to the external beam port of a Bruker Tensor 27 FT-IR spectrometer was used for PM-IRRAS experiments. The gold sample was mounted on an attachment for PM-IRRAS measurements within the PMA 50 compartment. After reflection at an angle of incidence of 85°, the IR beam was focused on a liquid nitrogen-cooled photovoltaic MCT detector in the PMA 50 cabinet. A photo-elastic modulator (Hinds, PEM 90) was used to modulate the polarization of the light at a frequency of 50 kHz. Demodulation was performed with a lock-in amplifier (Stanford Research Systems, SR830 DSP). All spectra were recorded using a sample scan time of 15 min at 4-cm-1 spectral resolution. The final PM-IRRAS reflectance spectra were calculated using the bare gold substrate as the reference.
Quartz Crystal Microbalance Analyses. Instrumentation. Experiments were performed using a QCM 200 microbalance (Stanford Research Systems) with a 5-MHz (nominal) crystal oscillator. The sensors (5 MHz, AT cut, 1 in. in diameter, Stanford Research Systems) are a quartz/chrome/gold composite with an optically clear surface finish (∼50 nm average surface roughness). To provide well-defined flow conditions and high sensitivity, the QCM is equipped with an axial flow cell (Stanford Research Systems) with a volume of∼150 µL. The sample solution is injected perpendicularly with respect to the surface of the QCM crystal and flows radially outward from the input port of the cell to the exit channel at the edge of the cell. The stagnation point is located at the center of the crystal, overlapping the area of highest sensitivity of the flat QCM oscillator. The resulting stagnant point flow field is described in more detail elsewhere.24,25
To reduce noise induced by the flowing liquid the system is operated in open flow mode (siphon principle) and small flow rates < 0.1 mL/min are used. Solvent and sample solutions are stored in separate vessels and can be injected into the axial flow cell via a 6-way selection valve (Upchurch Scientific).
Sample Preparation. Before each QCM experiment, the quartz crystal sensors were immersed in a modified piranha
AkφkPSD(ν˜) )2 T
∫
0 T A(ν˜,t) sin(kωt + φk PSD ) dt (1)besides the thiol. Gold electrodes modified with NAC showed excellent sensitivity and selectivity for Cu(II) determination,15 similar to glutathione-modified gold electrodes.16Also, NAC was used to confine proteins to gold electrodes via electrostatic attraction17,18 or covalent bonding using condensing agent
tively. The modulation experiments finally resulted in a set of time-resolved spectra, which were then transformed by means of a digital phase-sensitive detection (PSD), according to eq 1, to a set of phase-resolved spectra.
Due to the metal surface selection rule, only the z-component of the transition dipole momentµzcontributes to the intensity
of a vibrational band. Note thatµzdepends on the rotation angles R and β.
By using a normalized Lorentzian band shape (half-width at half maximumγ ) 1 cm-1), the spectra for different molecule orientations were calculated according to35
where N is the total number of normal modes andνcalc,iis the calculated frequency of mode i.
Results and Discussion
Orientation of N-Acetyl-L-cysteine within the Adsorbate Layer. The ATR-IR spectra recorded during the self-assembling of NAC on the gold-coated Ge-IRE are depicted in Figure 2. The set of ATR-IR spectra represents the first hour of adsorption with a time interval of∼12 min between subsequent spectra. Obviously, significant differences in the spectra emerge during the self-assembling process, indicating structural changes within the adsorbate layer as will be discussed in detail below. The initial spectrum recorded 42 s after the inflow of NAC (0.6 mM) over the gold-coated Ge-IRE is depicted as the boldface solid line in Figure 2. This spectrum serves as the reference for the initial state of the NAC on the surface, reflecting mainly the gold-NAC interaction. At higher coverage, intermolecular interactions between adsorbed molecules become increasingly important.
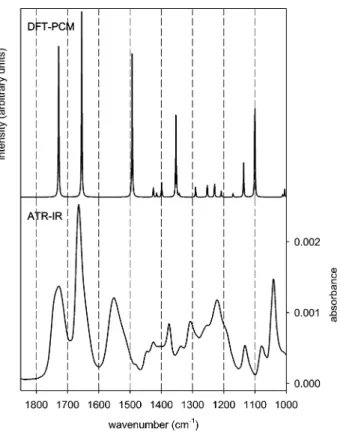
To assess the orientation of NAC adsorbed on the Au surface, an ATR-IR spectrum of the dissolved or liquid sample is needed. This allows a comparison with the calculated spectrum and yields experimental values for relative band intensities of the randomly oriented molecule. For this purpose, an EtOH versus EtOH + NAC modulation experiment was performed over the bare Ge-IRE. The measured phase-resolved spectrum is depicted in the lower half in Figure 3. The most prominent NAC bands are visible at 1729, 1665, and 1551 cm-1, respectively, together with less intense signals at 1375, 1221, and 1043 cm-1. The calculated IR spectrum of NAC is presented in the upper half in Figure 3. The calculated IR spectrum reveals intense signals at 1729, 1655, and 1494 cm-1with less intense signals at 1353, 1136, and 1100 cm-1. The overall agreement between the RRβ)
(
cos(β) sin(β) sin(R) sin(β) cos(R)
0 cos(R) -sin (R)
-sin(β) cos(β) sin(R) cos(β) cos(R)
)
(2)
Figure 2. Time-resolved ATR-IR spectra recorded in situ during the
NAC self-assembling process on the gold-coated Ge-IRE. The boldface solid line refers to the first spectrum recorded 43 s after the inflow of dissolved NAC (0.6 mM) at 0.18 mL/min. Subsequent spectra are recorded in a time interval of∼12 min.
I(ν) )
∑
i)1 N µz,i 2γ π 1 (ν - νcalc,i) 2+ γ2 (3)solution (1:2 H2O2(30%)/H2SO4, heated at 120 °C) during 5 min. The crystals were then thoroughly rinsed with Milli-Q water for 5 min and dried in a stream of argon.
Safety note: Piranha solution is extremely aggressiVe and should be handled with care!
QCM Measurements. Each of the QCM measurements started with a flow of solvent (EtOH) over the QCM crystal surface. After a stable frequency baseline was reached (after ∼1 h), NAC in solution (0.6 mM) was injected into the axial flow cell and the frequency response during the adsorption process was followed in situ with a 10-s gate time, resulting in a final frequency resolution of 0.01 Hz.
Density Functional Theory (DFT) Calculations of NAC. To better understand the structure of NAC and to assign the measured vibrational spectrum, DFT calculations were per-formed using the hybrid functional B3PW9126,27with a 6-31G basis set.28To account for solvent (EtOH) effects, a polarizable continuum model29 was used and all calculations were per-formed with NAC in neutral form, as this prevails in EtOH. The calculations were performed on GAUSSIAN03.30 The conformation with lowest energy that was found is depicted in Figure 1. A characteristic of this lowest energy conformation is a hydrogen bond between the amide and the carboxylic acid group.
Simulation of Infrared Spectra of Adsorbed Molecules. The determination of the orientation of a molecule on a surface relies on the fact that the intensity of a vibrational band depends on the angle between the corresponding transition dipole moment vector and the electric field vector. For metals, the electric field is polarized perpendicular to the surface, which leads to the metal surface selection rule.31The latter states that only vibrations associated with a transition dipole moment vector component perpendicular to the surface can be observed. This rule is generally applied for external reflection, but its validity for internal reflection has been demonstrated.32,33To simulate the influence of orientation on the infrared spectra, the transition dipole moment vector for each normal mode has to be determined in the (arbitrary defined) molecular coordinate system. For symmetric molecules, the direction of some transition dipole moment vectors can be determined by sym-metry considerations.34 Since NAC is not symmetric, the determination of the transition dipole moment vectors fully relies on quantum chemical calculations. After complete structure optimization, a normal-mode analysis was performed, yielding the transition dipole moment vectors for every normal mode of vibration. The vectors are represented in the molecular coor-dinate system with the coordinate axes pointing along the principal axes of inertia of the molecule. For simplicity, in the reference orientation, the molecular coordinate system coincides with the fixed surface coordinate system (x,y,z) with the x-y-plane defining the surface plane and the z-axis the surface normal. The coordinate systems are defined in Figure 1 for the reference orientation as a box around the molecule.
To simulate the impact of different orientations on the spectra, the molecular coordinate system was rotated around the x- and y-axis, respectively, of the surface coordinate system, by the rotation angles R and β, respectively. Mathematically, the rotation around R, followed by rotation around β is represented by the orthogonal transformation matrix
experimental and calculated spectra is good enough to allow an assignment of the most prominent NAC bands, which is given in Table 1.
The spectrum of dissolved NAC (as presented in the lower half in Figure 3) is compared to the spectrum of the adsorbed species in Figure 4 (the same spectrum as in Figure 2, solid line). As is obvious, significant differences in intensity of the prominent bands are visible, which strongly implies the presence
of an oriented adsorbate layer on the gold surface. Specifically, the intensity ratios of the amide I (1665 cm-1)/amide II (1551 cm-1) and amide II (1551 cm-1)/methyl (1375 cm-1) bands change significantly upon adsorption of NAC on gold. Other changes in band intensity between random orientation and surface orientation are visible for the band at 1045 cm-1, which loses intensity upon adsorption, and the spectral region between 1300 and 1200 cm-1. Apart from the described changes in relative band intensity, the frequency of most vibrational bands does not change much (see Table 1), which indicates that the structure of the dissolved and adsorbed molecule is similar.
An experimentally accessible parameter directly related to the orientation is the intensity ratio of two vibrational bands for random (solution) and surface orientation, as expressed by the following equation:34,36
where Im,ndenotes the measured integrated intensity of vibra-tional bands m and n, respectively, and the superscripts s and r, respectively, refer to surface and randomly oriented (dissolved) species, respectively. The determination of the orientation, as described in the following, relies on the comparison between experimental and calculated R values. The goal is to find a corresponding value Rcalc, analogously defined as Rexpin eq 4, for the calculated IR (randomly oriented molecules) and simulated ATR-IR (oriented molecules) spectra, using the orientation angles R andβ as adjustable parameters. In principle, two values of Rexp(i.e., two pairs of vibrations) are sufficient to determine the orientation angles R andβ. However, the amide I/amide II, amide I/ν(-COOH) and amide II/methyl pairs of
Figure 3. Top: Calculated IR spectrum of NAC. The spectrum was
obtained by convoluting the calculated IR intensities with a Lorentzian band shape (half-width at half maximum, 1 cm-1). The optimized structure of NAC found by DFT calculations (see text for details) is shown in Figure 1. Bottom: Demodulated ATR-IR spectrum of NAC dissolved in EtOH. The spectrum was obtained from an EtOH vs EtOH + NAC (0.03 M, flow rate 0.5 mL/min) modulation experiment using a modulation period T ) 120.4 s.
TABLE 1: Observed Vibrational Frequencies (in Wavenumbers/cm-1) of NAC Dissolved in EtOH and Adsorbed on Golda
labelb
dissolved NAC
adsorbed
NAC calculated assignment
A 1729 1727 1729 ν(-COOH) B 1665 1661 1655 amide I 1590 νas(-COO-) C 1551 1539/1560 (shifted) 1494 amide II 1400 νs(-COO-) D 1375 1375 1353 methyl +δ(-CH2) + δ(-COH) + ν(-CO) 1221 1294 δ(-COH) bending 1130 1136 δ(-COH) bending + δ(-CH2) twisting + ν(-CN) stretching E 1040 1042 1100 δ(-COH) bending + δ(-CH2) twisting + ν(-CN) stretching
aExperimental ATR-IR spectra of dissolved NAC and adsorbed on
gold are displayed in Figure 4. The calculated NAC vibrations are also given (see text for details). The calculated spectrum is presented in the upper half in Figure 3 and in Figure 6.bLabel used to denote
characteristic bands in the calculated spectra in Figures 5 and 6.
Figure 4. Top: ATR-IR spectrum of dissolved NAC obtained from a
modulation experiment (see also Figure 3, bottom). The spectrum corresponds to randomly oriented molecules. Bottom: ATR-IR spec-trum of NAC adsorbed on the gold-coated Ge-IRE (the same specspec-trum is depicted as the boldface solid line in Figure 2) recorded 43 s after the inflow of EtOH + NAC (0.6 mM) at 0.18 mL/min. Note that this spectrum corresponds to oriented molecules adsorbed on the surface.
Rexp)(Im
s
/Ins)
modes were considered. The amide I, amide II, and methyl vibrational bands of NAC are located within the N-acetyl part of the molecule, which is rather rigid and therefore serves as a pointer for the orientation analysis. It should be noted here that NAC, similar to N-acetyl-L-cysteine-N-methylamide,37is likely not completely rigid, at least in the liquid phase. However, the presence of a pointer fragment with well-defined transition dipole moments, for which the orientation on the surface can be well assessed, together with the assumption that the sulfur interacts with the gold surface, gives rather detailed information on the orientation of the whole molecule. It should also be noted that the angles that result from this analysis give an average value for the adsorbate layer. Furthermore, the described analysis assumes that the magnitudes of the transition dipole moment vectorsµ are the same in solution and in the monolayer.
In the reference orientation (Figure 1), the well-defined amide II transition dipole moment vector is oriented almost parallel to the x-y surface plane. The orientation of other prominent dipole moment vectors, i.e., the angles they define with respect to each other is helpful for the orientation analysis and calculated values are thus listed in Table 2.
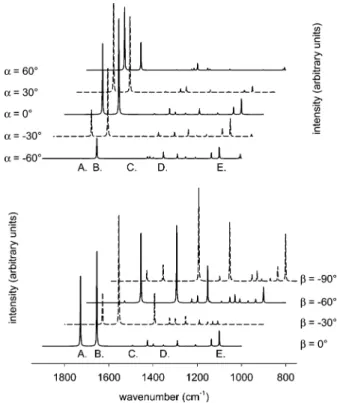
The effect of different orientation angles R and β on the calculated spectra is illustrated in Figure 5 for different orientation angles R in the upper half andβ in the lower half, respectively. Note that, while rotating around one orientation angle, the other was fixed at 0°. The reference orientation is the one depicted in Figure 1 with the corresponding angles R
) β ) 0°. For clarity, subsequent spectra are shifted to lower wavenumbers and capital letters indicate prominent calculated vibrational bands of NAC (see Table 1). The simulated spectra for different orientation angles R (upper half in Figure 5) reveal significant changes for the ν(-COOH) (A) and amide I (B) band. Less important changes are visible in the mode labeled E, which hasδ(-COH) bending, δ(-CH2) twisting, and ν(-CN) stretching character. As is obvious, the prominent amide II band (C) hardly appears in the simulated spectra for any orientation angle R, forβ ) 0°, because its transition dipole moment is almost parallel to the x-y plane of the surface coordinate system in this orientation (see Figure 1) and parallel to the long axis of the molecule. This finding, together with the experimental spectrum (Figure 4, lower part), strongly indicates that the long axis of the molecule is not oriented parallel to the surface. Changing the orientation angleβ (lower half in Figure 5) has a clear impact on the intensity of the amide II band (C). The latter continuously gains intensity with decreasing orientation angleβ, for R ) 0°, reaching a maximum when the long axis of the molecule is almost parallel to the surface normal z. Note that the methyl band (D) increases together with the amide II band since the two corresponding transition dipole moment vectors are oriented almost antiparallel with respect to each other (159.9°, see Table 2).
By changing the rotation angles R andβ in order to adjust
Rcalcto Rexp, an optimum agreement was found for R ) -72.5° andβ ) -37.5°. The corresponding simulated ATR-IR spec-trum together with the calculated IR specspec-trum (random orienta-tion) is displayed in Figure 6. The prominent vibrational bands
are again labeled with capital letters as summarized in Table 1. The changes in the relative ATR-IR intensities of the ν(-COOH), amide I, and amide II bands upon adsorption, as evident from the experimental spectra in Figure 4, are well reproduced by the simulations. Note that absolute peak heights are somewhat misleading when comparing the simulated (Figure 6) and experimental spectra (Figure 4), since the simulations assume a fixed line width, whereas not all the bands have the same widths in the experimental spectrum. This is important when comparing the relative intensity of the amide I and amide II bands. The intensity ratio of the amide II/methyl vibrational bands increased upon adsorption, which is in good agreement with the experimental results (see Figure 4), yet the amount of the increase is overestimated in the simulations. This overes-timation for the amide II/methyl modes may be explained by the coupling of the methyl mode to theδ(-COH) bending mode as it emerges from the normal-mode analysis. This mode is likely to be affected by the interactions of the OH group with the surface (see below), which are not considered in the applied analysis. Larger deviations are also visible for the mode E calculated at 1100 cm-1, which is clearly more pronounced in the experimental ATR-IR surface spectrum. The calculations revealed that the latter mode hasδ(-COH) bending, δ(-CH2) twisting, andν(-CN) stretching character and may thus also be affected by interactions of the C-O-H group with the surface. Noteworthy is the band at 1136 cm-1, which contains most of all CH2 twisting, but also COH bending character, according to the normal-mode analysis. Both in the experimental and in the simulated spectra, this band is observed for the randomly oriented sample but is basically absent for the oriented molecule.
Based on the simulations discussed above, we suggest an (average) orientation of NAC adsorbed on gold as is schemati-ν(-COOH) amide I amide II methyl
ν(-COOH) 0 47.8 76.3 107.7
amide I 0 117.6 75.9
amide II 0 159.9
methyl 0
Figure 5. Simulated infrared spectra of NAC for different orientations
of the molecule with respect to the metal surface (see Figure 1 for the reference orientation of the molecular and fixed surface coordinate system). Rotations were performed around the x- and y-axis corre-sponding to the orientation angles R and β. Note that while one orientation angle was changed, the other was fixed at 0°(see text for calculation method). Capital letters denote prominent vibrational bands of NAC as listed in Table 1.
TABLE 2: Calculated Angles in Degrees between Transition Dipole Moment Vectors for Prominent Normal Modes of Vibration of NAC
cally depicted in Figure 7. The pointer for the orientation of the molecule, the amide II transition dipole moment vector, now defines an angleγ ) 127.5°(i.e., a complementary angle of 52.5°) with respect to the surface normal z (see inset in Figure 7). It has to be pointed out that the value ofγ should be regarded as an estimate rather than a precise value, considering the assumptions inherent in the simulations. However, a character-istic of the elaborated orientation is the considerable tilt of the
N-acetyl (pointer) group with respect to the surface, which is clearly supported by the simulations. In addition, in this orientation, the carboxylic acid group of the molecule is in proximity to the surface, which implies interactions between carboxylic acid group and gold surface, as is indicated by the shift of theδ(-COH) band. The latter is found at 1221 cm-1 in solution and at 1294 cm-1 (broadened) on the surface (compare the spectra in Figure 4).38Hence, it shifts to higher wavenumbers upon adsorption. Note again that the proposed structure describes the initial stage of self-assembly.
Structural Changes within the N-Acetyl-L-cysteine
Mono-layer during Self-Assembling. The time-resolved ATR-IR spectra recorded during the self-assembling process of NAC on gold (Figure 2) reveal significant changes. Notably these are the shift of the ν(-COOH) band at 1727 cm-1 to lower wavenumbers, the growing intensity between the amide I and amide II bands, and the increasing band around 1400 cm-1. To emphasize these structural changes during the self-assembling process, the first and the last recorded spectra (∆T ) 1 h, Figure
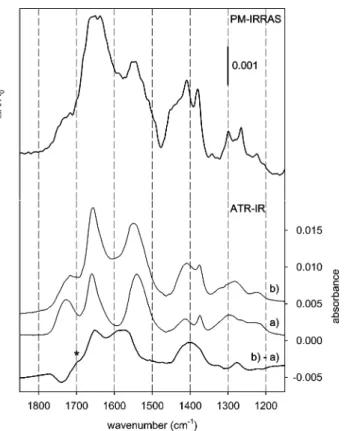
2) are again displayed in the lower half in Figure 8, labeled (a) and (b), respectively, together with the corresponding difference spectrum (b) - (a). Clearly, theν(-COOH) band shifts to lower frequency as evidenced by the negative band in the difference spectrum at 1740 cm-1and the positive shoulder (indicated with an asterisk) at∼1700 cm-1. This indicates that the CdO of the acid group is involved in an interaction. On the other hand, a broad intense feature around 1600 cm-1 with peaks at 1651, 1590, and 1560 cm-1 is apparent. The former peak is due to the gain in intensity of the amide I band which is also obvious
Figure 6. Comparison between calculated spectra of NAC for random
orientation (top) and oriented on the gold surface (bottom). The latter spectrum was calculated for the orientation angles R ) -72.5°andβ
) -37.5°that were found to best describe the experimentally obtained spectra (compare to the ATR-IR spectra depicted in Figure 4). Prominent vibrational bands of NAC are indicated with capital letters as summarized in Table 1.
Figure 7. Orientation of NAC on the gold surface (x-y plane) emerging from the orientation analysis. The corresponding IR spectrum is depicted in Figure 6, bottom. The orientation of the molecule is indicated by the angleγ ) 127.5°between the surface normal z and the amide II transition dipole moment vector (see inset). Note that the amide I transition dipole moment vector is oriented nearly parallel to the CdO bond.
Figure 8. Top: PM-IRRAS spectrum recorded ex situ after sample
immersion in a solution of NAC (7 mM) in EtOH for 24 h. Bottom: ATR-IR spectra obtained during the flow of EtOH + NAC (0.6 mM) over the gold-coated Ge-IRE. Spectrum a, recorded 43 s after admitting NAC, is representative for the adsorbate layer at the beginning of the self-assembling process, whereas spectrum b, recorded after 1 h, reveals structural changes within the adsorbate layer during the self-assembling process. To emphasize the structural changes a difference spectrum (b) - (a) is also presented as boldface solid line. The asterisk specifically denotes theν(-COOH) band shift to lower frequencies.
To learn more about the kinetics of the self-assembling process and the structural changes, the absorbance as a function of time of selected NAC vibrational bands is depicted in the upper half in Figure 9. A fast initial increase of the amide I signal is replaced by a considerably slower, almost linear increase after ∼90 min. In contrast, the ν(-COOH) signal behaves completely different with time. Shortly after the onset of the self-assembling process, the signal decreases in order to increase smoothly and almost linearly with time after∼30 min. The frequency shift as a function of time recorded during the adsorption of NAC on the surface of the QCM crystal is shown in the lower half in Figure 9. The frequency shifts rapidly and almost linearly with time during the initial step of self-assembling. After the abrupt onset, a distinctly slower shift in resonant frequency with time is observed. We should mention that the shape of the frequency shift curve was well reproducible on different days with different QCM sensor crystals. The slow-frequency shift was found to continue for hours and was after some time indistinguishable from overlapped baseline drifts.
In Figure 9, the response to the adsorption and self-assembling of NAC on gold is presented for two different measurement techniques, i.e., ATR-IR and QCM. For the former, the increase in intensity of a signal is not related to the net mass uptake only. Structural changes in a SAM, such as reorientation, intermolecular interactions, or protonation/deprotonation of adsorbed molecules may also affect the transition dipole moments (magnitude and orientation) and thus influence the intensity of vibrational bands. The shift in resonant frequency of a QCM resonator, on the other hand, depends on mass loading according to the Sauerbrey equation.42In liquid environment, however, frequency changes are influenced by the energy dissipation at the interface, which may be changing during SAM formation.43 In addition, viscous coupling of the oscillating crystal surface to the liquid medium results not only in a
Figure 9. Top: Time dependence of selected prominent NAC bands
obtained by ATR-IR when flowing NAC in solution (0.6 mM) over the gold-coated Ge-IRE (flow rate 0.18 mL/min). Bottom: Shift in resonant frequency recorded in situ during the adsorption of NAC (0.6 mM) on the QCM sensor crystals.
from the two spectra a and b. The band at 1590 cm-1 can be assigned to the νas(-COO-) vibration, whereas the band at 1560 cm-1 is consistent with an amide II mode, shifted due to hydrogen bonding.39In addition, two other positive bands appear in the difference spectrum, a broad intense signal at 1400 cm-1 and a less intense one at 1277 cm-1. The former band is assigned to the νs(-COO-) whereas the latter may be the δ(-COH) bending mode. In the upper half in Figure 8, a PM-IRRAS spectrum is shown recorded ex situ after 24 h of NAC self-assembling on a gold surface. The overall agreement to the ATR-IR spectrum recorded in situ after 1 h of self-assembling (trace b) is good; however, there are also significant differences. The amide I band has broadened significantly, and the amide II band at 1579 cm-1 appears as a small peak out of the pronounced νas(-COO-) band. Additionally, the νs(-COO-) band at 1400 cm-1 has further gained intensity with respect to the amide II band.
The spectral changes during self-assembly, as discussed above, give evidence for two kinds of slow structural changes within the adsorbate layer, besides further adsorption (increasing coverage). The shift of the ν(-COOH) band at 1727 cm-1 to lower wavenumbers indicates hydrogen bonding within the adsorbate layer. A feasible interaction is the hydrogen bonding between carboxylic acid groups of adjacent adsorbed molecules, i.e., dimerization as is found for carboxylic acids in solution.40 Dimerization of cysteine adsorbed on Au(110) via hydrogen bonding between carboxylic acid groups was proposed based on STM investigations.14 Another possibility would be the interaction between amide and acid groups of adjacent mol-ecules. The upward shift of the amide II band during the self-assembling would be consistent with such an interpretation, as the amide II vibrations shift to higher frequency upon hydrogen bonding involving the N-H part.39,41A shift of the amide II band may also be expected as a consequence of protonation/ deprotonation of the carboxylic acid. The DFT calculations, however, show that when the acid is deprotonated the amide II vibration shifts to lower wavenumbers, in contrast to observa-tion. Note that the orientation of the molecule in Figure 7 emerging from the orientation analysis is compatible with the proposed interaction modes since the position and orientation of the acid group easily allows for intermolecular interactions.
Another process occurring on the surface during self-assembling is the deprotonation of the acid group, which is evident from the increase of the νas(-COO-) band at 1590 cm-1 and the νs(-COO-) band at 1400 cm-1, respectively. In EtOH, NAC prevails in neutral form with the carboxylic acid groups being protonated, as is evident from the solution spectrum (Figure 4, top). The observed deprotonation is assisted by the interaction of the acid groups with the Au surface, which acts as a proton acceptor. The observed deprotonation process of NAC thus requires the vicinity of the acid group to the gold surface. In other words, the proposed initial orientation of the molecules on the surface (Figure 7) is favorable for both processes observed during self-assembling, namely, deproto-nation and intermolecular hydrogen bonding. As emerges from the differences between the PM-IRRAS spectrum (upper half in Figure 8) recorded ex situ after 24 h of self-assembling and the ATR-IR spectrum (trace b) recorded in situ after 1 h of self-assembling, the structural changes discussed above seem to continue for a long time. ATR-IR experiments where the flow of NAC was replaced by a flow of neat ethanol after 1 min also revealed the slow deprotonation, showing that the latter process is independent of further supply of NAC (increasing coverage).
this experiment, dissolved NAC and neat solvent (EtOH) were flowed alternately over the SAM (after 2 h of self-assembling). The experiment was repeated with different modulation periods, i.e., T ) 72.4, 120.7, 362.4, 483.2, and 604 s, respectively. The presented PSD spectrum (trace b) refers to a modulation period T ) 483.2 s and was obtained by evaluating eq 1 for a set of 60 time-resolved spectra. Only bands that are periodically changing with time due to the stimulation (concentration modulation) show up in this spectrum. During the first half-period of the modulation experiment, EtOH was flowed over the SAM and the signal at 1722 cm-1was observed to decrease. At the beginning of the second half-period, NAC in EtOH was introduced accompanied by a decrease of the band at 1590 cm-1 and a simultaneous increase of the signal at 1722 cm-1. The two bands mentioned thus reveal amplitudes of different sign in the PSD spectrum. Note that the signals are relatively small compared to the static spectrum (scale factor 20), indicating that only a small fraction of molecules contributes to the spectral response.
The appearance of the band at 1590 cm-1 may indicate a reversible protonation-deprotonation of the acid groups of part of the molecules within the adsorbate layer, stimulated by the concentration modulation. In addition, theν(-COOH) band at 1722 cm-1gives evidence that primarily the hydrogen-bonded species respond toward the stimulation. Possibly this signal is partly due to weakly bound (physisorbed) molecules. Phys-isorbed molecules were also evident for cysteine SAMs.46The demodulated spectrum, however, cannot only be explained by the appearance/disappearance of physisorbed species at the interface. The presence of weakly bound NAC leads to structural
Figure 10. Static ATR-IR spectrum recorded 1 h after the inflow (0.18
mL/min) of NAC in solution over the gold-coated Ge-IRE (trace a). A demodulated, i.e., phase-resolved spectrum for a concentration modula-tion experiment (T ) 483.2 s) is represented by trace b. In this experiment, EtOH and NAC dissolved in EtOH was allowed to flow (at 0.18 mL/min) alternately over the NAC SAM. Trace c refers to a demodulated spectrum of a “pH” modulation experiment (T ) 120.7 s) upon flowing alternately EtOH and EtOH + HCl (∼0.013 mM) at 0.5 mL/min over the SAM.
decrease in the resonant frequency but also in a damping of the resonant oscillation. The latter viscous loss is manifested as an increase in resonance resistance of the QCM resonator.44 However, besides the different complex processes occurring simultaneously, as indicated by the ATR-IR experiments, the measured shift in resonant frequency is still assumed to be a direct result of the self-assembling. This assumption was further confirmed by the absence of a sharp increase in resonance resistance during the SAM formation. According to the Sauer-brey relation42(with a mass sensitivity constant of 17.7 ng cm-2 Hz-1), a frequency shift of 6 Hz, reached at ∼2.5 h of adsorption, corresponds to a total mass uptake of 106.2 ng/cm2, which is equivalent to 3.9 × 10¹⁴NAC molecules/cm2 (neglect-ing trapped solvent molecules). This is less than one NAC molecule per three Au surface atoms. STM work on cysteine SAMs on gold showed that one molecule occupies three gold surface atoms.45Therefore, the QCM analysis indicates that there are no multilayers present under the applied conditions. However, it is noted that the numbers given above should be taken as an estimate due to the difficulties of quantitative QCM measurements in liquid phase, as just outlined.
Both ATR-IR and QCM provide a rather complex picture of the SAM formation. Within the NAC adsorbate layer, structural changes are mainly induced by three different processes, namely, the adsorption, i.e., bare mass uptake, the deprotonation of the acid group upon interaction with the Au surface, and the changes in the hydrogen-bonding network. The initial fast increase in intensity of the amide I and the ν(-COOH) signal is mainly attributable to adsorption of molecules on the surface. The initial fast mass uptake is also reflected in the sharp shift in resonant frequency of the QCM sensor crystals. At later stages of self-assembly, i.e., at higher surface coverage, the different processes occurring simultaneously on the surface are more difficult to separate. What concerns the amide I signal the slight, almost linear increase in intensity after some time, is likely not only due to the adsorption process (mass uptake). In an experiment where the flow of NAC was replaced by neat ethanol, the amide I band continued to slightly increase, concomitant to the deprotonation process. This indicates a reorientation of the amide group when the molecule is deprotonated. In the case of the νas(-COO-) signal, the increase in intensity is primarily attributable to the formation of the deprotonated species on the surface. The ν(-COOH) signal at 1727 cm-1, which refers to the non-hydrogen-bonded species, shows the most complex behavior. The decrease in intensity of this signal shortly after the onset the self-assembling process reveals that the hydrogen-bonding or deprotonation processes dominate over the adsorp-tion, which in turn would result in an increase in intensity.
Induced Structural Changes within the N-Acetyl-L -cys-teine Self-Assembled Monolayer. Structural changes within the adsorbate layer upon concentration and acid stimuli were probed by modulation excitation ATR-IR spectroscopy (see Experimental Section). It was shown in a previous work that the structure of the molecules within the adsorbate layer can reversibly be changed by alternately flowing EtOH and EtOH
+ HCl over a glutathione SAM (acid stimuli).13 In addition, the presence of dissolved species at the SAM interface may have an impact on the structure of the latter. In Figure 10, we present the results of the modulation experiments described above. For clarity, a static spectrum of NAC recorded after 1 h of self-assembling on gold is displayed as a boldface solid line, trace a) in Figure 10. The curve labeled (b) refers to a phase-resolved (PSD) spectrum of the EtOH versus EtOH + NAC (0.6 mM) modulation experiment, scaled by a factor of 20. In
cm-1).
Trace c in Figure 10 shows a PSD spectrum of the EtOH versus EtOH + HCl modulation experiment (“pH” modulation, T ) 120.7 s). During the first half-period (inflow of EtOH over the SAM), the signal at 1747 cm-1 was observed to decrease with the band at 1581 cm-1 increasing simultaneously. The behavior of the bands was opposite during the second half-period of the modulation experiment (inflow of HCl in ethanol). The spectra thus indicate a protonation/deprotonation of the acid group of adsorbed NAC within the adsorbate layer. Interestingly, the position of theν(-COOH) signal (1747 cm-1) shows that mainly the not hydrogen-bonded species respond to the acid stimuli. The appearance of a pronounced amide I signal at 1653 cm-1 in the demodulated spectra indicates a reorientation of the amide group upon protonation/deprotonation of the car-boxylic acid group. Again, the overall signals in the demodulated spectra are relatively small compared to the signals in the static ATR-IR spectrum (note the scale factor 10), indicating that only a fraction of the molecules are involved in the observed process. Comparison between N-Acetyl-L-cysteine and Glutathione.
At this point, it is interesting to compare the behavior of NAC and glutathione (γ-Glu-Cys-Gly).13Both molecules contain cysteine as the main anchoring part to the gold surface. In both cases, the (partial) deprotonation of a carboxylic acid group is observed during self-assembling. Both molecules respond toward acid stimuli and toward the presence of physisorbed molecules with structural changes. For both systems, the carboxylic acid groups seem to have a significant effect on SAM formation, through both intermolecular interactions (in the case of glu-tathione possibly also intramolecular interactions) and interac-tions with the gold surface. A significant difference between the two systems is the kinetic of SAM formation as evidenced by QCM measurements. Glutathione also shows the initial fast frequency change. However, afterward, the frequency changes further for∼30 min, before reaching an almost constant value, in contrast to the observation made for NAC. A further important difference between the two systems concerns the ionic state-dependent conformation observed for glutathione but not for NAC. DFT calculations (neglecting the surface) have shown that the conformation of glutathione changes drastically upon changing the ionic state.13This is related to the observed “ion gating” phenomena for glutathione SAMs.10 In contrast, our calculation for NAC (neglecting the surface) does not reveal strong conformational changes upon protonation/deprotonation.
(1) Ulman, A. Chem. ReV. 1996, 96, 1533.
(2) Cotton, C.; Glidle, A.; Beamson, G.; Cooper, G. Langmuir 1998, 14, 5139.
(3) Boozer, C.; Ladd, J.; Chen, S. F.; Homola, J.; Jiang, S. Y. Anal. Chem. 2004, 76, 6967.
(4) Schreiber, F. J. Phys.: Condens. Matter 2004, 16, R881.
changes within the SAM. A similar observation was already reported for glutathione (γ-Glu-Cys-Gly) SAMs.13 These structural changes, besides protonation/deprotonation, are in-dicated for example by the band at 1535 cm-1, which falls in the amide II region. The latter band, together with (part of) the band of opposite sign at 1590 cm-1 may arise due to a shift of the amide II vibration, induced by a change in the hydrogen-bonding network. The following process may thus explain the observations during concentration modulation (although we note that other interpretations of the spectral changes may be possible): In the absence of physisorbed molecules (in ethanol), the carboxylic acids are involved in intermolecular hydrogen bonding, involving the N-H of the amide group. Upon admitting NAC, the physisorbed molecules compete for these intermolecular interactions among chemisorbed molecules, by acid dimer formation. Thus, the hydrogen bond involving the N-H group is broken (causing the shift of the amide II signal) and new hydrogen-bonding interactions (acid dimer formation) involving the acid groups of one chemisorbed and one phys-isorbed molecule are established (causing the band at 1722
The relative simple structure of NAC, compared to glutathione, furthermore allows the determination of its orientation on the surface, which is much more difficult for glutathione. Conclusions
The self-assembling of NAC on gold was studied by IR spectroscopy and QCM. Both the kinetics of the self-assembling and the resulting structure of the adsorbate layer are quite complex. QCM and in situ IR spectroscopy reveal very fast initial adsorption from ethanol, followed, after ∼1 min, by a considerably slower mass uptake. After the initial adsorption step, two processes are observed simultaneously to the further slow increase in coverage. On one hand, a fraction of the molecules undergo deprotonation of the carboxylic acid group, the gold surface serving as the proton acceptor. On the other hand, frequency shifts of the ν(-COOH) and amide II bands indicate hydrogen-bonding interactions within the SAM, pos-sibly between the acid and the amide groups of adjacent molecules.
The spectrum recorded after the initial fast adsorption, which does not indicate deprotonation, was used to determine the orientation of the molecule. The analysis was based on transition dipole moment vectors determined by density functional theory and the fact that only the projection of the transition dipole moment vectors on the metal surface normal gives rise to IR intensity for the adsorbed molecules. The orientation analysis showed that the amide group is tilted with respect to the surface. In such an orientation, and assuming that the sulfur binds to the gold, the carboxylic acid group is in proximity to the surface. This is furthermore supported by a shift of the C-O-H bending vibration upon adsorption. This initial adsorption orientation favors both the deprotonation of the carboxylic acid and intermolecular interactions, as observed in the later stage of self-assembling.
Concentration and acid stimuli lead to spectral responses attributable to a reversible protonation/deprotonation of the acid groups of the molecules. However, even for the stimulation with a strong acid (HCl), only a fraction of the adsorbed molecules responded to the stimulation. Also, the two stimuli addressed different molecules on the surface, as is obvious from the different positions of the ν(-COOH) signals in the two corresponding modulation experiments. The physisorption of NAC at the SAM leads to a considerable rearrangement of the hydrogen-bonding network within the SAM, as the physisorbed molecules compete for intermolecular interactions among chemisorbed species. Both concentration and acid stimuli lead to reorientation of the adsorbed molecules, driven by the primarily induced responses (protonation/deprotonation, change of intermolecular interactions).
Acknowledgment. Financial support by the Swiss National Science Foundation and grants of computer time from the Swiss National Supercomputer Centre (CSCS) are kindly acknowl-edged. Use of sputtering facilities at the Swiss Center for Electronics and Microtechnology (CSEM) in Neuchaˆtel is kindly acknowledged.
107, 1151.
(6) Zhang, J.; Chi, Q.; Nielsen, J. U.; Friis, E. P.; Andersen, J. E. T.; Ulstrup, J. Langmuir 2000, 16, 7229.
(7) Dakkouri, A. S.; Kolb, D. M.; EdelsteinShima, R.; Mandler, D. Langmuir 1996, 12, 2849.
(8) Takehara, K.; Aihara, M.; Ueda, N. Electroanalysis 1994, 6, 1083. (9) Zhou, A.; Xie, Q.; Wu, Y.; Cai, Y.; Nie, L.; Yao, S. J. Colloid Interface Sci. 2000, 229, 12.
(10) Hepel, M.; Tewksbury, E. J. Electroanal. Chem. 2003, 552, 291. (11) Fang, C.; Zhou, X. Electroanalysis 2003, 15, 1632.
(12) Bieri, M.; Bu¨rgi, T. J. Phys. Chem. B 2005, 109, 10243. (13) Bieri, M.; Bu¨rgi, T. Langmuir 2005, 21, 1354.
(14) Ku¨hnle, A.; Linderoth, T. R.; Hammer, B.; Besenbacher, F. Nature
2002, 415, 891.
(15) Zheng, B. Z.; Ding, X. G.; Zhao, F. Q.; Yang, Y. X. Anal. Lett.
2002, 35, 2245.
(16) Aihara, M.; Tanaka, F.; Miyazaki, Y.; Takehara, K. Anal. Lett. 2002, 35, 759.
(17) Gaigalas, A. K.; Ruzgas, T. J. J. Electroanal. Chem. 1999, 465, 96.
(18) Ruzgas, T.; Wong, L.; Gaigalas, A. K.; Vilker, V. L. Langmuir
1998, 14, 7298.
(19) Cooper, J. M.; Greenough, K. R.; McNeil, C. J. J. Electroanal. Chem. 1993, 347, 267.
(20) Harrick, N. J. Internal Reflection Spectroscopy; Interscience Publishers: New York, 1967.
(21) Urakawa, A.; Wirz, R.; Bu¨rgi, T.; Baiker, A. J. Phys. Chem. B
2003, 107, 13061.
(22) Bu¨rgi, T.; Baiker, A. J. Phys. Chem. B 2002, 106, 10649. (23) Baurecht, D.; Fringeli, U. P. ReV. Sci. Instrum. 2001, 72, 3782. (24) Dabros, T.; van de Ven, T. G. M. Colloid Polym. Sci. 1983, 261, 694.
(25) Dabros, T.; van de Ven, T. G. M. Phys. Chem. Hydrodyn. 1987, 8, 161.
(26) Becke, A. D. J. Chem. Phys. 1993, 98, 5648.
(27) Perdew, J. P.; Chevary, J. A.; Vosko, S. H.; Jackson, K. A.; Pederson, M. R.; Singh, D. J.; Fiolhais, C. Phys. ReV. B 1992, 46, 6671. (28) Ditchfield, R.; Hehre, W. J.; Pople, J. A. J. Chem. Phys. 1971, 54, 724.
(29) Cance`s, M. T.; Mennucci, B.; Tomasi, J. J. Chem. Phys. 1997, 107, 3032.
(30) Frisch, M. J.; Trucks, G. W.; Schlegel, H. B.; Scuseria, G. E.; Robb, M. A.; Cheeseman, J. R.; Montgomery, J. A.; Vreven, T.; Kudin, K. N.; Burant, J. C.; Millam, J. M.; Iyengar, S. S.; Tomasi, J.; Barone, V.; Mennucci, B.; Cossi, M.; Scalmani, G.; Rega, N.; Petersson, G. A.; Nakatsuji, H.; Hada, M.; Ehara, M.; Toyota, K.; Fukuda, R.; Hasegawa, J.; Ishida, M.; Nakajima, T.; Honda, Y.; Kitao, O.; Nakai, H.; Klene, M.; Li, X.; Knox, J. E.; Hratchian, H. P.; Cross, J. B.; Adamo, C.; Jaramillo, J.; Gomperts, R.; Stratmann, R. E.; Yazyev, O.; Austin, A. J.; Cammi, R.; Pomelli, C.; Ochterski, J. W.; Ayala, P. Y.; Morokuma, K.; Voth, G. A.; Salvador, P.; Dannenberg, J. J.; Zakrzewski, V. G.; Dapprich, S.; Daniels, A. D.; Strain, M. C.; Farkas, O.; Malick, D. K.; Rabuck, A. D.; Raghavachari, K.; Foresman, J. B.; Ortiz, J. V.; Cui, Q.; Baboul, A. G.; Clifford, S.; Cioslowski, J.; Stefanov, B. B.; Liu, G.; Liashenko, A.; Piskorz, P.; Komaromi, I.; Martin, R. L.; Fox, D. J.; Keith, T.; Al-Laham, M. A.; Peng, C. Y.; Nanayakkara, A.; Challacombe, M.; Gill, P. M. W.; Johnson, B.; Chen, W.; Wong, M. W.; Gonzalez, C.; Pople, J. A. GAUSSIAN03; Rev. C.01 ed.; Gaussian, Inc.: Wallingford, CT, 2003.
(31) Greenler, R. G. J. Chem. Phys. 1966, 44, 310.
(32) Osawa, M.; Ataka, K.-I.; Yoshii, K.; Yotsuyanagi, T. J. Electron Spectrosc. Relat. Phenom. 1993, 64/65, 371.
(33) Hutter, E.; Assiongbon, K. A.; Fendler, J. H.; Roy, D. J. Phys. Chem. B 2003, 107, 7812.
(34) Street, S. C.; Gellman, A. J. J. Phys. Chem. B 1997, 101, 1389. (35) Shinohara, H.; Kasahara, T.; Kadokura, K.; Uryu, Y.; Itoh, K. J. Phys. Chem. B 2004, 108, 3584.
(36) Street, S. C.; Gellman, A. J. J. Chem. Phys. 1996, 105, 7158. (37) Bombasaro, J. A.; Zamora, M. A.; Baldoni, H. A.; Enriz, R. D. J. Phys. Chem. A 2005, 109, 874.
(38) Pearson, J. F.; Slifkin, M. A. Spectrochim. Acta 1972, 28A, 2408. (39) Clegg, R. S.; Hutchinson, J. E. Langmuir 1996, 12, 5239. (40) Ferri, D.; Bu¨rgi, T.; Baiker, A. J. Chem. Soc., Perkin Trans. 2 1999, 1305.
(41) Wirz, R.; Bu¨rgi, T.; Baiker, A. Langmuir 2003, 19, 785. (42) Sauerbrey, G. Z. Phys. 1959, 155, 206.
(43) Karpovich, D. S.; Blanchard, G. J. Langmuir 1994, 10, 3315. (44) Kanazawa, K. K.; Gordon, J., II. Anal. Chem. 1985, 57, 1770. (45) Dodero, G.; De Michieli, L.; Cavalleri, O.; Rolandi, R.; Oliveri, L.; Dacca`, A.; Parodi, R. Colloids Surf., A 2000, 175, 121.
(46) Marti, E. M.; Methivier, C.; Pradier, C. M. Langmuir 2004, 20, 10223.