BALLISTOCARDIOGRAPHIC EXPERIMENTS INTO SOME PROBLEMS OF ANAESTHESIA
BY W. HUGIN
Department of Anaesthesia, University Surgical Clinic, Basel, Switzerland
SUMMARY
The theory and application of the quantitative ballistocardiograph is described using the method of Klensch. It is possible to use this method for determining the stroke volume of the heart during anaesthesia simply and rapidly without affecting the circu-lation. Evidence was obtained showing that halothane may cause direct myocardial depression in some patients. Despite reduction in circulatory resistance a reduction in heart output was observed more frequently than expected. It was demonstrated also that the behaviour of the peripheral circulatory resistance is an important factor in determining stroke volume and results of measurements under the effect of different anaesthetics, ganglionic blockers and vasoconstrictors are presented.
During the first trials of halothane as an anaes-thetic agent it was discovered that, along with a decrease in the pulse rate as one of its out-standing characteristics a decrease in blood pressure occurs which runs approximately parallel with the depth of anaesthesia. This hypotension can be quickly reversed by reducing the concen-tration of halothane in the inspired air. Ganglion blockade comes into question as the cause, for which Raventos (1956) has found some evidence, although he was able to show that the superior cervical ganglion is only slightly affected. Raventos accordingly assumes an interruption of sympa-thetic transmission, particularly active in the abdominal region.
A further cause of hypotension is the pro-nounced dilatation of the blood vessels of the skin which occurs during halothane anaesthesia. It is one of the typical signs of such anaesthesia that the skin is dry, uniformly pink and diffusely warm and that veins which were previously hardly visible become filled and prominent. Burn (1959) suggests an anti-adrenaline vasodilatation. However, the fact that pronounced hyperaemia of the skin without pronounced hypotension occurs with other anaesthetics, suggests the existence in halothane of other hypotensive mechanisms. For example, congestion of the skin occurs during ether anaesthesia as strongly as with halothane
but there is no great fall of blood pressure; on the contrary the arterial pressure is sometimes raised. It is known that the cardiac output in ether anaesthesia can be significantly increased. One can perhaps explain the lack of hypotension in ether anaesthesia by a compensation through increased heart minute volume, a mechanism which does not occur in halothane anaesthesia.
Johnstone's view (1956) that there is a mainly sympathetic blockade does not explain the phe-nomenon fully. The dryness of the skin, its reddening and warming, conform to this theory and even the bradycardia, but the typical depres-sion of salivation and bronchial secretion and the bronchial dilatation do not fall into this theory. One must suppose with Brennan, Hunter and Johnstone (1957) that there is a special and isolated activation of the cardiovascular parasym-pathetic as the cause of the hypotension.
A further explanation, namely hypotension resulting from a decrease in cardiac output, is postulated by Burn and his colleagues (1957), on the grounds of their experiments on the dog heart-lung preparation. These authors were unable to demonstrate any strong ganglion blocking action of halothane although it was able, according to their experiments, to intensify ganglion block by hexamethonium. Enderby (1960) found in man further evidence against the theory of ganglion 696
blockade as the principal cause of hypotension, although he could demonstrate the potentiating action of halothane upon ganglion blockers. He concludes from his observations that the hypoten-sion of deep halothane anaesthesia is explainable by a direct myocardial toxic action. The depression of the blood pressure and the considerable reduc-tion in pulse rate by halothane could be related to a depressive action upon the myocardium.
The results of experiments upon the heart-lung preparation must be regarded with the greatest caution. The question can only be settled by measurements on humans and for this is needed knowledge of the stroke volume, the blood pres-sure and the pulse frequency from which the heart minute volume and the circulatory resistance can be calculated. The quantitative ballistocardio-graphic test is particularly suitable because it can be carried out with little trouble during an operation list and it gives reliable results.
TECHNIQUE
We used a tension-free elongation ballistocardio-graph which works on Newton's principle and provides qualitative and especially quantitative curves which can be evaluated. The registered curves represent not forces but shifts in the centre of gravity of the blood in the body, occurring as a result of the action of the heart.
The test apparatus invented by Klensch (Klensch and Eger, 1956; Eger and Klensch, 1956), which is made by the firm of Schwarzer of Munich, consists of a fixed box-like chassis or frame to which horizontally moving springs are attached. On these springs lies a board of 190 x 70 cm which swings without friction in one plane and only in one direction. The patient lying on the board sets it in motion through his heart action. The movements of the board, which only extend to fractions of a millimetre, are transmit-ted and magnified by an induction current trans-mitted to an electrocardiograph. A pulse-like curve corresponding to the movement of blood in the aorta is obtained.
As mentioned above the elongation ballisto-cardiograph follows Newton's law about the behaviour of the total centre of gravity when the partial centre of gravity is altered in a closed system. This principle applied to the patient lying without any frictional hindrance can be
used in measuring the stroke volume: when a certain amount of blood is forced out of the heart into the ascending aorta the total mass of the patient must move caudally in order to preserve the total centre of gravity of the system. This shift caudally (patient + board) is directly de-pendent upon the amount of blood so forced out. The greater the amount of blood forced out, the greater is the shift of the total mass in the opposite direction. As the blood traverses the ascending aorta and reaches the descending aorta then the total mass shifts in the opposite direc-tion, that is, cranially. This course of events can be expressed by the formula:
m.x= -(M.y)
m = the partial mass which is displaced (in this case the ejected blood).
M = total mass of the moving system (board and patient).
y = displacement distance of the total system (in this case that of the board, as transmit-ted to the recording apparatus).
x = displacement distance of the part mass (in this case again the ejected Wood).
The negative sign means that the movement is opposite in direction.
When M, y and x are known, m can be calculated:
M.y m = — -x
As applied to the circulation this means that it is possible to calculate the amount of blood which the heart pumps into a blood vessel section when the total mass M and the displacement distance y are known, together with the displacement distance x through which the blood portion is driven out of the heart into the adjoining blood vessel section.
For determining the displacement distance x (of the blood m), two time points have to be fixed which demarcate the extreme limits in the blood displacement, that is, which show in the ballisto-cardiogram as the maximal segment.
It is best to start at the exact time point immediately before the blood is pumped from the ventricle (H in fig. 1). The second point is that of maximum change in the centre of gravity after the blood pumping has ended (J). Both points are obvious turning points in the elongation curve.
BRITISH JOURNAL OF ANAESTHESIA At the time point H the ventricle is filled to
a maximum and the blood vessel empty. At the time point J the ventricle is emptied to a maxi-mum and the blood vessel full. After J the ballistocardiographically indicated amount of blood, m, is mainly in the aorta and only for a minor part in the arterial periphery. The space between the centres of gravity of the blood portion m before and after the expulsion stroke as projected perpendicularly on the body axis is the displacement distance x. These have been mined experimentally by centre of gravity deter-minations on cadavers, on heart-aorta prepara-tions and on models. It can be stated without detail, that x is to a great extent proportional to body length, for example:
Body length (cm) x (cm) 170 140 190 12 9.9 13.41
This unit can now be introduced as a known factor in the formula as 1.
FIG. 1
Elongation ballistogram of a normal person, show-ing the measurement distances: Amplitude a,
pulse time, T, and diastolic time D. It is now possible to calculate the volume of blood ms which at the time J is pumped from the heart into the aorta. During systole venous blood returns to the heart. Assuming a steady rate of reflux of blood in the veins throughout the pulse cycle to be a good approximation, then
calculable "storage" volume (m) diastole time (D) total reflux (m8) total pulse time (T)
and ms=m. —
T and D are expressed in curve lengths in milli-metres. In the Newton formula introduction of these new terms gives
m.
M.y.T.
l.D (1)
This expresses the relation between masses. Transformation of the measurements in weight into volume requires the introduction of specific weight to the formula:
q=1.06 g.cnr3
M.y.T This becomes ms (stroke volume) =
Lq.D - • ( 2 ) Because reading is done after magnified record-ing, it is necessary to recalculate the curve seg-ment a into the board shift y. The magnification factor must be dealt with by introducing the standard relation into the formula:
curve segment (a) board shift (y)
or y= a.e
~E~ Substituting for y in (2) gives
M.a.e.T
m. (3)
l.q.E.D With appropriate dimensions
ms (stroke volume M(g).a(rnm).e(rnrn).T(rnm) (Vs) in ml) ~ l(mm).q(g.cm-3).E(mm).D(mm) The movement of the blood mass occurs momen-tarily and is independent of heart frequency; the registered height of the curve is directly propor-tional to the amount of blood thrown up.
This can be demonstrated with an eccentric weight which rotates on the board. The circular movement is then registered in a sinus curve, independent of the frequency of rotation. The weight of the rotating eccentric weight can be calculated from the curve height by Newton's axion and it is thereby demonstrable that the apparatus operates practically free from friction.
Damping of the board is done with oil, and its own frequency of under 0.3 cycles per sec prevents any resonance increase by superimposed heart frequencies.
The action of the right side of the heart and of the small (pulmonary) circulation have no appre-ciable influence upon the shape of the ballisto-cardiographic curve, for experimentally one finds the centre of gravity of both lungs to be at the same
level as that of the heart; blood from the right side of the heart goes across the long axis of the body and does not appear in the curves because only shifts along the long axis are registered. With the ballistocardiographic method, therefore, only blood forced out of the left heart is measured.
RESULTS OF EARLIER BALLISTOCARDIOGRAPHIC OBSERVATIONS
In an earlier article Klensch and associates (1957) were able to show in cases of aortic stenosis that the ballistocardiogram reveals centre of gravity shifts. As in aortic stenosis the lower blood vessel (the descending aorta) does not come into con-sideration, the curve is monophasic and shows only the H-I curve. This behaviour is understand-able if it is appreciated that the ballistocardiogram represents a differential curve arising from the two individual curves opposite to each other and not quite simultaneous (fig. 2). Curve I corres-ponds to the filling of the upper and curve II the filling of the lower blood vessel. In aortic stenosis curve II is rudimentary and, because of this, the J section is lacking or is only shown faintly. This case further demonstrates that shifts of blood in the small circulation do not show up in the ballistocardiogram: a corresponding curve seg-ment upwards is competely lacking.
FIG. 2
Construction of the ballistocardiogram as a differential curve.
The correctness of this theory was recently demonstrated in siblings who were affected with aortic stenosis (Hiigin, 1961a). After operation the curves took a normal course; the function of the descending aorta, which before operation was lacking, could now be demonstrated.
In cases of heart catheterization, comparisons with the Fick method yielded far reaching simi-larities. With these one has to go without data on oxygen consumption and oxygen content as between arterial and venous blood. The ballistocar-diographic registration takes place 1 to 3 minutes before and after the Fick determination. The values obtained are about 3 per cent lower (Klensch et al., 1959a).
The ballistic principle has the advantages over the Fick method of safety, speed and acceptability, even by seriously ill patients, for the taking of a ballistocardiogram only requires the patient to lie quietly on the board and to hold his breath for a few seconds.
Tests for cardiac output before operation for arteriovenous shunt yielded increases in stroke volume of 48-136 per cent of the normal (Klensch et al., 1959b). After operation the stroke volume sank to normal. Correspondingly a higher peripheral resistance was estimated after opera-tion whilst before operaopera-tion this was subnormal because of the shunt. These findings agree with those of Hamilton (1932) who showed that there is a law according to which a decrease in circula-tory resistance is accompanied by an increase in stroke volume in anaesthetized mammals. In one patient with arteriovenous shunt in whom the beat volume was measured by Fick's method and by ballistocardiography the two methods corres-ponded in their results.
EXPERIMENTS
After premedication with pethidine 1 mg/kg and 1-hyoscyamine (about 0.005 mg Bellafoline/kg) subcutaneously 1 hour before anaesthesia 9 patients were anaesthetized with halothane in air and three with halothane, nitrous oxide and oxygen. An EMO Inhaler was used. In no case was an intravenous barbiturate used. The ballisto-cardiogram was taken after the patient had been breathing a steady concentration of halothane for several minutes and after the depth of anaesthesia had been steady for some minutes according to clinical signs. In no case had excitement or arrhythmia occurred. Care was taken in intubated patients that a sufficient period of time had elapsed between the intubation and the ballistocardiogram. Apnoea for the curve writing was brought about
TABLE I
Circulatory data during halothane anaesthesia.
ase o. 5 8 12 16 28 31 36 39 41 42 45 47 Stroke volume in Be-fore ml Dur-ing anaes-thesia 124.0 41.6 64.8 42.1 70.9 66.7 81.0 50.0 64.6 88.5 99.8 37.4 thesia 126.5 47.6 84.8 38.6 52.5 "55.8 84.6 62.5 96.3 43.9 66.1 92.7 Pulse rate (average) Be-fore Dur-ing anaes-thesia 112 89 75 105 105 94 66 59 61 103 62 69 thesia 97 88 81 105 105 101 114 67 71 91 77 100 Minute volume 00 Be-fore Dur-ing anaes-thesia 13.9 3.7 4.9 4.4 7.4 6.3 5.3 2.9 3.9 9.1 6.2 2.6 thesia 12.3 4.2 6.9 4.0 5.5 5.6 9.6 4.2 6.8 4.0 5.1 9.3 Blood pressure (mm Be-fore Hg) Dur-ing anaes-thesia 140/70 150/90 110/50 145/95 140/75 125/75 125/80 110/65 117/77 160/88 115/80 110/85 thesia 110/50 95/65 95/70 130/90 100/60 97/77 75/55 97/57 95/66 110/87 102/85 95/75 Circulatory resistance (dyn.sec.cnr5) Be-fore Dur-ing anaes-thesia 650 2590 1310 2180 1160 1270 1550 2410 1990 1090 1260 3000 thesia 520 1530 960 2200 1165 1245 543 1470 950 1975 1470 730 Cardiac power (kgm/min) Be-fore Dur-ing anaes-thesia 19.85 6.03 5.33 7.18 15.82 8.57 7.40 3.45 5.14 15.35 8.23 3.45 thesia 13.40 4.57 7.75 5.99 5.98 6.62 8.50 4.40 7.45 5.36 6.40 10.75 Mntpc 24 years Stage III/I 58 years Stage III/I 15 years Stage III/I 42 years 3 % halothane 53 years 2% halothane 23 years 3 % halothane 21 years 2% halothane 43 years 2 % halothane + N2O + O2 32 years 3 % halothane 38 years 3 % halothane 19 years 3 % halothane + N2O + O2 3% halothane by controlled ventilation, that is by
hyperventila-tion with a slight intermittent positive pressure.* In agreement with other studies, it was found that there was a fall of the average blood pressure under halothane but it was only slight in the light surgical stage, on average about 20 mm Hg (table I). The pulse frequency fell in only two out of twelve patients (Nos. 5 and 42), in whom the original figures were unusually high (112/97 b.p.m. and 103/91 b.p.m.). (The blood pressure figures given in this paper are the average figures of many measurements taken in quick * The effects of artificial ventilation with positive pressure had been investigated in separate experiments in order to eliminate deceptive pictures. The stroke volume diminished appreciably so long as a positive pressure of 15 mm Hg or more was in use. As soon as this ventilation was stopped the stroke volume returned to its original amount in the course of about 10 seconds. This effect has not played any part in our ballistocardiograms because the pressure used was below 15 mm Hg. Furthermore, in all cases the height of the curve was constant—which confirmed that a positive-pressure effect had been avoided.
succession.) In the remainder of cases a moderate rise in heart frequency was seen.
The stroke volume showed no particular change. It sank in four patients but not drastically (Nos. 28, 31, 42 and 45). It rose in four cases (Nos. 12, 39, 41 and 47) and in the remaining four cases it remained almost unchanged. Only when the cardiac output and the circulatory resistance was calculated did substantial changes from the original normal values occur.
By cardiac power we understand the work per-formed in unit time.t This consists of the acceleration of a given volume of blood and above all the pumping of this volume at a particular pressure. The acceleration force amounts under normal conditions to about 1 per cent of the total force and is, even under abnormal conditions, so small that we did not take it into consideration. t The term "cardiac power" is used in the same sense, and has the same meaning, as the phrase "work of the heart", where units of time are understood to be involved.
The overwhelming proportion of the work of the heart lies in the creation of blood pressure or, in other words, in the overcoming of circulatory resistance. Therefore we should compare the car-diac work per minute to the product of stroke volume, pulse frequency and mean aortic pres-sure. The blood pressure was measured by the Riva-Rocci method on the upper arm. According to recent experiments this corresponds fairly exactly with the aortic pressure.
The circulatory resistance of the blood vessels equals the quotient of mean aortic pressure and time volume.
Five cases showed a rise in cardiac power, that is to say a definite increase of the output through increased minute volume and pressure height, with decreased peripheral resistance without exception (Hiigin, 1961b). In these cases both an increase in pulse frequency of about 20 beats per minute and also a rise in stroke volume of about 22 ml contributed to the rise in cardiac output. In seven of the twelve patients the cardiac power decreased (Nos. 5, 8, 16, 28, 31, 42 and 45). In two of these cases the peripheral
resistance fell while beat volume and pulse re-mained unchanged (Nos. 5 and 8). Here the "Weiterstellung" of the blood vessels demanded a smaller cardiac power in order to keep the peripheral circulation at a steady height.
In five of these patients the peripheral resis-tance did not change appreciably, that is the reduced stroke volume and the reduced blood pres-sure were direct consequences of a direct depres-sive action of the anaesthetic upon the myocar-dium.
In order to have a comparison it is of interest to know how the measurable data behave with other kinds of anaesthesia.
The most clear-cut data were obtained during; thiopentone anaesthesia with which a drastic fall of stroke volume occurred without exception (table II) (Hugin and Eger, 1961).
The pulse rate rose definitely but not enough to restore the initial minute volume. In spite of increasing peripheral resistance no rise in blood pressure followed, but sometimes a definite fall, which can only be explained by a direct depres-sive action of the anaesthetic upon the myocar-TABLE II
Quantitative ballistography with thiopentone anaesthesia.
Case N o . 3 J5 19 24 50
Initial control values. After 300 mg thiopentone 5%i.v.
Initial control values. After 250 mg thiopentone 5%i.v.
Initial control values. After 70 mg thiopentone 5%i.v.
] 1 minutes later under N2O
Initial control values. Under N2O + Suxamethonium drip. The same anaesthesia after 200 mg thiopentone i.v. 4 minutes after thiopentone
Initial control values. d-Tubocurarine, 25 mg followed by thiopentone 350 mg i.v. Stroke volume (ml) 62.8 32.8 65.1 22.5 41.2 17.0 43.2 49.8 30.8 20.1 27.5 67.7 75.1 Pulse rate (average) 73.5 95.0 53.2 56.8 64.2 85.8 69.8 77.3 46.6 49.0 65.2 95.5 117.2 Minute volume (!•) 4.62 3.11 3.46 1.28 2.64 1.46 3.01 3.85 1.43 0.99 1.70 6.47 8.81 Blood pressure (mm Hg) 110/70 100/80 130/90 85/65 105/60 105/70 90/50 115/80 110/80 125/85 120/90 120/90 115/85 Peripheral circulat'y resist. (dyn.sec. cm-5) 1560 3800 2545 4650 2500 4800 1865 2030 5325 8500 4700 1300 910 Cardiac power (kgm/min) 6.91 4.23 6.11 1.78 3.76 2.10 3.68 6.02 2.14 1.68 2.92 10.55 13.77 Notes 61.2 kg 33 years Duodenal ulcer 81.2 kg 54 years Inguinal hernia 50 kg 20 years Appendicitis 71.5 kg 51 years Inguinal hernia: 90.8 kg 31 years joint mobilization
dium. The considerable fall of the minute volume (by about a half) is apart from the cardiodepressive action of thiopentone, also explainable by an increase of the peripheral resistance. How impor-tant this factor may be is shown in the last case of table II (No. 50). d-Tubocurarine was given first and thiopentone injected when muscular relaxation began. Because of the slight ganglionic blockade, and possibly also because of a direct vasodilatation due to curare, the arterioles did not react to thiopentone. As a consequence the stroke volume increased. In this case the calculated rate of heart work also increased, mainly because the
pulse became faster.
These findings are in contradiction to the old view that the venous supply determined to a great extent the beat volume. The more venous blood that streams into the heart the greater the volume that must be ejected by the ventricle. In fact the measurements show that (in the absence of cardiac hypertrophy) the peripheral circulatory resistance is the deciding factor and not the venous
"offering" (as long as the venous backflow is the same or greater than the minute volume). In healthy non-anaesthetized men the stroke volume falls, according to Frank (1895), Hamilton (1932), Klensch et al. (1959b), and our own measure-ments, in direct dependence upon the raised peripheral circulatory resistance, as the following examples illustrate (tables III—VII).
When the circulatory resistance is decreased it is, on the other hand, to be expected that the stroke volume should increase—as the following experiments confirm (tables VIII-X).
The measurements show that with a reduced circulatory resistance it is possible to obtain a higher minute volume with a smaller cardiac power (table VIII). Also (table IX) the blood pressure may rise despite a reduced circula-tory resistance, if the cardiac power is increased through any cause. In any case the stroke volume becomes greater when the circulatory resistance is lower.
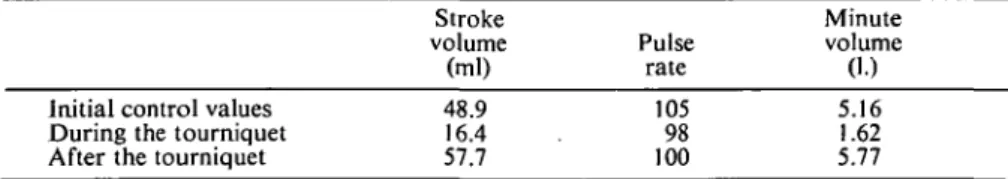
The same has been shown in connection with TABLE III
Raising of the peripheral circulatory resistance by applying a tourniquet to all four extremities.
Initial control values During the tourniquet After the tourniquet
Stroke volume (ml) 48.9 16.4 57.7 TABLE Raising of the peripheral circulatory resistance
Initial control values After 5 mg methoxamine i.v.
(70 kg body weight) Stroke volume (ml) 47.3 14 IV in a Pulse rate 62.5 33 TABLE V Raising of the peripheral circulatory resistance in
Initial control value After 2 units pituitrin i.v.
(70 kg body weight) Stroke volume (ml) 59.5 32.7 Pulse rate 72 59 Pulse rate 105 98 100 healthy man Minute volume (1.) 2.96 0.46 a healthy man Minute volume (1.) 4.28 J.93 Minute volume 0.) 5.16 1.62 5.77 by giving methoxamine. Circulatory Blood resistance pressure (dyn.sec. (mm Hg) cm~5) 100/50 2030 120/65 16100 by giving pituitrin. Circulatory Blood resistance pressure (dyn.sec. (mm Hg) cm~5) 110/50 1495 110/65 3630
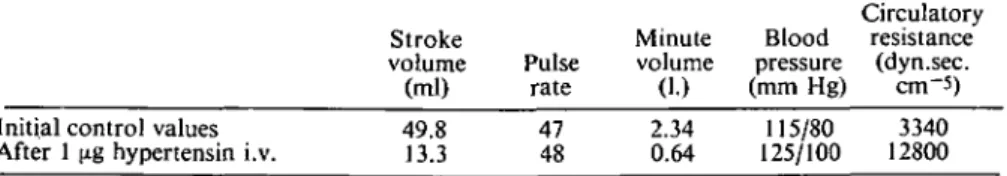
TABLE VI
Raising of the peripheral circulatory resistance by hvpertensin in a man in good condition during nitrous oxide anaesthesia.
Initial control values After 1 (ig hypertensin i.v.
Stroke volume (ml) 49.8 13.3 Pulse rate 47 48 Minute volume (1.) 2.34 0.64 TABLE VII
Raising of the peripheral circulatory resistance in a healthy man carbon dioxide in oxygen.
Initial control values 5 % CO2 in oxygen Stroke volume (ml) 51.9 40.1 Pulse rate 70 87 Minute volume (1.) 3.64 3.49 Blood pressure (mm Hg) 115/80 125/100 by breathing Blood pressure (mm Hg) 105/75 120/80 Circulatory resistance (dyn.sec. cm-5) 3340 12800 5 per cent Circulatory resistance (dyn.sec. cm-5) 1080 2290 TABLE VIII
Decrease of the peripheral circulatory resistance by peridural analgesia from the 9th thoracic segment caudally.
Stroke volume (ml) Initial control values 57 During analgesia 71
Pulse rate
94 87
Minute Blood Circulatory volume pressure resistance
(I.) (mm Hg) (dyn.sec.cm~5) 5.37 6.18 115/8080/50 1455 845 Cardiac power (kgm/min) 7.12 5.47 TABLE IX
Decrease of the peripheral circulatory resistance through spinal analgesia extending up to the 9th thoracic segment.
Stroke Minute Blood Circulatory Cardiac volume Pulse volume pressure resistance power
(ml) rate (1.) (mm Hg) (dyn.sec.cm~5) (kgm/min) Initial control values
During analgesia 64.545 5359 2.38 3.80 115/70125/65 3110 2000 3.00 4.90 TABLE X
Decrease of the peripheral circulatory resistance by trimetaphan during cyclopropane anaesthesia.
Initial control values during cyclopropane anaesthesia, stage HI/2
Same anaesthesia, after 50 mg trimetaphan i.v. Stroke volume (ml) 31.5 77.5 Pulse rate 80 100 Minute volume (1.) 2.52 7.75 Blood pressure (mm Hg) 175/100 145/95 Circulatory resistance (dyn.sec.cm~ 4530 1240 Cardiac power 5) (kgm/min) 4.88 12.65
thiopentone anaesthesia when arteriolar con-striction was prevented by d-tubocurarine, given about 1 minute before the intravenous barbi-turate. In that case the heart power increased too, mainly because of a higher pulse rate.
The reduction of the peripheral circulatory resistance by the ganglion blocker trimetaphan and the rise of stroke volume go together (but there also occurs a pronounced power increase as the pulse rate rises and simultaneously a relatively high blood pressure is maintained) (table X).
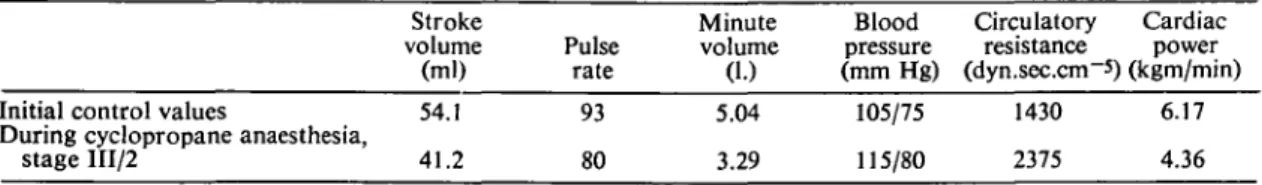
For comparison the results during cyclopro-pane anaesthesia are given; during this the peri-pheral resistance rose and the beat volume fell as was to be expected (table XI).
In this connection the question also arises about changes which occur if a vasopressor is given during halothane anaesthesia. Only a few of the available vasopressors can be combined with halothane, namely those which leave undisturbed
the irritability of the myocardium (methoxamine, hypertensin, octapressine).
Ballistocardiographic observations made of the effects of noradrenaline, hypertensin and metho-xamine when given during halothane anaesthesia, permit certain conclusions (tables XII-XIV).
CONCLUSIONS
With the ballistocardiographic method of Klensch it has become possible for the first time to deter-mine, under conditions of a surgical department, the stroke volume of the heart simply, rapidly, and without affecting the circulation. Knowledge of the stroke volume is the most important requirement for reckoning the cardiac power and peripheral circulatory resistance. It is clear that this method can be applied to research into the influence of anaesthesia upon the circulation and in this connection there is particular interest in the question as to the mechanism by which
halo-TABLE XI
Behaviour of circulatory parameters in cyclopropane anaesthesia.
Initial control values
During cyclopropane anaesthesia, stage III/2 Stroke volume (ml) 54.1 41.2 Pulse rate 93 80 TABLE Minute volume (1.) 5.04 3.29 XII Blood pressure (mm Hg) 105/75 115/80 Circulatory resistance (dyn.sec.cm~5) 1430 2375
Effect of noradrenaline administration during halothane anaesthesia.
Initial control values Under 2 vol. % halothane
anaesthesia
Same anaesthesia with about 1/75 mg/min noradrenaline Same anaesthesia 10 min after
stopping noradrenaline infusion
Stroke volume (ml) 64.5 96.3 47.9 62.5 Pulse rate 61.3 71.1 62.5 62.5 TABLE Minute volume (1.) 3.96 6.84 2.99 3.91 xni Blood pressure (mm Hg) 117.5/77.5 95/66.5 105/80 120/80 Peripheral circulatory resistance (dyn.sec.cm~5) 1975 947 2480 2050
Effect of hypertensin administration during halothane anaesthesia.
Initial control values under 2 vol. % halothane anaesthesia Same anaesthesia after \ jig
hypertensin i.v.
Same anaesthesia 15 min after hypertensin Stroke volume (ml) 49.8 30.6 19.3 Pulse rate 47 46.9 46.9 Minute volume (1.) 2.34 1.44 0.905 Blood pressure (mm Hg) 115/80 115/85 125/100 Circulatory resistance (dyn.sec.cm~5) 3340 5550 9950 Cardiac power (kgm/min) 6.17 4.36 Cardiac power (kgm/min) 5.24 7.51 3.75 5.32 Cardiac power (kgm/min) 3.1 1.96 1.38
Case No. 31:
Healthy man under 2 vol. % halothane anaesthesia Case No. 36:
Healthy man under 2 vol % halothane anaesthesia Case No. 47:
Healthy man under 2 vol % halothane anaesthesia Stroke volume (ml) Before methox-amine 55.8 87.7 92.7 During methox-amine 25.5 45.7 29.5 21.3 Pulse rate Before methox-amine 101.1 107.1 100.0 During methox-amine 89.2 92.5 94.4 98.7 Minute volume (1.) Before methox-amine 5.65 9.4 9.27 During methox-amine 2.27 4.23 2.79 2.11 Blood pressure (mm Hg) Before methox-amine 97.5/77.5 105/80 95/75 During methox-amine 110/90 120/95 115/100 120/105 Circulatory resistance (dyn.sec.cm-6) Before methox-amine 1240 789 735 During methox-amine 3530 2035 3085 4270 Cardiac power (kgm/min) Before methox-amine 6.72 11.8 10.7 During methox-amine 3.09 6.18 4.08 3.23 Notes 10 mg methox-amine i.v. 5 mg amine i.v. After 5 mg amine i.v. After another 5 mg i.v. 4 min la icr
thane causes hypotension. The slight ganglion blocking action of halothane was already known, also the vasodilatation, which partially explain the fall of blood pressure. A direct myocardio-depressive action was already demonstrated in animal experiments but their results could not be applied without reserve to humans. Clinical observations gave evidence of a direct reduction of cardiac power which has here found confir-mation by measurements and esticonfir-mations. It could not, however, be shown to occur in all cases; on the contrary, an increased cardiac power is also possible under halothane. In our small series of cases the blood pressure fell in all patients; this speaks for a predominance in the significance of the peripheral circulatory resistance, which in many cases is reduced directly through vasodila-tation and presumably only in small degree indirectly by ganglion blockade. Normally a fall of the peripheral circulatory resistance occurs with a strong increase of the beat volume and minute volume, whereby sometimes results a slight rise or a moderate fall of the cardiac power. These relationships can be shown by our ballistocardiograms to the exclusion of a narcotic effect. In halothane anaesthesia there was a re-duction of the heart output more often than expected when the regular reduction in the circulatory resistance is considered; the stroke volume does not increase in relation to the vaso-dilatation and both indicate that a myocardial depressant action is responsible for the hypo-tension in many cases. The fall of the peripheral circulatory resistance as such is an uncommon advantage, since a larger volume of blood is supplied by a smaller effort. It could also be shown that the behaviour of the peripheral cir-culatory resistance is a significant factor in the size of the stroke volume.
REFERENCES
Brennan, H. J., Hunter, A. R., and Johnstone, M. (1957). Halothane: a clinical assessment. Lancet,
2, 453.
Burn, J. H. (1959). Pharmacological testing of anaesth-thetics. Proc. roy. Soc. Med., 52, 2, 95.
Epstein, H. G., Feigan, G. A., and Paton, W. D. M. (1957). Fluothane: a report to the medical research council by the committee on non-explosive anaesthetic agents. Brit. med. J.,
2, 479.
Eger, W., and Klensch, H. (1956). Qualitative und quantitative ballistographische Untersuchungen am Modellkreislauf. Pfliigers Arch., 262, 443.
Enderby, G. E. H. (1960). Halothane and hypotension.
Anaesthesia, 15, 1, 25.
Frank, O. (1895). Zur Dynamik des Herzmuskels.
Z. Biol, 32, 370.
Hamilton, W. F. (1932). Some mechanisms involved in the regulation of the circulation. Amer. J.
Physiol., 102, 551.
Hugin, W. (1961a). Das ballistographische Bild vor und nach der Operation von Aorten-Isthmusstenosen.
Thoraxchirurgie, 8, No. 5, 563.
—— (1961b). Ballistographische Untersuchungen zur Fluothan-Narkose. Ada. chir. Scand., 28, 372.
Eger, W. (1961). Ballistographische Untersuch-ungen zur Frage der WiderstandanderUntersuch-ungen im peripheren Kreislauf durch Thiopentaloder Cyclo-propannarkose. Der Anaesthesist, 10, 46. Johnstone, M. (1956). The human cardiovascular
res-ponse to Fluothane anaesthesia. Brit. J. Anaesth., 28, 392.
Klensch, H., and Eger, W. (1956). Ein neues Verfahren der physikalischen Schlagvolumenbestimmung (Quantitative Ballistographie). Pfliigers Arch.,
263, 459.
Hohnen, H. W., Wolfers, H., and Wolfers, W. (1957). Die Diagnose der Aorten-Isthmus-Stenose aus dem Ballistogramm. Klin. Wschr., 35, 1039. Schaede, A., Thurn, P., Caspari, R., and Hilger, H. (1959a). Vergleichende Untersuchung des Minutenvolumens des Herzens mit der ballistis-chen und der direkten Ficksballistis-chen Methode.
Pfliigers Arch., 269, 232.
Hohnen, H. W., Richter, W. (1959b). Das Schlag-volumen des Herzens vor und nach Operation trausmatischer arteriovenoser Fisteln der unteren Extremitaten. Ztschr. f. Kreislauff., 48, 153. Ravent6s, J. (1956). The action of Fluothane—a new
volatile anaesthetic. Brit. J. Pharmacol., 11, 394. SOMMAIRE
Nous avons d£crit la meihode et le mode d'emploi du Ballistocardiographe quantitatif de Klensch. II sert a l'estimation rapide du volume systolique chez le sujet anesthesia ou sous Faction de differents produits in-fluencant la circulation. La question de Pinfluence depressive et directe de l'Halothan sur le Myocarde peut par la suite etre edaire'e. Mais ce qui est interes-sant en tout premier lieux est la ddpendance marquee du volume systolique par rapport a la resistance circu-latoire periphe'rique dans les vaisseaux. Les re'sultats obtenus par mensuration sous l'influence de differents anesthe'siques, gangliople'giques et vasoconstricteurs sont communique's.
ZUSAMMENFASSUNG
Die Arbeitsweise und Anwendung des quantitativen Ballistocardiographen von Klensch wird beschrieben. Er eignet sich zur schnellen Bestimmung des Schlag-volumens bei Menschen in Narkose oder unter der Wirkung verschiedener den Krieslauf beeinflussender Pharmaka. Die Frage einer direkten depressiven Wirkung von Halothan auf das Myocard konnte weiter geklart werden. Interessant ist aber vor allem die starke Abhangigkeit des Schlagvolumens von der peripheren Zirkulationsresistenz in den Gefassen. Die Messergeb-nisse unter der Wirkung von verschiedenen Narkose-mitteln, Ganglienblockern und Vasokonstriktoren werden mitgeteilL