Development of a Concentration-Enhanced Mobility Shift Assay Platform for
Aptamer-Based Biomarker Detection and Kinase Profiling
by Lih Feng Cheow
S.M., Massachusetts Institute of Technology (2009) B.S., Cornell University (2005)
Submitted to the Department of Electrical Engineering and Computer Science in Partial Fulfillment of the Requirements for the Degree of
Doctor of Philosophy at the
Massachusetts Institute of Technology February 2012
ARCHIVES
lMASSACHUSETS INST E OF TECHNOLOGYMAR 2 0
2012
L BRA RIES
C 2012 Massachusetts Institute of Technology. All rights reservedI ,
Signature of A uthor ...
Department of Electrical Engineering and Computer Science February 1, 2012
Certified by ... :..v... ... ongyoon Han Associate Professor of Electrical Engineering and Computer Science Associate Professor of Biological Engineering Thesis Supervisor
Accepted by ... ... .
7.
... ...s A. Kolodziej ski
Chairman, Department Committee on Graduate Students Department of Electrical Engineering and Computer Science
Development of a Concentration-Enhanced Mobility Shift Assay Platform for Aptamer-Based Biomarker Detection and Kinase Profiling
by Lih Feng Cheow
Submitted to the Department of Electrical Engineering and Computer Science on February 1, 2012 in Partial Fulfillment of the
Requirements for the Degree of Doctor of Philosophy in Electrical Engineering and Computer Science
ABSTRACT
New methods to quantify rare biomarkers from patient samples are critical for developing point-of-care diagnostic platforms. To be compatible with resource limited settings, these assays have to provide fast and accurate results without sacrificing ease of use. Biosensing in homogeneous fashion is the preferred format which satisfies these criteria, but the lack of amplification method is a bottleneck that limits their use for sensitive applications. To address this issue, this thesis explores physical signal amplification means to increase the sensitivities of homogeneous assays. We identified several key applications where the use of these technologies could make a positive impact in improving medical diagnostics systems and advancing biological research.
We first outline the use of electrokinetic concentration to realize a continuous signal amplification scheme that increases the sensitivity of homogeneous mobility shift assays. By simultaneously concentrating and separating reacted and unreacted species (with different mobilities) in this device, we can perform sensitive, quantitative and ratiometric measurement of target biomarkers. Using this platform, we improved the sensitivity of aptamer affinity probe capillary electrophoresis to achieve pM detection limit of IgE and HIV-RT in simple buffer and serum sample. This work is timely and impactful as it directly addresses the sensitivity shortcomings of using aptamers as low cost and robust substitutes for antibodies in point-of-care applications.
Next, we presented a herringbone nanofilter array device which can perform continuous size-selective concentration of biomolecules based on their direct interaction with nanostructures with comparable critical dimensions. We demonstrated the use of this platform to perform a novel homogeneous immunoassay for detecting a cardiac biomarker, C-reactive protein, at clinically relevant concentrations.
Finally, we demonstrated that the concentration-enhanced mobility shift assay platform is a powerful tool for probing biological activities such as cellular kinase activities. We have developed technology to isolate, grow and lyse single cells, and used our platform to measure kinase activities from single cells. Through rational design of peptide substrates and spacers, this platform has the ability to simultaneously concentrate and separate multiple analytes. This enables users to obtain simultaneous measurements of multiple cellular kinase activities that could reveal important information about their functional relationships.
Thesis Supervisor: Jongyoon Han
Title: Associate Professor of Electrical Engineering and Computer Science and Associate Professor of Biological Engineering
Acknowledgements
I have been very fortunate to be surrounded by many friends and mentors over the course of my graduate studies. This thesis is a milestone that would not have been possible without their support and guidance.
First of all, I would like to thank Professor Jongyoon Han for being a great advisor and mentor. I truly appreciate his insightful guidance into the field of micro-nanofluidics. He encouraged me by giving me the freedom to try new ideas and listening to and trusting my opinions. His tenacity and enthusiasm for science will be a constant inspiration to me. I would also like to thank my other thesis committee members, Professor Joel Voldman and Professor Jacquin Niles for their constructive inputs and ideas.
I am indebted to my fellow group members in the Han Lab, who have made my graduate school life a delightful experience. I would like to specially thank Aniruddh Sarkar and Hansen Bow, who are my collaborators in this thesis work. I would also like to thank other present and past group members: Yong-Ak Song, Sung Jae Kim, Hiong Yap Gan, Chia-Hung Chen, Rohat Melik, Leon Li, Rhokyun Kwak, Sha Huang, Lidan Wu, Vincent Liu, Reto Schoch, Jeong Hoon Lee and Masumi Yamada for their help and friendship. I have learned a lot from them in different ways over the years. In addition, I also thank the visiting students who have worked with me: Sung Hee Ko and Hyuk-Seong Seo.
I would like to thank A*STAR Singapore for its generous scholarship support. I must also thank the agents that supported my work, including the National Institute of Health (CA 119402), Singapore-MIT Alliance-II CE programme and the CDP center grant. I also thank the staff members at the Singapore-MIT Microsystems Technology Laboratories for their help in device fabrication.
Finally, I would like to express my deepest gratitude to my family for their unconditional love and support. Above all, I would like to thank my fiancee, Rui Zhen Tan, for her understanding, support, encouragement and love. I would like to dedicate this thesis to her.
Table of Contents
1. Introduction ... 13
1.1. Opportunities in micro/nano-fluidics for biomolecule analysis...13
1.2. New developments in biosensing ... 14
1.3. The issues of affinity capture agents ... 15
1.4. Signal amplification in homogeneous assays ... 17
1.5. Thesis outline and scope ... 18
1.6. R eferences ... 2 1 2. Concentration enhanced mobility shift assay platform for aptamer-based biomarker detection ... 2 4 2.1. Aptamers as affinity agents in diagnostic platforms...24
2.2. Electrokinetic concentration as a signal amplification module for aptamer affinity probe electrophoresis assay ... 27
2.3. Principle of the assay ... 30
2.4. E xperim ental section ... 33
2.4.1.Reagents and chemicals ... 33
2.4.2.Microchip fabrication ... 33
2.4.3.Microchip operation ... 34
2.4.4.Measurement instrument and image analysis ... 35
2.5. Optimization of assay ... 36
2.6. Detection of IgE and HIV-I RT from buffer ... 39
2.7. Detection of IgE from serum sample ... 44
2.8. Sum m ary ... 47
3. Differential concentration of biomolecules using herringbone nanofilter array ... 50
3.1. Nanostructures for biomolecular sieving ... 51
3.2. Size based concentration of biomolecules using herringbone nanofilter array...55
3.3. D evice fabrication ... 59
3.4. Concentration of short DNA molecules by Ogston sieving ... 60
3.5. Differential concentration of DNA-protein complex ... 62
3.6. Differential concentration of protein-protein complex ... 65
3.7. Differential concentration of antibody-antigen complex ... 68
3 .8. Sum m ary ... 73
3.9. R eferences ... 74
4. Multiplexed single cell kinase activity assay ... 76
4.1. Antibody based method vs direct activity measurement ... 78
4.2. Single cell kinase activity assay ... 78
4.3. Electrokinetic concentration enhanced kinase activity assay ... 80
4.4. Experim ental section ... 82
4.4.1 .Reagents and chemicals ... 82
4.4.2.M icrochip operations ... 83
4.4.3.Measurement instrument and image analysis ... 83
4.4.4.Recombinant kinase experiment ... 84
4.4.5.Substrate cross reactivity ... 87
4.4.6.C ell lysate experim ent ... 89
4.5. Multi-substrate separation ... 92
4.6. Single adherent cell culture ... 103
4.7. Single cell lysis and kinase reaction ... 104
4.8. Concentration enhanced single cell kinase activity assay ... 109
4 .10 . Sum m ary ... 118
4 .11. R eferences ... 119
5. C on clu sion ... 12 1 5.1. T hesis contribution ... 12 1 5.2. D irections for future w ork ... 123
5.2.1.Concentration enhanced mobility shift assay ... 123
5.2.2.Size-based concentration of biomolecules using herringbone nanofilter array ... 124
5.2.3.Multiplexed single cell biological activity assay ... 125
5 .3 . R eferences ... 126
Figure 2.1: Figure 2.2: Figure 2.3: Figure 2.4: Figure 2.5: Figure 2.6: Figure 2.7: Figure 2.8: Figure 3.1 Figure 3.2: Figure 3.3: Figure 3.4: Figure 3.5: Figure 3.6: Figure 3.7: Figure 3.8:
List of Figures
Structure of an aptamer ... 25Operating principle of the electrokinetic concentration enhanced aptamer affinity probe electrophoresis assay ... 32
Effect of BSA on detection sensitivity of IgE ... 38
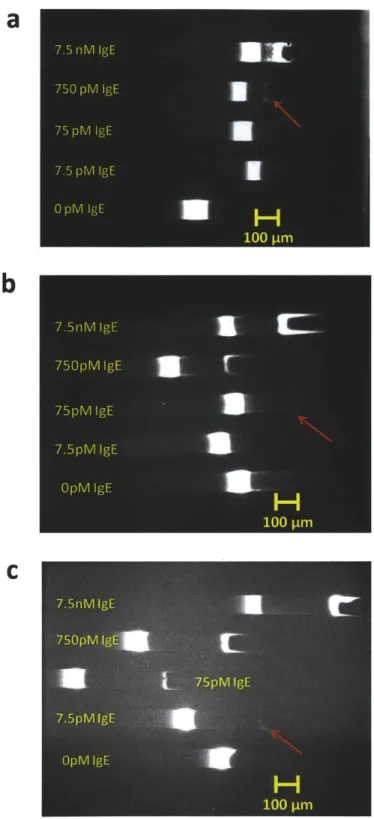
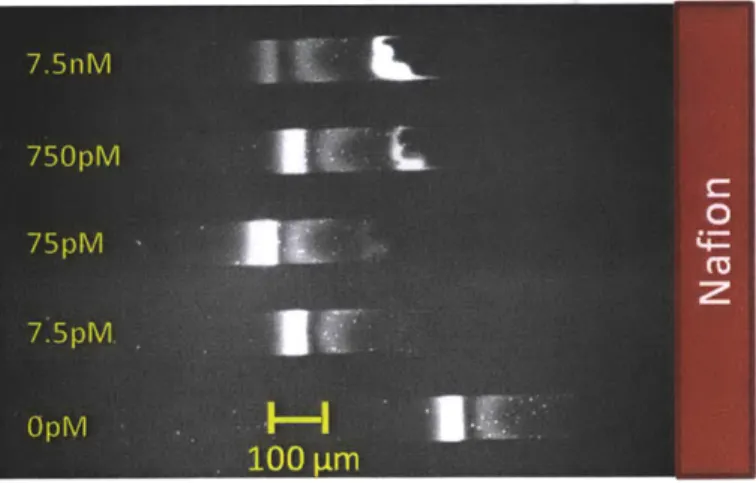
Experimental results for multiplexed concentration enhanced aptamer affinity probe electrophoresis assay for detection of IgE in buffer ... 41
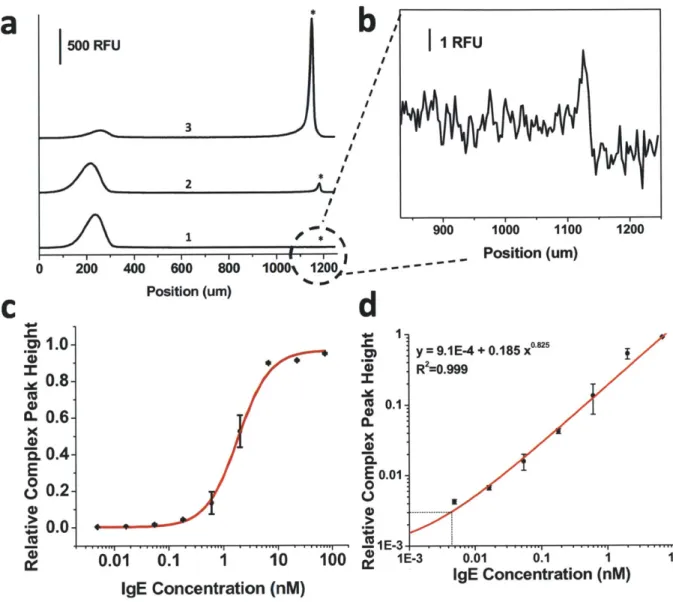
Electropherogram and dose response curve for detection of IgE in buffer ... 42
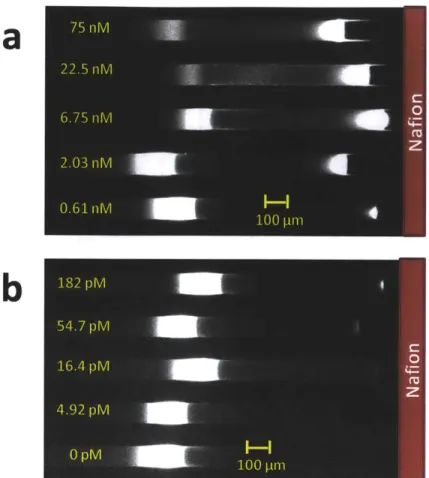
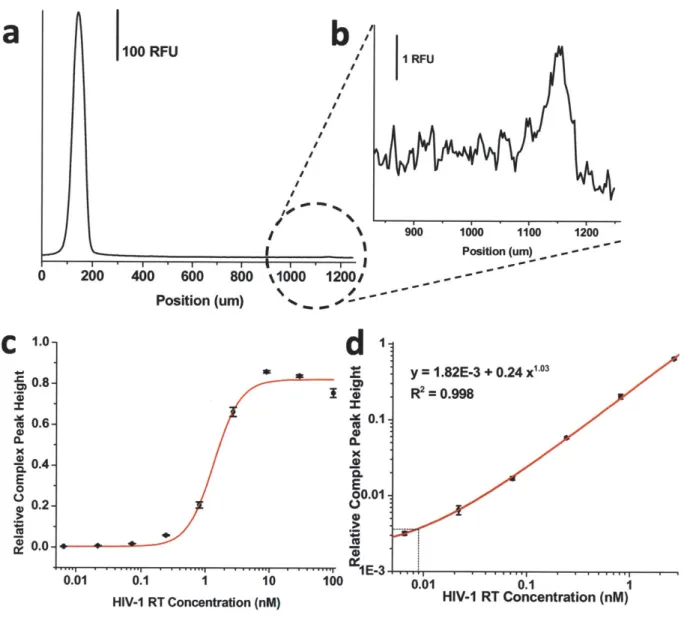
Electropherogram and dose response curve for detection of HIV-1 RT in buffer ... . . .. 4 3 Effect of serum on detection of IgE ... 44
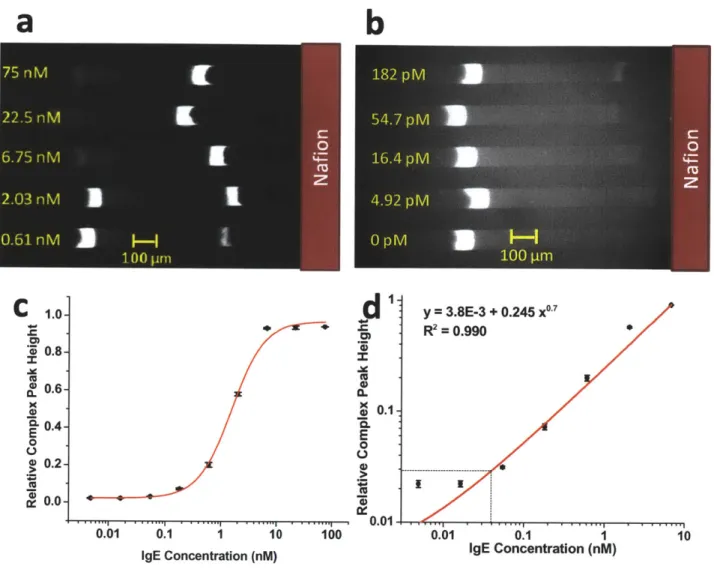
Experimental results and dose response curve for detection of IgE in serum ... 46
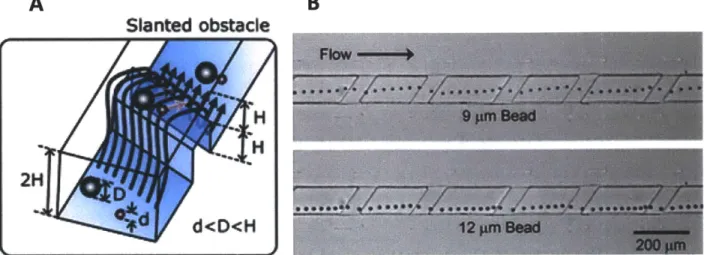
Hydrophoresis device for continous size based separation of particles ... 54
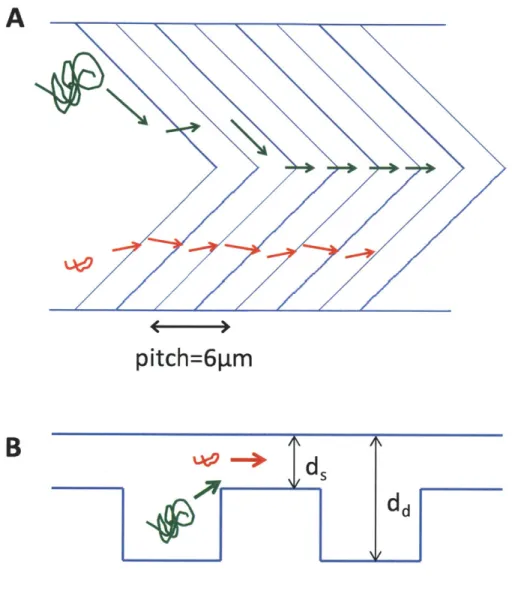
Schematic and cross section of herringbone nanofilter array ... 58
Fabrication process of the herringbone nanofilter array ... 59
Size based concentration of short double-stranded DNA in herringbone nanofilter array d ev ice ... 6 1 Size based concentration of DNA-protein complex in herringbone nanofilter array device ... 6 4 Size based concentration of protein-protein complex in herringbone nanofilter array d ev ice ... 6 6 Size based concentration of protein-protein complex in herringbone nanofilter array device under reversed electric field polarity ... 67 A homogeneous immunoassay for C-Reactive Protein using the herringbone nanofilter
Figure 3.9: Figure 4.1: Figure 4.2: Figure 4.3: Figure Figure Figure 4.4: 4.5: 4.6: Figure 4.7: Figure 4.8: Figure 4.9: Figure 4.10: Figure 4.11: Figure 4.12: Figure 4.13: array device ... 70 Dose response curve for detection of C-Reactive Protein using the herringbone nanofilter array ... 72 Diagram showing the cellular signal transduction network
... . . 77 Operating principle of the electrokinetic concentration enhanced kinase activity assay ... 8 1 Multiplexed electrokinetic concentration enhanced mobility shift assay for detection of recombinant AKT activity ... 85
Dose response curve for detection of recombinant MK2 and PKA activity ... 86 Pair-wise cross-reactivity between kinases and substrates ... 88 Detection of AKT and PKA activity in stimulated and unstimulated HepG2 cell lysates ... . . 9 1 Principle of electrofocusing and depletion zone isotachophoresis to simultaneously concentrate and separate two species ... 93 Strategy to simultaneously separate and concentrate multiple analytes by utilizing intermediate mobility spacer molecules ... 95 Creation of extended separation zone by ampholyte additives ... 97 Separation behavior of two kinase substrates with ampholyte additives
... 9 8 Complete separation of two kinase substrates and their products using ampholytes and MES as intermediate mobility spacer ... 99 Predicted mobility of kinase substrates and synthetic peptide spacers according to the O fford M odel ... 10 1 Simultaneous concentration and baseline separation of substrates and products
Figure 4.14: Figure 4.15: Figure 4.16: Figure 4.17: Figure 4.18: Figure 4.19: Figure 4.20:
corresponding to PKA, AKT and MK2 using rationally designed synthetic peptide sp acers ... 10 2 Complete process flow for the cell culture, lysis, reaction and fluidic transfer operations
... 10 7 Figure showing release of intracellular contents from adherent HepG2 cells after ultrasonic lysis ... 10 8
Detection of AKT activity from single HepG2 cell...110 MK2 activity vs cell number ... 112 Linear relationship between kinase activity and total cell volume ... 114 MK2 activity vs cell number after normalizing by the average cell volume, showing single cell sensitivity and resolution ... 115 Concentration-enhanced mobility shift assay for detection of multiple kinase activity from single cell ... 117
List of Tables
Chapter 1
Introduction
1.1 Opportunities in micro/nano-fluidics for biomolecule analysis
One of the most pressing issues in analytical chemistry is detecting low abundance analytes from complex samples such as blood, saliva and urine. Tests for low abundance biomarkers are routinely used for disease diagnostics, to monitor patient response during therapy, and to help detect recurrence following treatment. Therefore, there is significant clinical relevance to increase the sensitivity of these tests to facilitate early detection of the onset of diseases, since these biomarkers get diluted significantly in biofluids, especially in the early stages of disease progression.
The traditional workflow of biomarker analysis involves taking a sample from a patient, sending the sample to a laboratory where the analysis is performed with sophisticated equipments, and getting the results several days later. Several problems associated with this model are the need of good infrastructure for sample transport, possibility of sample deterioration during storage, and long turnaround time leading to patient anxiety. In order to address these problems, there has been tremendous interest in developing point-of-care diagnostic systems, which aims to bring medical testing to near patient care in the form of portable test kits. Commercial examples of point-of-care diagnostic systems include the over-the-counter pregnancy test strip, which uses lateral-flow-immunoassays to provide test results in minutes. However, these tests are usually qualitative and have limited sensitivities. At the same time, certain clinical applications, such as cancer diagnostics, requires assay sensitivities that are beyond the capabilities of existing point-of-care diagnostic devices. This calls for a new breed of technology that could perform more sophisticated operations to achieve better assay sensitivity and specificity.
An answer to this challenge is micro total analysis systems (pTAS), which aims at integrating multiple biological and chemical analyses in a single chip. Leveraging on the microfabrication techniques developed for semiconductor manufacturing, microfluidics technology have matured considerably in the
last few decades to deliver performances that are on-par or often better than conventional benchtop techniques. Various microchip-based processes including sample filtration' 2, dilution3 4, mixing5, polymerase chain reaction6 7, sample preconcentration- 0 and separation techniques6, 7 have been demonstrated. The seamless integration of these functionalities into a single microchip platform have enabled complex multi-step chip-based bioanalysis' such as immunoassays12' 13, DNA analysis6'7' 14 and chemical detection15' 16 to be performed from raw sample with minimal user intervention. These lab-on -chip systems could change the current healthcare paradigm as sensitive tests could now be performed at a doctor's office or from a portable device in resource-poor regions. Instant access to this important test information would help healthcare providers in making a better diagnosis and prescribing the appropriate treatment at much lower overall cost.
Aside from the versatile integration in lab-on-chip systems, microfluidic devices could make use of the novel physics associated with the micro/nano structures to realize new capabilities. As we can now fabricate structures with critical dimension comparable to biomolecules, we can directly manipulate biomolecules based on their size-dependent interactions with the solid-state nanostructures. This had led to applications such as biomolecular separation in nanochannel arrays 17-19 as well as ultrasensitive biosensing using nanowires20' 21 and nanopores2 2 2 5. Besides, interesting phenomena such as concentration polarization at the micro-nano interface has been used successfully for sample preconcentration9 and increasing the sensitivity of various biomarker assays26-28
1.2 New developments in biosensing
The sensitivity and application of biosensing depends critically on the methods used for detection. Thanks to recent advances in material science, fabrication technology and discovery of new physics, several notable ultrasensitive biosensors have been developed and reported in the literature. Enzyme-linked immunosorbent assays29-31 (ELISA), which use enzymes-conjugated antibodies to continuously convert a substrate to a detectable product, are still the gold standard in many assays such as detection of HIV due to their high sensitivities. Other variants of ELISA, such as use of quantum dot-conjugated antibodies3, polymerase chain reaction (PCR) amplification"3 and reduction of silver to enhance the output signal35'
36, have been demonstrated to detect target analytes with exquisite sensitivities. Ultrasensitive assays using electrochemical stripping 7 also share some similarities with ELISA in using a built-in signal amplification mechanism. There have also been several notable label-free detection methods including platforms using silicon nanowires20, n, whispering-gallery mode optical sensors38, 39, suspended microchannel resonator40' 4' and surface enhanced raman scaterring (SERS)42. The common features among these ultrasensitive assays are the various signal amplification mechanisms including enzymatic/chemical amplification 9-37, field-effect enhancement20, n, as well as optical38, 39, 42 and mechanical resonance0' 41. These assays are also examples of heterogeneous assays, where the target molecules are detected by selectively capturing them onto capture agents immobilized on a solid-phased support. For portable lab-on-chip applications, heterogeneous assays present many challenges such as the requirement for multiple washing steps and slow binding kinetics. Moreover, immobilizing specific antibodies to the solid-phase support while maintaining the activity and specificity of the antibodies is a non-trivial task and often a source of error in heterogeneous biosensors.
On the other hand, in homogeneous assays, no immobilization step is required as reaction between the target molecule and capture agent is carried out in solution phase. Reacted molecules are detected by a change in physical property such as fluorescence signal43 44, fluorescence polarization44,
size-dependent light scattering4 , magnetic relaxation*6 and electrophoretic mobility47. Homogenous assays are attractive from a point-of-care diagnostic viewpoint due to the fast reaction kinetics and simple mix-and-use operation which does not require labor intensive washing steps. However, they are usually less sensitive than their heterogeneous assay counterpart because of the lack of signal amplification. A signal amplification method that could be generally applied to homogeneous assays would combine the best of both worlds - ease of use of a homogeneous assay coupled with the sensitivity of a heterogeneous enzyme-linked assay.
1.3 The issues of affinity capture agents
Due to their high affinity and specificity, antibodies have been used extensively as capture agents in diagnostic tools48. The use of antibodies in detecting analytes became widespread in the 1970s with
polyclonal antisera derived from immunized animals. In 1975, the development of monoclonal antibodies from hybridoma cells was a major milestone that allowed the production of a unique antibody in large quantity49. Today, the antibody discovery process starts with immunizing an animal with the antigen of interest over a course of several weeks, followed by isolating antibody-producing cells from the spleen of the animal, fusing these cells with immortalized myeloma cells to form hybridoma cells, and finally screening for cell lines that produce high affinity and specificity antibodies. These cells are continuously cultured to harvest monoclonal antibodies. Due to the laborious process, identification and production of antibodies could be very time consuming and expensive especially when searching for rare antibodies that require screening of a large number of colonies. As such, this could lead to a prohibitively high cost when using antibodies as affinity reagents. Furthermore, antibodies have limited shelf life and the performance of the same antibody tends to vary from batch to batch. These are major roadblocks in developing robust, affordable and standardized point-of-care diagnostic platforms.
Several alternative affinity capture agents, including oligonucleotide aptamers50 53, phage-display peptides54 and multiligand protein capture ligand55, have been proposed to be replacements for antibodies for diagnostic applications. Unlike antibodies, these capture agents are selected through in-vitro processes such as phage display54, systematic evolution of ligands by exponential enrichment (SELEX)56, and one bead one compound (OBOC) method55. Therefore, identification of a suitable capture agent is fast (days)
and miniaturization could further reduce the reagent cost. Due to the well defined chemical synthesis, they could be produced with extreme accuracy and reproducibility, and various functional groups can be attached to these molecules during synthesis. Finally, these synthetic capture agents are also more resistant to denaturation and hence compatible with the use in point-of-care diagnostic devices. Compared to antibodies, however, these capture agents often have lower binding strengths. This could limit their use in heterogeneous assays, where stringent washing steps could detach the target molecules. Their lower binding affinities also necessitate higher sensitivity methods to detect the comparatively lesser target molecules that are bound at equilibrium.
1.4 Signal amplification in homogeneous assays
Signal amplification techniques are essential in order to boost the sensitivities of biosensors to detect low abundant analytes. This aspect is especially important in portable lab-on-chip systems where the optical path length is short and when the integrated detection system has limited sensitivity. ELISA or other chemical amplification techniques can be routinely implemented in heterogeneous assays, but it is much more challenging to achieve this in homogeneous assays.
There have been a few reports of enzyme amplification in homogeneous assays, such as the enzyme-multiplied immunoassay technique (EMIT)57, enzyme channeling5 8 and enzyme complementation immunoassay59. These techniques are based on the principle that when the target molecule binds to the enzyme-linked antibody, the enzyme activity is altered due to steric effects. Such altered activities can be read out via observing the accumulation of reaction products, as in ELISA. However, since these assays are based on changes in the three-dimensional conformation of the enzymes upon target binding, considerable amount of selection and optimization is required to identify the effective capture agent conjugate for each target. Therefore, they are seldom used in real applications.
Physical (instead of enzymatic or chemical) signal amplification methods have also been demonstrated in the context of homogeneous assays. These are usually achieved by concentrating molecular probes/substrates which undergo fluorescence change upon reaction with the target. Examples include electrokinetic concentration of special substrates for proteases27 and kinases60 which become fluorescent upon reaction with their target molecule, as well as isotachophoresis concentration of molecular beacons which undergo strong fluorescence enhancement upon binding to a target RNA6 1. Physical signal amplification in these cases greatly improved the sensitivities of each assay. Nevertheless, it should be noted that the molecular probes/substrates for these assays are specially customized and designed for detection of these target molecules. It is an exception rather than a norm that such probes are available for a given target molecule.
Another strategy for amplifying signal in homogeneous assay is to preconcentrate all the biomolecules in the reaction mixture before separating them for detection. Unlike the above two classes
of methods, these techniques can be applied to a very large class of assays as most biological reaction or binding result in changes in size or charge that can be detected in a mobility shift assay. Various preconcentration techniques such as membrane preconcentrations'6, 6,3 field-amplified sample stacking
(FASS)64, isotachophoresis (ITP)65 and electrokinetic trapping9 66 have been used in conjunction with downstream electrophoretic separation to improve detection sensitivity. As the preconcentration and separation steps were carried out sequentially in these methods, band dispersion and complex dissociation during separation would ultimately reduce the sensitivity enhancement. Field gradient focusing methods such as electric field gradient focusing (EFGF)67-69, bipolar electrode focusing70' 7' and temperature
gradient focusing (TGF)7 2
-75 are able to simultaneously concentrate and separate analytes of different mobilities. However, these techniques involve the use of special buffers, electrodes in microchannels that cause bubble generation, complicated temperature control setups and nonstandard fabrication. Furthermore, most of these techniques were only demonstrated for concentration and separation of model fluorescent protein and not for real biological assays. Therefore, despite many efforts, there is still no general platform that can be used to provide signal amplification in homogeneous assays.
1.5 Thesis outline and scope
The lack of amplification method in homogeneous assays is a bottleneck that limits their use for sensitive measurements. In recognizing the comparative advantages of homogeneous assays over heterogeneous assays for lab-on-chip systems, we aimed to increase the sensitivities of homogeneous assays by implementing physical signal amplification methods. In this thesis, we have developed two different techniques to simultaneously concentrate and separate reacted from unreacted target molecules by electrophoretic mobility and size differences. The general applicability of these platforms for point-of-care diagnostics is demonstrated in the context of improving the sensitivity of aptamer-based affinity probe electrophoresis assay and homogeneous iminunoassay for clinically relevant biomarkers. Finally, we show that this homogeneous amplification platform is a powerful tool that enables measurements of biological activities in single cells that were previously very difficult to obtain.
Electrophoretic mobility shift assays are the workhorse of molecular biology and have been widely used to measure various biomolecular interactions and enzymatic reactions. In Chapter 2, we developed a microfluidic electrokinetic concentration device to realize a continuous signal amplification scheme for homogeneous mobility shift assays. This is demonstrated in the context of an electrokinetic concentration-enhanced aptamer affinity probe electrophoresis assay to achieve highly sensitive and quantitative detection of protein biomarkers. We reported the lowest detection limit for two biomarkers, human immunoglobulin E (IgE) and human immunodeficiency virus 1 reverse transcriptase (HIV-1 RT), in a multiplexed mocrofluidic platform using low voltages and gravitational induced flow without the need of periphery equipments (syringe pumps, temperature blocks) or multiple buffers. This work is timely and impactful because it directly addresses the sensitivity shortcomings of using aptamers as low cost and robust substitutes for antibodies in point-of-care applications.
There are some cases where biomolecular interactions do not lead to an appreciable mobility change. In those instances, a size difference between reacted and unreacted biomolecules can often be used as a measure for the degree of interaction. In Chapter 3, we developed a herringbone nanofilter array which allows continuous flow size-selective concentration of biomolecules. This is enabled by precise microfabrication of solid-state nanostructures that facilitates size-dependent interactions with biomolecules with comparable critical dimensions. As a proof of concept, we demonstrated the utility of this platform to perform a sensitive homogeneous immunoassay for C-reactive protein, a biomarker for cardiac disease, at clinically relevant concentrations. The continuous flow format also makes this device an attractive sample preparation tool to continuously purify and concentrate target molecules based on size from a sample before performing downstream analysis.
In Chapter 4, we explored how we could adapt the concentration-enhanced mobility shift assay platform developed in Chapter 2 as a tool for basic biological studies. Kinases are important enzymes in the cellular signaling pathways that affect cell fate, yet little is known about how individual cells in different states of intracellular processing respond differently to external stimuli, since most conventional techniques provide only a population-averaged measurement of the signals within the regulatory pathway.
A platform technology that can reliably assay for kinase activity from single cells is a valuable tool for biologists to study how individual cells develop into different cell fates and correlate with their phenotype. In Chapter 4, we first outlined the use of concentration-enhanced mobility shift assay platform to measure cellular kinase activity with high sensitivity. We also developed a new capability to separate multiple species in the concentration-enhanced mobility shift assay platform by using ampholytes or rational design of peptide substrate and spacers. This capability enables users to perform multi-kinase profiling using different substrates. To enable single cell kinase assay, we have developed technology to first grow, isolate and observe single adherent cells, followed by parallel cell lysis and enzyme reaction in confined nanoliter chambers, and lastly methods to recover reaction products and transfer to a separate chip for analysis. By combining these methods, we demonstrated kinase activity assay with single cell sensitivity and resolution. We also demonstrated multiple-kinase activity assay from single cells that could provide vital clues about the functional relationships between different pathways in the signal transduction network.
1.6 References
(1) Broyles, B. S.; Jacobson, S. C.; Ramsey, J. M. Analytical Chemistry 2003, 75, 2761-2767. (2) Yamada, M.; Seki, M. Lab Chip 2005, 5, 1233-1239.
(3) Jacobson, S. C.; McKnight, T. E.; Ramsey, J. M. Analytical Chemistry 1999, 71, 4455-4459. (4) Pihl, J.; Sinclair, J.; Sahlin, E.; Karlsson, M.; Petterson, F.; Olofsson, J.; Orwar, 0. Analytical
Chemistry 2005, 77, 3897-3903.
(5) Johnson, T. J.; Ross, D.; Locascio, L. E. Analytical Chemistry 2002, 74, 45-51.
(6) Khandurina, J.; McKnight, T. E.; Jacobson, S. C.; Waters, L. C.; Foote, R. S.; Ramsey, J. M. Analytical Chemistry 2000, 72, 2995-3000.
(7) Lagally, E. T.; Simpson, P. C.; Mathies, R. A. Sensors and Actuators B: Chemical 2000, 63, 138-146.
(8) Foote, R. S.; Khandurina, J.; Jacobson, S. C.; Ramsey, J. M. Analytical Chemistry 2005, 77, 57-63.
(9) Wang, Y. C.; Stevens, A. L.; Han, J. Analytical Chemistry 2005, 77, 4293-4299.
(10) Yu, C.; Davey, M. H.; Svec, F.; Frdchet, J. M. J. Analytical Chemistry 2001, 73, 5088-5096. (11) Erickson, D.; Li, D. Analytica Chimica Acta 2004, 507, 11-26.
(12) Herr, A. E.; Hatch, A. V.; Throckmorton, D. J.; Tran, H. M.; Brennan, J. S.; Giannobile, W. V.; Singh, A. K. Proceedings of the National Academy of Sciences 2007, 104, 5268.
(13) Fan, R.; Vermesh, 0.; Srivastava, A.; Yen, B. K. H.; Qin, L.; Ahmad, H.; Kwong, G. A.; Liu, C. C.; Gould, J.; Hood, L. Nature Biotechnology 2008, 26, 1373-1378.
(14) Waters, L. C.; Jacobson, S. C.; Kroutchinina, N.; Khandurina, J.; Foote, R. S.; Ramsey, J. M. Analytical Chemistry 1998, 70, 158-162.
(15) Duffy, D. C.; Gillis, H. L.; Lin, J.; Sheppard Jr, N. F.; Kellogg, G. J. Analytical Chemistry 1999, 71, 4669-4678.
(16) Moser, I.; Jobst, G.; Urban, G. A. Biosensors and Bioelectronics 2002, 17, 297-302. (17) Han, J.; Craighead, H. G. Science 2000, 288, 1026.
(18) Fu, J.; Mao, P.; Han, J. Applied Physics Letters 2005, 87, 263902-263902-263903.
(19) Fu, J.; Schoch, R. B.; Stevens, A. L.; Tannenbaum, S. R.; Han, J. Nature Nanotechnology 2007, 2, 121-128.
(20) Cui, Y.; Wei, Q.; Park, H.; Lieber, C. M. Science 2001, 293, 1289.
(21) Zheng, G.; Patolsky, F.; Cui, Y.; Wang, W. U.; Lieber, C. M. Nature Biotechnology 2005, 23, 1294-1301.
(22) Clarke, J.; Wu, H. C.; Jayasinghe, L.; Patel, A.; Reid, S.; Bayley, H. Nature Nanotechnology 2009, 4, 265-270.
(23) Liang, X.; Chou, S. Y. Nano Letters 2008, 8, 1472-1476.
(24) Karnik, R.; Castelino, K.; Fan, R.; Yang, P.; Majumdar, A. Nano Letters 2005, 5, 1638-1642. (25) Schoch, R. B.; Cheow, L. F.; Han, J. Nano Letters 2007, 7, 3895-3900.
(26) Wang, Y. C.; Han, J. Lab Chip 2008, 8, 392.
(27) Lee, J. H.; Song, Y. A.; Tannenbaum, S. R.; Han, J. Analytical Chemistry 2008, 80, 3198-3204. (28) Cheow, L. F.; Ko, S. H.; Kim, S. J.; Kang, K. H.; Han, J. Analytical Chemistry 2010, 82,
3383-3388.
(29) Sato, K.; Tokeshi, M.; Odake, T.; Kimura, H.; Ooi, T.; Nakao, M.; Kitamori, T. Analytical Chemistry 2000, 72, 1144-1147.
(30) Sato, K.; Tokeshi, M.; Kimura, H.; Kitamori, T. Analytical Chemistry 2001, 73, 1213-1218. (31) Yakovleva, J.; Davidsson, R.; Lobanova, A.; Bengtsson, M.; Eremin, S.; Laurell, T.; Emndus, J.
Analytical Chemistry 2002, 74, 2994-3004.
(32) Park, J. S.; Cho, M. K.; Lee, E. J.; Ahn, K. Y.; Lee, K. E.; Jung, J. H.; Cho, Y.; Han, S. S.; Kim, Y. K.; Lee, J. Nature Nanotechnology 2009, 4, 259-264.
(33) Schweitzer, B.; Wiltshire, S.; Lambert, J.; O'Malley, S.; Kukanskis, K.; Zhu, Z.; Kingsmore, S. F.; Lizardi, P. M.; Ward, D. C. Proceedings of the National Academy of Sciences 2000, 97, 10113.
(34) Nam, J. M.; Thaxton, C. S.; Mirkin, C. A. Science 2003, 301, 1884. (35) Park, S. J.; Taton, T. A.; Mirkin, C. A. Science 2002, 295, 1503. (36) Taton, T. A.; Mirkin, C. A.; Letsinger, R. L. Science 2000, 289, 1757.
(37) Hansen, J. A.; Wang, J.; Kawde, A. N.; Xiang, Y.; Gothelf, K. V.; Collins, G. Journal of the American Chemical Society 2006, 128, 2228-2229.
(38) Armani, A. M.; Kulkami, R. P.; Fraser, S. E.; Flagan, R. C.; Vahala, K. J. Science 2007, 317, 783.
(39) Vollmer, F.; Arnold, S. Nature Methods 2008, 5, 591-596.
(40) Burg, T. P.; Manalis, S. R. Applied Physics Letters 2003, 83, 2698.
(41) Burg, T. P.; Godin, M.; Knudsen, S. M.; Shen, W.; Carlson, G.; Foster, J. S.; Babcock, K.; Manalis, S. R. Nature 2007, 446, 1066-1069.
(42) Lu, Y.; Liu, G. L.; Kim, J.; Mejia, Y. X.; Lee, L. P. Nano Letters 2005, 5, 119-124.
(43) Kuningas, K.; Ukonaho, T.; Pikkili, H.; Rantanen, T.; Rosenberg, J.; Lbvgren, T.; Soukka, T. Analytical Chemistry 2006, 78, 4690-4696.
(44) Tachi, T.; Kaji, N.; Tokeshi, M.; Baba, Y. Lab Chip 2008, 9, 966-971.
(45) Liu, X.; Dai,
Q.;
Austin, L.; Coutts, J.; Knowles, G.; Zou, J.; Chen, H.; Huo,Q.
Journal of the American Chemical Society 2008, 130, 2780-2782.(46) Chemla, Y. R.; Grossman, H. L.; Poon, Y.; McDermott, R.; Stevens, R.; Alper, M. D.; Clarke, J. Proceedings of the National Academy of Sciences 2000, 97, 14268.
(47) Bromberg, A.; Mathies, R. A. Analytical Chemistry 2003, 75, 1188-1195. (48) Borrebaeck, C. A. K. Immunology Today 2000, 21, 379-382.
(49) K6hler, G.; Milstein, C. Nature 1975, 256, 495-497.
(50) Cox, J. C.; Hayhurst, A.; Hesselberth, J.; Bayer, T. S.; Georgiou, G.; Ellington, A. D. Nucleic Acids Research 2002, 30, e108-e108.
(51) McCauley, T. G.; Hamaguchi, N.; Stanton, M. Analytical Biochemistry 2003, 319, 244-250. (52) Gold, L.; Ayers, D.; Bertino, J.; Bock, C.; Bock, A.; Brody, E. N.; Carter, J.; Dalby, A. B.; Eaton,
B. E.; Fitzwater, T. PLoS ONE 2010, 5, e15004.
(53) Proske, D.; Blank, M.; Buhmann, R.; Resch, A. Applied Microbiology and Biotechnology 2005, 69, 367-374.
(54) Smith, G. P.; Petrenko, V. A. Chemical Reviews 1997, 97, 391-410.
(55) Agnew, H. D.; Rohde, R. D.; Millward, S. W.; Nag, A.; Yeo, W. S.; Hein, J. E.; Pitram, S. M.; Tariq, A. A.; Bums, V. M.; Krom, R. J. Angewandte Chemie International Edition 2009, 48, 4944-4948.
(56) Tuerk, C.; Gold, L. Science 1990, 249, 505.
(57) Rubenstein, K. E.; Schneider, R. S.; Ullman, E. F. Biochemical and Biophysical Research Communications 1972, 47, p19 7 2.
(58) Litman, D. J.; Hanlon, T. M.; Ullman, E. F. Analytical Biochemistry 1980, 106, 223-229. (59) Dieter Engel, W.; Khanna, P. L. Journal ofImmunological Methods 1992, 150, 99-102.
(60) Lee, J. H.; Cosgrove, B. D.; Lauffenburger, D. A.; Han, J. Journal of the American Chemical Society 2009, 131, 10340-10341.
(61) Bercovici, M.; Kaigala, G. V.; Mach, K. E.; Han, C. M.; Liao, J. C.; Santiago, J. G. Analytical Chemistry 2011, 83, 4110-4117.
(62) Khandurina, J.; Jacobson, S. C.; Waters, L. C.; Foote, R. S.; Ramsey, J. M. Analytical Chemistry 1999, 71, 1815-1819.
(63) Hatch, A. V.; Herr, A. E.; Throckmorton, D. J.; Brennan, J. S.; Singh, A. K. Analytical Chemistry 2006, 78, 4976-4984.
(64) Lichtenberg, J.; Verpoorte, E.; de Rooij, N. F. Electrophoresis 2001, 22, 258-271. (65) Jung, B.; Bharadwaj, R.; Santiago, J. G. Analytical chemistry 2006, 78, 2319-2327.
(66) Astorga-Wells, J.; Swerdlow, H. Analytical Chemistry 2003, 75, 5207-5212. (67) Koegler, W. S.; Ivory, C. F. Journal of Chromatography A 1996, 726, 229-236. (68) Petsev, D. N.; Lopez, G. P.; Ivory, C. F.; Sibbett, S. S. Lab Chip 2005, 5, 587-597. (69) Kelly, R. T.; Woolley, A. T. Journal of Separation Science 2005, 28, 1985-1993.
(70) Laws, D. R.; Hlushkou, D.; Perdue, R. K.; Tallarek, U.; Crooks, R. M. Analytical Chemistry 2009, 81, 8923-8929.
(71) Mavr6 , F.; Anand, R. K.; Laws, D. R.; Chow, K. F.; Chang, B. Y.; Crooks, J. A.; Crooks, R. M. Analytical Chemistry 2010, 82, 8766-8774.
(72) Ross, D.; Locascio, L. E. Analytical Chemistry 2002, 74, 2556-2564.
(73) Balss, K. M.; Ross, D.; Begley, H. C.; Olsen, K. G.; Tarlov, M. J. Journal of the American Chemical Society 2004, 126, 13474-13479.
(74) Balss, K. M.; Vreeland, W. N.; Phinney, K. W.; Ross, D. Analytical Chemistry 2004, 76, 7243-7249.
Chapter 2
Concentration-Enhanced
Mobility
Shift Assay
Platform for
Aptamer-Based Biomarker Detection
In this chapter, we describe a continuous signal amplification scheme for homogeneous mobility shift assays. This is achieved by simultaneously concentrating and separating bound and unbound molecules (with different electrophoretic mobilities) in a microfluidic device. The utility of this platform is demonstrated in the context of an electrokinetic concentration-enhanced aptamer affinity probe electrophoresis assay to achieve highly sensitive and quantitative detection of protein biomarkers. The key weaknesses of aptamer as a binding agent (weak binding strength/fast target dissociation) were counteracted by continuous injection of fresh sample while band-broadening phenomena were minimized due to self-focusing effects. Within 30 minutes of continuous signal enhancement, we can detect 4.4 pM human Immunoglobulin E (IgE) and 9 pM Human Immunodeficiency Virus 1 Reverse Transcriptase (HIV-1 RT), which are among the lowest limits of detection (LOD) reported. IgE was detected in serum sample with a LOD of 39 pM due to nonspecific interactions between aptamers and serum proteins. 2.1 Aptamers as affinity agents in diagnostics platforms
The issue of affinity agent is a bottleneck in developing robust, affordable and standardized diagnostic platforms. For decades, antibody-based immunoassays have been used for disease diagnosis that requires highly specific and sensitive recognition elements. However, production of antibodies is an expensive and laborious process that involves immunizing host animals and developing hybridoma cell lines. Antibodies are also prone to denaturing at ambient conditions and often subjected to batch-to-batch variations, thus complicating their use in point-of-care diagnostic platform.
AT3 12
5
21 14 1 10 1 T7G
aT,
Thrombin binding aptamer: 5'-GGTTGGTGTGGTTGG-3'
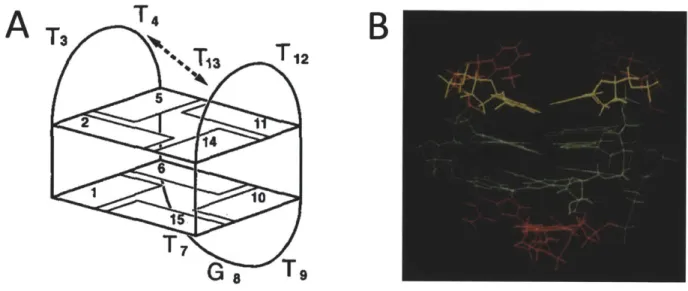
Figure 2.1: a) Schematic model, and b) 3-dimensional structure of the thrombin binding aptamer. The highlighted bases form the G-quadruplex secondary structure. (Adapted from works of Schultze et al.1)
Recently, aptamers are emerging as an increasingly popular alternative to antibodies as affinity probe in analytical applications. Aptamers are single-stranded oligonucleotides that have undergone multiple round of in vitro selection to bind specifically to various molecular targets2' ". Figure 2.1 shows an example of a 15 base pair DNA aptamer with secondary G-quadruplex structures that binds to human thrombin protein'. As binding agents, aptamers can rival antibodies in terms of sensitivity and selectivity. A major advantage of aptamers compared to antibodies is the low cost, since aptamers are synthesized chemically whereas antibodies are produced from animals or hybridoma cell lines4. Unlike protein-based binding agents, aptamers can also be stored in harsh environment without permanently denaturing4. Finally, various functional groups can be easily attached to aptamers during synthesis with excellent batch-to-batch uniformity. With these features, aptamers are very attractive candidates for developing point-of care biosensors. Recently, more than 800 aptamers have been generated against proteins that are potential biomarkers5. These are promising signs that aptamer biosensors will find widespread applications.
Various kinds of aptamer-based biosensors, both homogeneous and heterogeneous assays, have been reported in the literature. In heterogeneous assays, aptamers are immobilized on a solid surface to selectively capture target molecules from the sample. These include electrochemical assays6, 7 and
sandwich assays8 where the captured target protein is detected by a secondary fluorescent or enzyme labeled aptamer. Label-free detection is also possible with surface-plasmon resonance9'10 or quartz crystal microbalance" techniques. On the other hand, aptamers and target molecules react in solution phase in homogeneous assays. These include assays using structure-switching aptamers that change fluorescence when they bind to the target12' 13, electrophoresis based methods which can separate bound and unbound aptamers14 15 , and techniques which rely on polymerase chain reaction (PCR) such as proximity ligation
16
assays
Comparing between heterogeneous and homogeneous aptamer biosensors, the heterogeneous aptamer assays are usually very sensitive because the signal can be amplified by enzymes. However, these sensors require multiple washing steps and binding kinetics of target molecules to surface bound aptamers is slow. There is also potential loss of aptamer binding activity after surface immobilization and the inherent difficulty of generating two aptamers against distinct epitopes on a target biomarker to be used in a sandwich assay format. On the other hand, the homogeneous assays are very easy to use and have fast binding kinetics, but usually have lower sensitivity and many of the structure-switching type assays require customization for each aptamer-target binding pair. The homogeneous aptamer assays are attractive candidates as point-of-care biosensor platforms because they are fast and simple to use. However, the bottleneck that prevents their widespread application is the limited sensitivity. A general signal amplification scheme that can increase the sensitivity of homogeneous aptamer assays would greatly expand their utility.
2.2 Electrokinetic concentration as a signal amplification module for aptamer affinity
probe electrophoresis assay
Among the homogeneous aptamer biosensors, capillary electrophoresis (CE) based methods which can separate bound and unbound aptamers have been widely used to detect specific target proteins such as IgE4- 17,
18, thrombin4' "Q, ricin5, and HIV-1 reverse transcriptase (HIV-1 RT)1 7, 20, 21. Unlike
heterogeneous immunoassay methods such as ELISA that require several hours and multiple washing steps, the homogeneous CE assay is performed in one step with only a short incubation time ( 30 minutes). However, CE assays are generally less sensitive than ELISA due to the ability of enzymes in ELISA to continuously convert a substrate to visible product over time. Furthermore, band dispersion and complex dissociation when using lower affinity (high Kd) aptamers limits their applicability to detect low abundance biomarkers.
As described in Chapter 1, the readout sensitivity of homogeneous assays can be improved by physically preconcentration. In the context of aptamer-based CE analysis, sample preconcentration has been reported in the forms of sample sweeping'9, preconcentration using a size-exclusion membrane8, transient isotachophoresis (t-ITP)2 2, and temperature gradient focusing (TGF)2 3. Preconcentration and
separation were carried out sequentially in the first two cases, thus the detection sensitivity was limited by band-broadening during the separation step. The t-ITP method required multiple buffer arrangements and concentration factor was limited by injected plug volume. In the TGF example, special temperature sensitive buffer was needed and higher limit of detection (LOD) was expected since detection was based on monitoring a small decrease in the large free aptamer peak. In all these examples, high voltages of > 1kV are required.
The Han group has previously reported on nanofluidic electrokinetic concentration devices that can continuously collect negatively charged molecules in a given sample into a much smaller volume, thereby increasing local concentration significantly24. Electrokinetic concentration is particularly amenable to lab-on-chip applications as it has been demonstrated to accomplish very high concentration
factors and does not require complicated setup such as high voltage, multiple buffer arrangements and temperature control schemes. This principle has been used successfully in several approaches to realize ultra-high sensitivity immunoassays. In the first instance, by using an electrokinetic concentrator to increase the local concentration of target molecules around antibody-conjugated beads, the primary immunobinding kinetics and assay sensitivity are greatly improved. In another method, an electrokinetic concentrator is used to enhance the readout sensitivity of ELISA by accumulating the fluorescent turnover products from target-bound enzymes26. Both these platforms, however, are examples of heterogeneous immunoassays. Continuous physical amplification for homogeneous binding assays has not been demonstrated to date as it would require the additional capability of separating bound from unbound analytes in solution phase at the same time.
In this chapter, we describe an electrokinetic concentration device that can simultaneously concentrate and separate biomolecules based on mobility differences. This device is used to improve the sensitivity of an aptamer affinity probe electrophoresis assay. This scheme features three simultaneous processes: 1) continuous injection, 2) focusing, and 3) separation of the free aptamers and aptamer-protein complexes. One of the significant disadvantages of aptamer affinity probe CE is that complex may dissociate during long migration times, leading to weak or even absence of signal27. Decreasing the time spent on column, either by applying very high electric fields or utilization of hydrodynamic flow was often necessary to achieve reliable detection of the aptamer-protein complex27. In this new scheme, we counteract dissociation of the aptamer-protein complex by continuous injection and accumulation of fresh sample from the inlet reservoir. Band broadening phenomena commonly encountered in CE are also minimized due to the self-focusing effect. When a continuous flux of sample from the equilibrium mixture in the reservoir is subjected to simultaneous focusing and separation the signal-to-noise ratio increases with time. A good signal enhancement scheme is the key to highly sensitive assays such as ELISA. The scheme presented here presents an opportunity to enhance the signal in homogeneous mobility shift assay for better sensitivity.
As a proof of concept, we demonstrate the use of electrokinetic concentration-enhanced aptamer affinity probe electrophoresis assays for two different disease biomarkers, namely human Immunoglobulin E (IgE) and Human Immunodificiency Virus 1 Reverse Transcriptase (HIV-1 RT). IgE is the least abundant class of antibodies produced in human, and plays an important role in generating allergic response as well as defending against parasites28, 29. Some recent studies have suggested the use of serum IgE as a predictive biomarker for diseases such as asthma and peanut allergy, 30. On the other hand, HIV-1 RT is a key diagnostic and therapeutic target of HIV- 133. Many aptamer based sensor have been used to detect IgE with different LOD, these include methods based on fluorescence enhancement (57 pM) 3, carbon nanotube field effect transistors (250 pM)35, surface plasmon resonance (18.5 pM)10, CE (46 pM)'4'
17. 18 and aptamer microarray using labeled IgE (10 pM)3 6
, 37. Meanwhile, for detection of HIV-1 RT, the methods reported are predominantly based on CE (100 pM)17' 20, 21, temperature gradient focusing (84 pM), transient isotachophoresis (<1pM) and CE followed by PCR (30 fM). It is worth noting that the LOD reported is dependent on detection instruments and the affinity of the particular aptamers,
and that coupling separation with amplification step often leads to dramatic increase in sensitivity.
Using our platform, we obtained LOD of 4.4 pM and 9 pM for human IgE and HIV-RT respectively in simple buffer after 30 minutes preconcentration, compared to LOD of 46 pM14 and 100
pM'7 obtained with conventional CE methods. These are the lowest assay LOD reported in the literature for aptamer affinity probe capillary electrophoresis in spite of the inferior detector used for our assays (arc lamp and CCD camera) versus Laser Induced Fluorescence and Photomultiplier Tube for CE. To demonstrate the applicability of this assay to complex sample analysis, we performed the assay in 10-fold diluted donkey serum. Initial experiments showed significant nonspecific interaction between DNA aptamers and serum proteins. However, we found that addition of nonspecific and nonfluorescent oligonucleotides largely suppresses the matrix interference, thus enabling us to detect IgE in 10% donkey
2.3 Principle of the assay
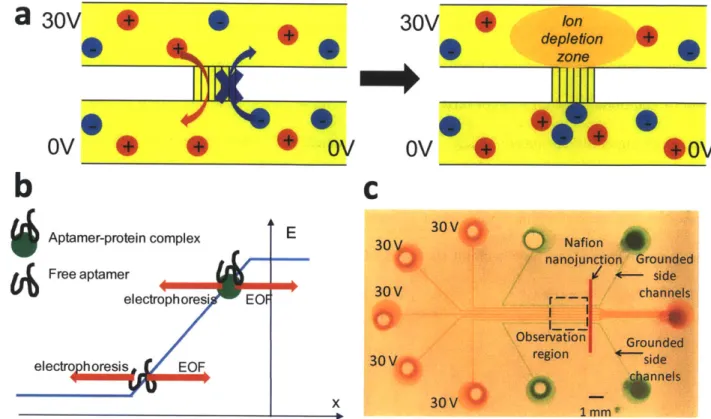
Figure 2.2 shows the key operation of the poly(dimethylsiloxane) (PDMS) microfluidic electrokinetic concentration chip. The basic device consists of two microchannels connected by a cation selective channel that allows the flow of positively charged ions (cations) but impedes the flow of negatively charged ions (anions). Cation selective channels in microfluidics systems have been realized in the form of glass nanochannels where the overlap between Debye layers can exclude coions, or in the form of ion-selective membranes such as Nafion where the presence of highly negatively charged chemical side groups strongly impedes the flow of anions. Under the voltage configuration shown in Figure 2.2a, cations can electromigrate from the top to bottom microchannel, but the passage of anions from the bottom to top microchannel is blocked. As a result, a region depleted of both anions and cations is created in the top microchannel at the vicinity of the cation selective channel in a process known as concentration polarization. The conductivity gradient at the boundary of the ion depletion zone gives rise to a stable electric field gradient. When a sample is injected into this microchannel with a constant bulk flow (due to hydrodynamic pressure or electroosmotic flow), the negatively charged biomolecules will experience an opposing electromigration velocity proportional to the electric field and their electrophoretic mobilities. As shown schematically in Figure 2.2b, the biomolecules stop moving and focus at the location where the electrophoretic velocity balances the bulk velocity. Free aptamers, which have very high electrophoretic mobilities due to the highly negative-charged backbone of the oligonucleotide, are concentrated at the low electric field region. On the other hand, the aptamer-protein complex has a lower mobility due to its larger mass; therefore it concentrates nearer to the cation selective membrane where the electric field is higher. In this way, bound and unbound aptamers can be simultaneously separated and concentrated to facilitate sensitive measurement of the target protein in the sample.
Conventional aptamer affinity probe CE operate in a nonequilibrium condition, since there are no targets in the run buffer that allow for rebinding of aptamers that have dissociated from their initial target during separation. A unique advantage of this platform is that the free target protein molecules are able to travel downstream beyond the concentrated aptamer-protein complex band (an even higher electric field
is needed to stop the low mobility free protein). Therefore, aptamers that have dissociated from their target in the complex band can quickly rebind with free proteins in the run buffer and regenerate the complex, akin to the Equilibrium Capillary Electrophoresis of Equilibrium Mixtures (ECEEM)38 where a plug of equilibrium aptamer-target mixture is injected and separated in a capillary prefilled with target. This is an important advantage which allows even aptamers with relatively high Kd's to be used in this platform with good sensitivity. Using this device, we realized a multiplexed microfluidic platform where homogeneous aptamer affinity probe electrophoresis assays can be performed with low voltages (30V) and gravitation-induced flow without the need of periphery equipments (syringe pumps, temperature blocks) or multiple buffers.
a
3ov
30V
*
VWP'V
we
*
0
ovy ov
.ov
b
Aptamer-protein complexE
Free aptamer
Figure 2.2: a) Ion selective membrane creates a local ion depletion zone with high electric field upon applying a voltage, b) Free aptamers and aptamer-protein complex concentrate at different locations on the electric field profile due to their different electrophoretic mobility, c) Optical image of multiplexd PDMS device with 200 pm wide surface patterned Nafion thin film on glass substrate. Sample channels and side channels are filled with red and green dyes respectively. Experimental images are taken at the observation region.
ov
.I
2.4 Experimental section 2.4.1 Reagents and chemicals
Unless stated otherwise, all chemicals used in the experiments were purchased from Sigma (St. Louis, MO). Human myeloma IgE was purchased from Athens Research and Technology, Inc. (Athens, GA). Recombinant HIV-1 reverse transcriptase (HIV-1 RT) was purchased from Worthington Biochemical Corporation (Lakewood, NJ). Oligonucleotides were synthesized and fluorescently labeled by Integrated DNA Technologies, Inc. (Coralville, IA). IgE -binding aptamer (5'-GGG GCA CGT TTA TCC GTC CCT CCT AGT GGC GTG CCC C-3') was labeled with 6-carboxyfluorescein (FAM) during synthesis at the 5' end using ethylene glycol linker4. HIV-I RT-binding aptamer (5'-AT CCG CCT GAT TAG CGA
TAC TCA GAA GGA TAA ACT GTC CAG AAC TTG GA-3') was labeled directly at the 5' end with FAM17. Nonfluorescent nonspecific oligonucleotides (5'-TGG TCT TGT GTG GCT GTG GCT ATG TCT GAT CTT AAT CCA CGA AGT CAC C-3')17 were also obtained from the same source. Donkey
serum was purchased from Innovative Research (Novi, MI). All solutions were made with deionized water (18.2Mg) by Fluid Solutions (Lowell, MA).
2.4.2 Microchip fabrication
The microchip was fabricated using poly(dimethysiloxane) PDMS (Sylgard 184, Dow Corning Inc., Midland, MI) irreversibly bonded on a glass slide. Microchannels were molded in PDMS by replica molding technique16. To obtain the positive master mold, the desired design was photolithographically
patterned onto a silicon wafer using positive photoresist. Next, the wafer was etched to a depth of 6 tm via a reactive ion etching (RIE) process. The silicon master was further treated with trichlorosilane (T2492, UCT Specialties, Bristol, PA) in a vacuum desiccator overnight to prevent adhesion to PDMS.
We fabricated the ion-selective nanoporous structures by using the microflow patterning technique to obtain a thin strip of Nafion film on a standard glass slide7' 18. A 50 prm deep and 200 prm
wide PDMS microchannel was used to define the flow path of the Nafion solution (20 wt% solution in lower aliphatic alcohol/H20 mix, Sigma Aldrich, St. Louis, MO). The PDMS chip with microchannels was irreversibly bonded on top of the glass slide by standard plasma bonding.
Figure 2.2c showed the top view of the actual PDMS device used in the experiments. 0.1-10 gL pipette tips (USA Scientific, Ocala, FL) were cut at the tip end with a razor blade and inserted into the punched PDMS holes to act as fluid reservoirs. There were five separate inlets connecting to one outlet, allowing five samples to be preconcentrated simultaneously. Two side channels flanked the inlet channels to provide symmetrical electrical ground. The ion-selective nanojunction was fabricated at the center of the device to concentrate sample molecules by electrokinetic trapping when voltages are applied. The channels were filled with dyed solution for visualization purpose.
2.4.3 Microchip operation
Before the experiment, the PDMS device channels were passivated with 1% bovine serum albumin (BSA) for 10 minutes to reduce nonspecific binding of the sample to channel walls. After that, the channels were flushed with DI water 3 times and filled with buffer solution (10 mM Tris-HCl, pH 7.4) until the samples were ready to be loaded. Sample was prepared by mixing 5 nM of fluorescently labeled aptamer with different concentrations of analyte in buffer solution (10 mM Tris-HCl, 1 mM MgCl2, 200 gg/mL BSA, pH 7.4 (IgE)/ pH 8(HIV-1 RT)).
After 30 minutes incubation at room temperature, 30 pL of sample was loaded into each of the five inlet reservoirs and drawn into the microchannel by applying a brief suction at the outlet reservoir. The liquid height difference between the inlet reservoir and the empty outlet reservoir caused a well-controlled gravitational flow of sample solution from inlet to outlet, without any need for external pump.
Electrodes were inserted into the inlet and buffer reservoirs on the chip and connected to a power supply (Stanford Research Systems, Sunnyvale, CA). To initiate the concentration-enhanced affinity probe electrophoresis assay, we applied 30 V at the inlet reservoirs while grounding the side channels. An ionic concentration gradient was induced near the ion-selective membrane by concentration polarization effect. Meanwhile, charged sample molecules are continuously separated and stacked at the location where its electrophoretic velocity equals the bulk flow velocity. Within the experimental duration of 30 minutes, the fluorescent intensity of the stacked molecules increases linearly with time while background noise remained constant, resulting in a high signal-to-noise ratio. To study the reproducibility of the
assay, we repeated the experiment in the same device after removing the contents in the inlet reservoirs and replacing them with new samples.
2.4.4 Measurement instrument and image analysis
An inverted epifluorescence microscope IX 71 (Olympus, Center Valley, PA) equipped with a cooled CCD camera (SensiCam, Cooke Corp., Romulus, MI) was used for fluorescence imaging. A mechanical shutter which only opens for 100 ms every 5 s when images are taken was used to prevent photobleaching of the fluorescent molecules. The images were analyzed using the NIH ImageJ software. Flat-field correction was performed by dividing a reference image of the device taken before each experiment. Concentrations of bound and unbound aptamers were assumed to be directly proportional to the focused peak height as demonstrated in previous work. Complex peak heights are normalized by the sum of complex peak height and free aptamer peak height. Dose response curves were fitted using a four-parameter logistic model. Origin 7 software (OriginLab Corp., Northampton, MA) was used for curve fitting.