Detection of liquid–vapor–solid triple contact line in two-phase
heat transfer phenomena using high-speed infrared thermometry
The MIT Faculty has made this article openly available. Please share how this access benefits you. Your story matters.
Citation Kim, Hyungdae, and Jacopo Buongiorno. “Detection of Liquid–
vapor–solid Triple Contact Line in Two-Phase Heat Transfer Phenomena Using High-Speed Infrared Thermometry.”
International Journal of Multiphase Flow 37, no. 2 (March 2011): 166–172.
As Published http://dx.doi.org/10.1016/j.ijmultiphaseflow.2010.09.010
Publisher Elsevier
Version Author's final manuscript
Citable link http://hdl.handle.net/1721.1/105170
Terms of Use Creative Commons Attribution-NonCommercial-NoDerivs License
Detection of Liquid-Vapor-Solid Triple Contact Line in Two-Phase Heat Transfer
Phenomena Using High-Speed Infra-Red Thermometry
Hyungdae Kima,b, Jacopo Buongiornoa *
a
Nuclear Science and Engineering Department, Massachusetts Institute of Technology, Cambridge, MA 02139, USA
b
Nuclear Engineering Department, Kyung Hee University, Youngin, Republic of Korea * Corresponding author: jacopo@mit.edu, +1-617-253-7316
Abstract
Heat transfer in complex physical situations such as nucleate boiling, quenching and dropwise
condensation is strongly affected by the presence of a liquid-vapor-solid triple contact line,
where intense energy transfer and phase change occur. A novel experimental technique for
the detection of the liquid-vapor-solid line in these situations is presented. The technique is
based on high-speed infrared (IR) thermometry through an IR-transparent silicon wafer heater;
hence the name DEPIcT, or DEtection of Phase by Infrared Thermometry. Where the heater
surface is wet, the IR camera measures the temperature of the hot water in contact with the
heater. On the other hand, where vapor (whose IR absorptivity is very low) is in contact with
between the dark and bright areas, we can visualize the distribution of the liquid and gas phases
in contact with the heater surface, and thus identify the liquid-vapor-solid contact line. In
other words, we measure temperature beyond the surface to detect phases on the surface. It
was shown that even small temperature differences (1C) can yield a sharp identification of
the contact line, within about 100 m resolution. DEPIcT was also shown to be able to detect
thin liquid layers, through the analysis of interference patterns.
1. Introduction
Complex two-phase heat transfer phenomena such as nucleate boiling, critical heat flux,
quenching and dropwise condensation are characterized by the presence of a liquid-vapor-solid
contact line on the surface from/to which the heat is transferred. For example, in nucleate
boiling, a significant fraction (but not all [Kim 2009]) of the energy needed for bubble growth
may come from evaporation of a liquid meniscus, or microlayer, underneath the bubble itself,
as shown in Fig. 1a. As the liquid-vapor-solid line at the edge of the meniscus retreats, a
circular dry patch in the middle of the bubble is exposed; the speed of the triple line retreat is
one measure of the ability of the microlayer to transfer heat to the bubble. At very high heat
fluxes, near the upper limit of the nucleate boiling regime, also known as Critical Heat Flux
(CHF), the situation is characterized by larger dry areas on the surface, dispersed within an
interconnected network of liquid menisci (see Fig. 1b) [Chung and No 2003].
In quenching heat transfer, which refers to the rapid cooling of a very hot object by immersion
in a cooler liquid, the process is initially dominated by film boiling. In film boiling a
continuous vapor film completely separates the liquid phase from the solid surface; however, as
the temperature gets closer to the Leidenfrost point, intermittent and short-lived liquid-solid
once again (see Fig. 1c). Ultimately, if bubble nucleation ensues at such contact points, the
vapor film is disrupted and the heat transfer regime transitions from film boiling to transition
boiling.
Finally, in dropwise condensation, the phase transition from vapor to liquid occurs via
formation of discrete droplets on the surface (see Fig. 1d) [Rose 2002], and the resulting
liquid-vapor-solid triple line is where heat transfer is most intense.
To gain insight into and enable mechanistic modeling of all these two-phase heat transfer
phenomena, there is clearly a need to detect the liquid-vapor-solid triple contact line and
measure its physical characteristics (extension, speed, temperature).
Two-phase flow and heat transfer diagnostics is a rich field, which has produced several tools
for probing certain aspects of the afore-mentioned phenomena. We will focus here on
instruments that detect phases. For the purpose of this study, phase detectors can be divided
into two broad categories: ‘bulk phase detectors’ and ‘surface phase detectors’. The bulk
phase detectors detect phases within the bulk of the flow, away from the solid surface; they
spatial resolution. On the other hand, X-ray and -ray tomography is non-intrusive, but rather
costly/cumbersome as the radiation source has to be rotated at high speed around the test
section, which also may limit the time and/or space resolution of the technique; ultra-fast
approaches have been developed to increase the time and space resolution in recent years [Hori
et al. 2000, Bieberle et al. 2009]. More suitable for detection of the triple contact line are the
surface phase detectors. These include high-speed video, whose usefulness typically is
limited by poor optical access to the surface due to the interference from rising bubbles, and
total reflection, which is rather simple and effective, but requires a heater that is completely
transparent to visible light, e.g., an indium-tin-oxide film on sapphire or borosilicate glass
substrate [Nishio and Tanaka 2004].
In this paper we describe a different (novel) technique, based on infrared (IR) thermometry
through an infrared-transparent solid surface, which exploits temperature (and absorptivity)
differences to detect the liquid-vapor-solid triple contact line. We call this technique DEPIcT,
or DEtection of Phase by Infrared Thermometry. DEPIcT is first described in Section 2; the
spatial uncertainties and sensitivities in the identification of the triple contact line are discussed
2. Infrared thermometry to detect liquid-gas-solid contact line
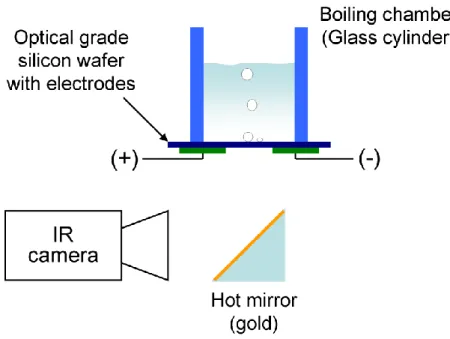
An IR camera is used to detect the phases present on a heated surface. The key feature of this
technique is to use a heater material that is IR transparent (e.g. optical grade silicon wafer), and
a fluid that has a very high IR absorptivity (e.g. water). The IR camera is placed below the
heater, while the fluid lies on top (Fig. 2). Where the heater surface is wet, the IR camera
measures the temperature of the hot water in contact with the heater. On the other hand,
where vapor (whose IR absorptivity is very low) is in contact with the heater, the IR light
comes from the cooler water beyond the vapor. The resulting IR image appears dark (cold) in
dry spots and bright (hot) in wetted area. Using the contrast between the dark and bright areas,
we can visualize the distribution of the liquid and gas phases in contact with the heater surface,
and thus identify the liquid-vapor-solid contact line. In other words, we measure temperature
beyond the surface to detect phases on the surface. This approach distinguishes DEPIcT from
the now-established IR thermometry technique with IR-opaque heaters [Theofanous et al. 2002,
Wagner and Stephan 2009, Gerardi et al. 2010], where the temperature measured is the
The IR camera used in this study is a SC6000, FLIR Systems Inc., with an IR wavelength range
of 3-5 m. Optical grade silicon wafer with the following properties was used as the heater:
<100> orientation, P/Boron-doped, electrical resistivity 5-25 -cm, thickness 380±25 m, and
double side polished. The relatively high electrical conductivity of this doped silicon made it
possible to use direct (Joule) heating in boiling experiments. The silicon wafer heater is
completely opaque to visible light, but transparent to IR.
A simple experiment with a sliding droplet was conducted first, to verify the optical properties
of the wafer and demonstrate the technique (Fig. 3). The liquid was pre-heated to ~30C,
while the wafer and background were at room temperature (~24C); as a result, in the IR video
the sliding droplet appears brighter than the background, and thus easily distinguishable.
Comparison of high-speed video (HSV) taken from above the wafer with IR video taken
through the wafer clearly shows that the DEPIcT technique precisely and sharply captures the
dynamics of liquid flow on the surface of the wafer, including the triple contact line.
In our lab the HSV is acquired with a Phantom v7.1 camera by Vision Research, Inc., capable
of up to 4800 fps at full 800600 pixel resolution.
Since DEPIcT uses a temperature measurement to detect the triple contact line, it is important
to quantify the uncertainties and sensitivities involved in the IR temperature measurement per
se and the subsequent identification of the triple contact line from the IR image. First, the IR
camera used in this study has a temperature resolution of 0.025C, a maximum frame rate of
125 fps at full spatial resolution of 640512 pixels and higher frame rates at a subset of the
total image, i.e. 1000 fps at 144144 pixels. The actual spatial resolution depends obviously
on the physical size of the object being imaged. For example, if we are interested in imaging
an area of 1 cm2 and use 100100 pixels, the spatial resolution is 100 m. To quantify the
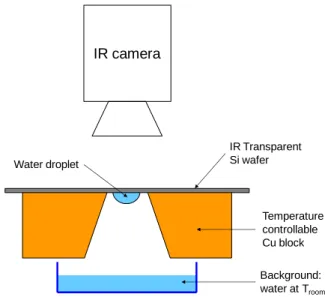
uncertainties and sensitivities of the triple-contact-line detection, a series of tests with static
droplets was conducted at various temperatures. The experimental setup for these tests is
shown in Fig. 4. The background water was kept at room temperature (24.3C), while the
temperature of the wafer and the droplet hanging under it were varied from 25.6 to 30C.
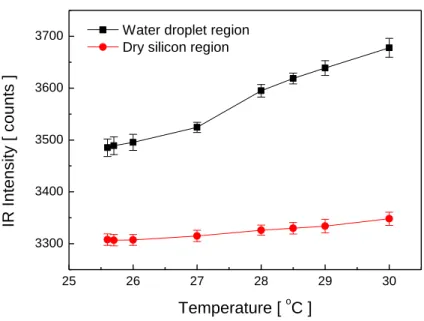
Figure 5 shows the measured IR intensity (counts) of the dry and wet regions of the wafer
surface for different temperatures of the droplet-wafer system. It can be seen that, although
the wafer and droplet are at the same temperature, their signals are very different; this is due to
the differences in the temperature of the droplet hanging under the wafer and the background
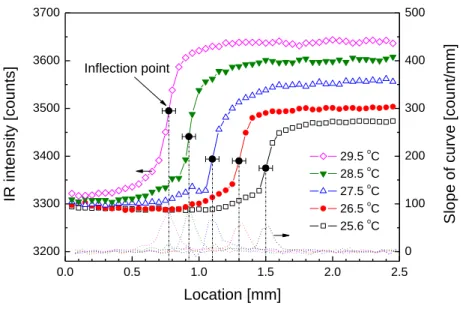
6 shows the IR intensity profile near the edge of droplets at various temperatures. If we
assume the inflection point in the curves to be the nominal location of the triple contact line,
the range over which the IR intensity changes significantly (50%) is about 100 m.
Therefore, the triple contact line on the surface can be identified within 100 m. Finally, note
that the IR intensity change across the contact line is rather sharp even when the temperature
difference between the wafer-droplet system and the background becomes as low as 1.3C
(=25.6-24.3).
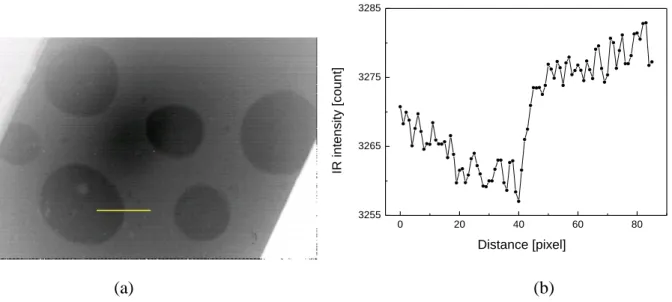
As an additional check of the ability of the technique to capture the contact line, we conducted
a test with static air bubbles attached to the top surface of the wafer. This test was isothermal,
i.e. the wafer, air and water were all at the same (room) temperature. Figure 7a shows the
overall IR image of the surface, where the bubbles are clearly visible. Figure 7b shows the IR
intensity profile near the edge of a bubble; the triple contact line is easily identifiable also in
this situation. In Figure 7, the difference in the IR signal is due to the depth-of-field (DOF)
effect of the IR optical configuration used. DOF is the distance along the optical axis on
either side of the focus point that remains within acceptable focus. The liquid in contact with
intensity is higher for the liquid in contact with the wafer (wet region) than for the liquid
beyond the air (dry region), even though temperature and emissivity are the same for both
liquids in this test. In summary, if a temperature gradient exists, it is the dominant contrast
mechanism; however, Figure 7 shows that the DOF effect is also capable of creating contrast at
the triple contact line.
4. Detection of thin films
A key question for the new technique concerns its ability to distinguish a surface that is truly
dry from one covered by a thin liquid film. As discussed in the Introduction, in boiling heat
transfer the area underneath a growing bubble is covered by a thin (and rapidly evaporating)
liquid film, which can be only a few microns thick [Cooper and Lloyd 1969]. At high heat
flux, near CHF, there is a network of thin liquid films sloshing on the surface [Nishio and
Tanaka 2004, Chung and No 2003]. For data interpretation and development of boiling heat
transfer models, it is important to determine the location (and possibly the thickness) of these
films.
of light in water varies from a minimum of 1 m (at 3.0 m) to a maximum of 100 m (at 3.8 m) [Wieliczka et al. 1989]; therefore, at first, one might conclude that the minimum liquid
film thickness that can give full liquid-vapor contrast with our camera is 100 m. In fact,
even thinner liquid films can be detected through the analysis of interference fringe patterns
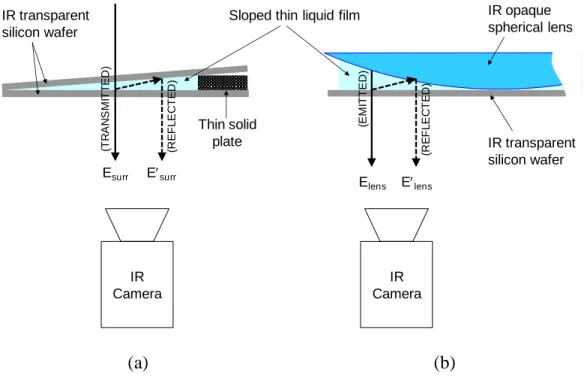
created by the passage of IR light through the films. To illustrate this concept, we conducted
a series of tests with wedge-type planar films, as shown in Figure 8. The thin films were
created by two flat silicon sheets (60 mm 20 mm) separated by sheets of clear plastic tape
with a thickness of 50 m; by varying the number of the sheets, we controlled the slope of the
films. The IR image for one particular configuration is shown in Figure 9a. The IR intensity
profile is shown in Figure 9b. Interference fringe patterns are clearly visible. The fringe
spacing, , is related to the IR wavelength and slope of the film by the following relation
[Dumin 1967]: t L n 2 (1)
where is the IR wavelength, n is the index of refraction of the film layer, t/L is the slope of
the film where t and L are the thickness of the plastic sheets and length of the base substrate,
respectively. Equation 1 was verified by varying the slope of the film in the tests and
the wavelength is approximately constant and well within the IR range of our camera, as
expected.
Next, we used a lens, to create an axi-symmetric curved film off a silicon plate (see Figure 8b),
as that is the geometry of the microlayer underneath a growing bubble. Figure 10 shows the
interference rings both in the presence and absence of water between the lens and the silicon
plate. The lens radius of curvature inferred from the ring spacing ranges from 256 to 282 mm,
which is in good agreement with the actual radius of curvature (257 mm) provided by the lens
manufacturer.
Lastly, we decided to demonstrate the technique for an individual vapor bubble, nucleating and
growing off the surface of the silicon wafer. This case is interesting because it combines the
elements analyzed separately in the previous sections, i.e. temperature gradients and thin films,
but in a dynamic situation. Boiling was induced by resistively heating the silicon wafer with a
DC power supply via Au/Cr metal pads for electrical connection. The IR images were taken
from below the wafer, while boiling occurred on the top face of the wafer (as shown in Fig. 2).
cameras for the bubble. The IR images show various features of the growing bubble,
including a dry (dark) spot at the center of the bubble, a wet (bright) region away from the
bubble, and, up to 5 ms, an intermediate (gray) region. The presence of interference rings in
this intermediate region (see Figure 11b) suggests the presence of a liquid film at the base of
the bubble. This is the so-called microlayer; note that detection of the microlayer via analysis
of interference patterns is not a new approach, though in the past was done predominantly with
visible light [Judd and Hwang 1976, Fath and Judd 1978, Koffman and Plessett 1983].
Koffman and Plesset [1983] developed a technique to accurately measure the microlayer
thickness profiles beneath small, short-lived bubbles using laser interferometry combined with
high speed cinematography. However, the interferometry technique of Koffman and Plesset
had more limited capabilities than DEPIcT because it could not measure the phase distribution
on the surface, but only the thickness of the microlayer.
From the spacing between rings, it was possible to reconstruct the shape (slope) of the
microlayer vs time, as shown in Figure 12. After the microlayer has evaporated (>5 ms) the
triple contact line starts to advance toward the bubble axis, as the bubble is detaching from the
shows that only the tiny tail of the bubble is attached to the heater surface.
5. Conclusion
DEPIcT, a new high-speed phase detection technique suitable for two-phase heat transfer
studies, was presented. It is based on IR thermometry through an IR-transparent heater.
DEPIcT was shown to be able to detect the liquid-vapor-solid triple line accurately in simple
situations such as sliding and static droplets and static bubbles. DEPIcT can also be used to
detect thin liquid films on the surface through the analysis of interference patterns. This
aspect was demonstrated for the microlayer under a growing bubble in nucleate boiling.
Acknowledgements
This work has been made possible by a Seed Fund grant from the MIT Energy Initiative, and
was partially supported by the Korea Science and Engineering Foundation (KOSEF) grant
funded by the Korea government (MEST) (No. 2010-0018761). Prof. Karl Berggren and Dr.
Sebastian Strobel of MIT are acknowledged for providing the silicon wafers used in this study.
Thanks to Dr. Truc-Nam Dinh of the Idaho National Laboratory (INL) for providing useful
References
E. Barrau, N. Rivière, Ch. Poupot and A. Cartellier, 1999, “Single and double optical probes in air-water two-phase flows: real time signal processing and sensor performance”, Int. J. Multiphase Flow, 25(2), 229-256.
M. Bieberle, F. Fischer, E. Schleicher, D. Koch, H.-J. Menz, H.-G. Mayer, U. Hampel, 2009, “Experimental two-phase flow measurement using ultra fast limited-angle-type electron beam X-ray computed tomography”, Experiments in Fluids, v 47, n 3, p 369-378.
H. J. Chung, H. C. No, 2003, Simultaneous visualization of dry spots and bubbles for pool boiling of R-113 on a horizontal heater, International Journal of Heat and Mass Transfer 46 2239–2251.
M. G. Cooper, A. J. P. Lloyd, 1969, “The Microlayer in Nucleate Pool Boiling”, Int. J. Heat Mass Transfer, 12, pp. 895-913.
D. J. Dumin, 1967, “Measurement of Film Thickness Using Infrared Interference,” Rev. Sci. Instrum., 38(8), pp. 1107-1109.
H. S. Fath and R. L. Judd, 1978, "Influence of system pressure on microlayer evaporation heat transfer", J. of Heat Transfer, Vol. 100, pp. 49-55.
C. Gerardi, J. Buongiorno, L. W. Hu, T. McKrell, 2010, “Study of Bubble Growth in Water Pool Boiling Through Synchronized, Infrared Thermometry and High-Speed Video”, Int. J. Heat Mass Transfer, 53, 4185–4192.
K. Hori, T. Fujimoto, K. Kawamishi, H. Nishikawa, 2000, “Development of an ultrafast X-ray computed tomography scanner system: application for measurement of instantaneous void distribution of gas-liquid two-phase flow”, Heat Transfer-Asian Research, v 29, n 3, p 155-65.
ansfer including microlayer evaporation", J. of Heat Transfer, pp. 623-629.
S. Kim, X.Y. Fu, X. Wang and M. Ishii, 2000, “Development of the miniaturized four-sensor conductivity probe and the signal processing scheme”, Int. J. Heat Mass Transfer, 43(22), 4101-4118.
J. Kim, 2009, “Review of Nucleate Pool Boiling Heat Transfer Mechanisms”, Int. J. Multiphase Flow, 35, 1067-1076.
L. D. Koffman and M. S. Plessett, 1983, "Experimental observations of the microlayer in vapor bubble growth on a heated solid", J. Heat Transfer, Vol. 105, pp. 625-632.
S. Nishio and H. Tanaka, 2004, “Visualization of boiling structures in high-heat flux pool-boiling”, Int. J. Heat Mass Transfer, 47, 4559-4568.
H.M. Prasser, A. Bottger, J. Zschau, 1998, “A new electrode-mesh tomography for gas–liquid flows,” Flow Measurement and Instrumentation, 9, 111–119.
J. W. Rose, 2002, “Dropwise condensation theory and experiment: a review,” Proceedings of the Institution of Mechanical Engineers, Part A: Journal of Power and Energy, vol. 216 (2), pp. 115-128.
G. Strotos, M. Gavaises, A. Theodorakakos, G. Bergeles, 2008, Numerical investigation on the evaporation of droplets depositing on heated surfaces at low Weber numbers, International Journal of Heat and Mass Transfer 49 (7-8) 1516-1529.
T. G. Theofanous, J. P. Tu, A. T. Dinh and T. N. Dinh, 2002, The Boiling Crisis Phenomenon, J. Experimental Thermal Fluid Science, P.I: pp. 775-792, P.II: pp. 793-810, 26 (6-7).
T. G. Theofanous, T. N. Dinh, 2006, High heat flux boiling and burnout as microphysical phenomena: mounting evidence and opportunities, Multiphase Science and Technology 18 (3) 251-276.
E. Wagner and P. Stephan, 2009, High-resolution measurements at nucleate boiling of pure FC-84 and FC-3284 and its binary mixtures, Journal of Heat Transfer, v. 131, n. 12, p. 121008.
D. M. Wieliczka, S. Weng, M. R. Querry, 1989, Wedge shaped cell for highly absorbent liquids: infrared optical constants of water, Applied Optics 28 (9) 1714 -1719.
L. Zhang, M. Shoji, 2003, Nucleation site interaction in pool boiling on the artificial surface, International Journal of Heat and Mass Transfer 46 (3) 513-522.
FIGURE CAPTIONS
Figure 1. Representation of physical situation for (a) bubble growth, (b) high-heat-flux nucleate
boiling, (c) Leidenfrost point, and (d) dropwise condensation.
Figure 2. Schematic diagram of the DEPIcT technique. The IR camera takes an image through the
wafer.
Figure 3. Droplet sliding on a vertical silicon wafer. Comparison of the HSV (left) and IR
(right) images taken from the front and back of the wafer, respectively. The sharpness of the
IR image through the wafer confirms that the wafer is transparent to IR.
Figure 4. Experimental set-up for static droplet tests.
Figure 5. IR intensity emitted by the droplet and wafer at various temperatures.
Figure 6. 1D IR intensity profile at the droplet contact line for various droplet-wafer
temperatures (Troom=24.3oC for all cases).
Figure 7. (a) IR image of static air bubbles on top of the wafer under isothermal conditions at
24.1oC, and (b) 1D IR intensity profile near the edge of a bubble.
Figure 8. Experimental setup for detection of (a) planar and (b) curved thin films via
interference fringe patterns.
wavelength calculated from Eq. 1 for films of various slopes.
Figure 10. (a) IR interference rings from an axi-symmetric curved film with a radius of
curvature of 257 mm. (b) Same as (a) but with no water between the lens and the silicon plate.
Figure 11. Bubble nucleation, growth and departure in saturated water on an electrically-heated
silicon wafer: (a) synchronized HSV and IR pictures. (b) interference rings are clearly visible
between the dry center of the bubble base and the outer wet region of the wafer.
(a) (b)
(c) (d)
Figure 1. Representation of physical situation for (a) bubble growth, (b) high-heat-flux nucleate boiling, (c) Leidenfrost point, and (d) dropwise condensation.
Figure 2. Schematic diagram of the DEPIcT technique. The IR camera takes an image through the wafer.
0.0 sec 0.3 sec 0.6 sec 0.9 sec 1.2 sec 1.5 sec
10 mm
Figure 3. Droplet sliding on a vertical silicon wafer. Comparison of the HSV (left) and IR
(right) images taken from the front and back of the wafer, respectively. The sharpness of the
IR camera IR Transparent Si wafer Temperature controllable Cu block Background: water at Troom Water droplet
25 26 27 28 29 30 3300 3400 3500 3600 3700 IR I n te n s it y [ c o u n ts ] Temperature [ oC ]
Water droplet region Dry silicon region
0.0 0.5 1.0 1.5 2.0 2.5 3200 3300 3400 3500 3600 3700 0 100 200 300 400 500 IR i n te n s it y [ c o u n ts ] Location [mm] 29.5 oC 28.5 oC 27.5 oC 26.5 oC 25.6 oC Inflection point S lo p e o f c u rv e [ c o u n t/ m m ]
Figure 6. 1D IR intensity profile at the droplet contact line for various droplet-wafer
0 20 40 60 80 3255 3265 3275 3285 IR i n te n s it y [ c o u n t] Distance [pixel] (a) (b)
Figure 7. (a) IR image of static air bubbles on top of the wafer under isothermal conditions at
Sloped thin liquid film Esurr Esurr IR transparent silicon wafer IR Camera Thin solid plate (a) (b) Elens Elens IR opaque spherical lens (R E F L E C T E D ) (E M IT T E D ) (R E F L E C T E D ) (T R A N S M IT T E D ) IR transparent silicon wafer IR Camera
Figure 8. Experimental setup for detection of (a) planar and (b) curved thin films via
0 1 2 3 4 5 6 -60 -40 -20 0 20 40 60 IR int ens it y dev iat ion from av erage [ c ounts ] Location [mm] (a) (b) 0.002 0.004 0.006 0.008 3.0 3.4 3.8 4.2 4.6 5.0 C alc ulat ed W av elengt h [ m]
Liquid Film Slope
(c)
Figure 9. (a) IR image (b) and IR intensity profile for a planar film of slope 0.0037. (c) IR
(a) (b)
Figure 10. (a) IR interference rings from an axi-symmetric curved film with a radius of
0 ms 1 ms 2 ms 3 ms 4 ms 5 ms 6 ms 7 ms 8 ms 9 ms 10 ms 11 ms 12 ms 13 ms 14 ms (a) (b)
Figure 11. Bubble nucleation, growth and departure in saturated water on an electrically-heated silicon wafer: (a) synchronized HSV and IR pictures. (b) interference rings are clearly visible between the dry center of the bubble base and the outer wet region of the wafer.
0.0 0.5 1.0 1.5 2.0 2.5 0 1 2 3 4 0 1 2 3 4 5 6 7 Fri n g e O rd e r [ /2 n = 1 .5 2 8 m ] Radius [mm] 1 ms 2 ms 3 ms 4 ms M ic ro la y e r T h ic k n e s s [ m]