HAL Id: insu-00534424
https://hal-insu.archives-ouvertes.fr/insu-00534424
Submitted on 8 May 2011
HAL is a multi-disciplinary open access archive for the deposit and dissemination of sci-entific research documents, whether they are pub-lished or not. The documents may come from teaching and research institutions in France or abroad, or from public or private research centers.
L’archive ouverte pluridisciplinaire HAL, est destinée au dépôt et à la diffusion de documents scientifiques de niveau recherche, publiés ou non, émanant des établissements d’enseignement et de recherche français ou étrangers, des laboratoires publics ou privés.
from Six End-Member Mixing Models
Vincent Bustillo, Renaldo Luiz Victoria, Jose Mauro Sousa de Moura, Daniel
de Castro Victoria, Andrade Toledo, Andre Toledo, Erich Collicchio
To cite this version:
Vincent Bustillo, Renaldo Luiz Victoria, Jose Mauro Sousa de Moura, Daniel de Castro Victoria, Andrade Toledo, Andre Toledo, et al.. Biogeochemistry of the Amazonian Floodplains: Insights from Six End-Member Mixing Models. Earth Interactions, American Meteorological Society, 2010, 14 (9), pp.1-83. �10.1175/2010EI326.1�. �insu-00534424�
Biogeochemistry of the Amazonian floodplains.
Insights from six end-member mixing models.
Vincent BUSTILLO (a,b,1), Reynaldo Luiz VICTORIA (a,c), Jose Mauro Sousa de MOURA (a), Daniel de Castro VICTORIA (d), Andre Marcondes Andrade TOLEDO (e), Erich COLLICCHIO (a,f). (a) Centro de Energia Nuclear na Agricultura, Laboratório de Geoprocessamento e Tratamento de Imagens (LGTI), Av. Centenario, 303, CP 96, Piracicaba, SP, Brazil.
(b) Université François-Rabelais de Tours, UMR CNRS/INSU 6113 Institut des Sciences de la Terre d’Orléans, Université d’Orléans, Parc Grandmont, Bâtiment E, 37200 Tours, France.
(c) USP–ESALQ, NUPEGEL, Av. Pádua Dias, 11, CP 9, Piracicaba, SP, CEP 13418–900, Brazil.
(d) Embrapa Monitoramento por Satélite, Av. Soldado Passarinho, 303, Fazenda Chapadão, CEP 13070-115, Campinas, SP, Campinas, SP, Brazil.
(e) Universidade Federal de Mato Grosso, UFMT - Campus de Rondonópolis - Rodovia Rondonópolis-Guiratinga, KM 06 (MT-270) - Bairro Sagrada Família CEP 78735-910 Rondonópolis, Brazil.
(f) Universidade Federal do Tocantins, AgroUnitins, Palmas, Av: NS 15 ALC NO 14, 109 Norte CP 114 / 77001-090, Brazil.
Abstract: The influence of Amazonian floodplains on the hydrological, sedimentary and biogeochemical river
budget was investigated along the Vargem Grande – Obidos reach, by applying six mixing models based on variable regional and/or variable hydrological sources. By comparing the output of many different models designed for different purposes, the nature and the magnitude of processes linking water and biogeochemical budgets of the Amazonian floodplains were clarified. This study reveals that most of the chemical baseline of the Amazon River basin is acquired before the studied 2000 km Amazonian reach. However, the tight connection between the hydrograph stage of the River and the chemical signals provides insightful information on the dynamics of its floodplains. The chemical expression of biotic and abiotic processes occurring in the Amazonian floodplains can be more particularly perceived during falling waters. It appears delayed in time compared to the maximum extension of submerged area, because the alternating water circulation polarity (filling vs. emptying) between the main channel and the adjacent floodplains determines delayed emptying of floodplains during falling waters. It results also in a longer time of residence in the hydrograph network which strengthens the rate of transformation of
1 Correspondence to: Vincent BUSTILLO, Université François RABELAIS de Tours, Parc Grandmont, UFR Sciences et
transiting materials and solutes. Biotic and biologically-mediated processes tend to accentuate changes in river water chemistry initiated upstream, in each sub-basin, along river corridors, indicating that processes operating downstream prolong those from upstream (e.g. floodplains of the large tributaries). Conversely, the flood wave propagation tends to lessen the seasonal variability as a result of the water storage in the floodplains which admixes waters of distinct origins (in time and space). The morphology of floodplains, determining the deposition and the diagenesis of the sediments as well as the variable extension of submerged areas or the chronology of floodplains storage/emptying, appears to be the main factor controlling the floodplains biogeodynamics. By coupling classical end-member mixing models (providing insight on hydrological source) with a variable regional contribution scheme, relevant information on the biogeochemical budget of the Amazonian floodplains can be achieved.
Keywords: Amazon River, floodplains, biogeochemical cycles, sediment dynamics, diagenesis, CO2 outgassing.
1. Introduction
This paper is dedicated to the study of coupled biogeochemical, sedimentary and hydrological budgets of the Amazonian floodplains along a 2000 km-reach extending between the stations of Vargem Grande and Óbidos.
a. Preliminary work
Based on the chemical data of the CAMREX project (Carbon in the AMazon River Experiment), biogeochemical mass balances over the studied reach were calculated at 10 sampling sites, well spatially distributed, by comparing incoming and outgoing signals and fluxes (Bustillo, 2007) with respect to 44 physico-chemical parameters. This approach, based essentially on empirical observations instead of modeling outputs, emphasized that the anomalies of mass balances were mainly related to hydrograph stages and to the hydrological balance of the floodplains. Geochemical and hydrological information were treated in a lumped way, providing thus a pertinent insight on the complex hydrological and chemical linkages normally present between floodplains and river channels
.
Deliberately based on facts instead of modeling outcomes, this preliminary work raised many intriguing questions with respect to the structure of flux and signal anomalies (e.g. the coarse fraction of particulate organic carbon is very significantly 13C enriched during falling waters). The calculations of mass balances were performed in anexhaustive way, at the 10 monitoring stations, involving 44 physico-chemical parameters over 8 sampling cruises. However, the determinants of flux imbalances remain to be identified.
b. Research objectives and challenges
This study aims at deciphering the nature and magnitude of underlying processes driving the transport of particulate and dissolved species towards the ocean and the gaseous exchanges at the river-atmosphere interface, with a special focus on floodplain-channel linkages. This last component is especially significant in large river systems and is highly relevant to contemporary international debates on the human modification of floodplain land-use, flood control, and the construction of levees and reservoirs which all act to de-couple floodplains from stream channel environments. Spatially linking tributary streams and longitudinal shifts in hydrology, water chemistry, and sedimentology is therefore a very challenging issue. Achieving this purpose requires testing the validity of the interpretative statements inspired by the empirical observations (preliminary work). The question addressed in this paper can be formulated as follows: what is the actual impact of the floodplains and that of their hydrological functioning on the biogeochemical budget of the Amazon River basin ?
To these ends, six hydrochemical modelling strategies, based on end-member mixing concept and using tracer-based separation methods, were implemented. These approaches aim to link hydrological pathways and chemical signals in order to couple hydrological and biogeochemical budgets. Comparing the outputs of these different models designed for different purposes is expected to provide a better sense of the whole by constraining better the range of possible interpretations given to the flux imbalances.
c. On the use of end-member mixing models
End-member mixing models provide comprehensive understanding of runoff generation processes with a special focus on hydrological pathways, contributive areas and retention times (Gonzales et al., 2009). However, the direct measurement of each contributive runoff in a continuous way and at a sufficient number of locations is practically impossible (Tardy et al., 2004). Hydrograph separation methods can be divided in two main categories: tracer-based and non-tracer-tracer-based separation methods. Non-tracer-tracer-based separation methods are tracer-based on the analysis of hydrographs, including a large variety of procedures among which: graphical analysis of recession curves, low pass filtering, unit hydrograph model with extrapolation to rising limb of hydrographs, and rating curve methods linking groundwater levels and river flow. Tracer-based separation methods are based on a mass balance approach
determined by the conservative mixture in variable proportions of compositionally constant end-members (or at least sufficiently stable and distinct from one end-member to another to make achievable the procedure). They are usually recognized to deliver valuable information about the groundwater contribution to the river discharge, provided that adequate tracers are selected. The procedure proposed by Hooper et al. (1990), called end member mixing analysis and based on the identification of end-members by principal component analysis (PCA), was widely applied for studying the hydrology of small catchments. Its implementation supposes that the water chemistry within each hydrological component is known. At the scale of very large river basins, no such input data can be measured, more particularly because of spatial heterogeneities of tracer concentrations and because the fluxes supplied by hydrological reservoirs are not systematically conservative due to in-stream processes and fluvial filtering in river corridors and floodplains (Meybeck and Vörösmarty, 2005).
The synthesis of Mortatti (1995) attempted to provide new insights into Amazon River hydrology by gathering biogeochemical and hydrological approaches. However, the hydrograph separation is based on two reservoirs only, and although very interesting, it proved to be insufficient, more particularly because it did not allow to capture the very significant influence of the floodplains on the biogeochemical budget of the Amazon River basin. Despite peculiar cases which are easily corrected case by case, it appears that most of large river basins, whatever their morphology and hydroclimatology, are reasonably modelled using the hydrograph separation concept, dividing the total discharge into - at least - 3 reservoirs.
d. Organization of the manuscript
In order to overcome the difficulties mentioned above, we proposed to investigate the hydrologic function of the Amazon River floodplains, between Vargem Grande (before the confluence of Rio Iça) and Óbidos (the outlet of the studied area), by applying six complementary modelling approaches (including end-member mixing models) to the successive sampling stations located along the main stem of the Amazon. These are based on: (1) variable regional sources with (model M2) and without (model M1) correction of inputs by small tributaries, (2) variable hydrological sources with 3 end-members (model M3) to determine their individual compositional evolution, with contrasted response depending on hydrograph stage, throughout their course in the floodplains, (3) variable hydrological sources with 3 end-members including a correction on the baseflow to account for in-stream biogenic transformations (model M4), and (4) mixed approaches (models M5 and M6) combining the regional variability of
chemical signals (between river basins) and the variability related to hydrological source (between contributing runoffs or end-members), taking into consideration the defaults of floodplains water balance.
The compositional changes of the chemical baseline in each individual reservoir, set in evidence by comparing their composition within incoming (tributaries) and outgoing (Amazon River reach) runoffs are more particularly analyzed. By determining hydrological sources and the magnitude of their individual compositional changes, this approach delivers a valuable and original insight on the main factors (hydrological source, water budget of the floodplains, nature of hydrobiological pattern i.e. photosynthesis vs. mineralization, air-water gaseous exchanges, etc.) driving the biogeochemical and sedimentary budgets of Amazonian floodplains.
2. Study area and dataset
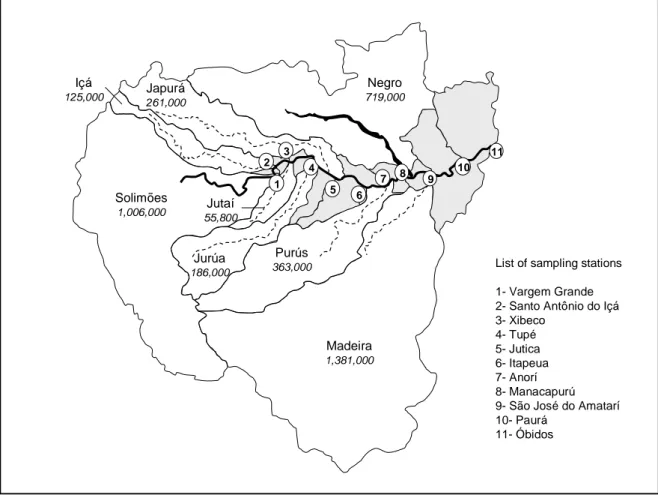
The main physiographic structural elements of the basin include (i) the Precambrian, highly weathered Guyana and Brazilian shields, (ii) the Andean mountains to the west, (iii) the Andean alluvial foreland, and (iv) a large alluvial plain along the Amazon main stem. Soils in the lowlands are generally deep and highly weathered, with widespread covers of sandy podzols in the shields. The soils in floodplains (and alluvial regions around mainstems draining the Andes) are much less weathered, due to the continuous input of fresh sediments, delivered by physical erosion.The Amazon River and most of its large tributaries have developed extensive floodplains which are integral parts of the river systems (Richey et al., 1997). After leaving the Andean foothills, the tributaries of the Amazon converge into a large sedimentary plain where they deposit large volumes of sediments (e.g. Guyot, 1993) and inundate the floodplains via an extensive network of drainage channels called paranas. Two distinct types of floodplain channels are (i) tributary channels that drain upland terraces and (ii) distributary channels that transport main-stem Amazon water and sediment to floodplain lake basins. A synthetic view of the Amazon River basin upstream from Óbidos, including the delineation of major sub-basins, the location of sampling station along the Amazon River main stem and the geographical repartition of small tributaries ungauged during the CAMREX project, is presented (Figure 1).
The samples were collected during the CAMREX Project (Carbon in the Amazon River Experiment), over the period 1982-1984 (8 cruises), during contrasted hydrographic stages, completed by 5 additional cruises between 1985 and 1991 focusing on specific topics, i.e. for which exhaustive data set is not available (thus not considered in this paper). The objective of CAMREX project was to define by mass balances and direct measurements those processes which control the distribution of bioactive elements (C, N, P and O) in the mainstem of the Amazon
River in Brazil. The CAMREX dataset represents a time series unique in its length and detail for very large river systems. The data set, extracted from Pre-LBA compilation (Marengo and Victoria, 1998, available on-line: Richey
et al., 2008), consists in representative flux-weighted water samples for comprehensive chemical analysis
measured over 18 different sites within a 2000 km reach of the Brazilian Amazon mainstem, including 7 major tributaries. This data set constitutes, until that date, the basis of more than 130 CAMREX publications which have focused on understanding physical and biogeochemical dynamics throughout the basin using a large variety of approaches (e.g. Richey et al., 1990). Monitoring stations are located a few kilometres upstream of the confluence of the 7 major tributaries with the Amazon River: Iça, Japura, Jutai, Jurua, Purus, Negro and Madeira, and (2) along the Amazon River at the 11 following stations: Vargem Grande, Santo Antonio do Iça , Xibeco, Tupe, Jutica, Anori, Itapeua, Manacapuru, São Jose da Amatari, Paura and Óbidos (4 619 000 km²), the outlet of the studied area. Thus, it gets possible to compare the inputs from tributaries and the outputs of the Amazon River at different locations along the longitudinal profile of the mainstem.
3. Modelling strategy
Six mixing-models of increasing complexity are implemented (Table 1). They belong to three distinct categories. The first category (models M1 and M2) accounts the variable contribution of the sub-basins to the biogeochemical budget. The second category relies on end-member mixing models (models M3 and M4) which allow the identification of source reservoirs, supposed to have constant composition but contributing in variable proportion to the river flow. A third category of model, taking into account the variability related to regional contrasts and hydrological source, is also explored (models M5 and M6).
a. Variable regional source
The 1st model (M1) fundamentally relies on the comparison between calculated and observed longitudinal profiles of concentrations. Upstream, the chemical composition of Rio Solimões constitutes the starting point (1), and along its course in low plains, several tributaries join the principal river and modify its chemical composition: Rios Içá (2), Jutai (3), Japurá (4), Juruá (5), Purus (6), Negro (7), Madeira (8), the last one before Óbidos, the outlet of the Amazon River basin (9) chosen in this study. Considering the concentrations ( j
i
total discharge ( j t
Q
) of the jth confluent, and before the confluence with the tributary (j +1), the concentration 1 , + j tot iC
in the Amazon River after the j+1 th confluent, is established as follows:∑
∑
= + = = = + + +⎥
⎦
⎤
⎢
⎣
⎡
×
+
×
=
1 1 1 1 1 , 1 , j k k k t j k k j t j i k t j tot i j tot iC
Q
C
Q
Q
C
(1)Pedices i and apexes j correspond respectively to the parameter analysed and to the number of tributaries contributing to the Amazon River flow at each station considered (from j = 1 standing for Santo Antonio do Içá to j = 8 designating the station of Óbidos). Assuming conventionally that
∑
= =
=
n j n n tot j totQ
Q
1 and∑
+ = = +=
1 1 1 n j n n t j totQ
Q
, one obtains:[
1 1]
1 , 1 ,+=
×
+
+×
+ + j tot j t j i j tot j tot i j tot iC
Q
C
Q
Q
C
(2)After the jth confluent, ,j+1 tot i
C
becomes j tot iC
, , and the cumulative runoff changes from j+1 totQ
to j totQ
.For each parameter, the concordance between theoretical (i.e. calculated) and observed longitudinal profiles is appreciated by analysing the fitting capability of the simple linear model:
j i j i j i j i
obs
C
calc
C
(
.)
=
α
×
(
.)
+
β
(3)The correlation coefficient R² is calculated for each parameter (ni = 44) and each station (nj = 10). The results of
calibration are given in appendix (Table A2). Then, the slope j i
α
(ideally close to 1) and the intercept to originj i
β
(ideally close to 0) are considered. Finally, the mean bias B is calculated as follows:j k i Nk k k Nk k k j k i j k i j i
N
obs
C
calc
C
B
, 1 1 , ,(
.)
(
.)
∑
=∑
= = =−
=
(4)where k indexes the number of the sample and j k i
N
, for the number of samples for each station and each parameter. This bias, calculated on average discharge-weighed values, allows estimating the mean chemical composition of floodplains and small tributariesC
ij(v
)
, assuming that measured biases depend on their variable contribution to river flow. The model M2 corrects M1 by taking into account the mean composition of smalltributaries and floodplains. The composition of the additional flow (small tributaries + alluvial aquifers), noted
)
(v
C
ij , is estimated by the analysis of differences (composition and flow) between the sum of major tributaries (calculated input):Φ
ij(
in
)
=
C
ij(
in
)
×
Q
tj(
in
)
and the output (measured output):)
(
)
(
)
(
out
C
ijout
Q
tjout
ji
=
×
Φ
corresponding to the river water composition at the considered station.(
(
)
(
)
)
(
)
(
(
)
(
)
(
)
(
)
) (
(
)
(
)
)
)
(
v
out
in
Q
v
C
out
Q
out
C
in
Q
in
Q
out
Q
in
C
tj j t j t j i j t j i j t j i j i j i=
Φ
−
Φ
=
×
−
×
−
(5)Finally, the concentrations obtained through the model M2 for each cruise are given by:
[
]
{
}
1 , , 1 , , 1 , 2 ,(
)
(
)
(
)
+ +−
×
+
×
=
j k t j k t j k t j i j k t j k i j k iM
C
M
Q
C
v
Q
Q
Q
C
(6)In order to test the model fitting capability, linear equations comparable to those presented above for M1 are also calibrated for M2. By averaging the estimations of all the samples, it must be reminded that j
i
B
= 0 for each station and each parameter, in the case of M2.b. Variable hydrological source.
The third model (M3) relies on the hydrograph separation into three components: RS, the superficial runoff, RI the interflow and RB the baseflow. These reservoirs are meant as the expression of spatially organized tributary basins with vertical (top-bottom in soils) and upstream-downstream gradients involving three mixing end-members: - RS tracking superficial and hypodermic pathways that arise more particularly in upstream areas which provide
most of the solid load transported by fluvial systems;
- RI tracking superficial and hypodermic pathways that arise more particularly in downstream areas where deep
leached soils provide waters of low dissolved (except for organic matter) and solid loads;
- RB tracking groundwater pathways, corresponding to the leaching of the soil horizon C (permeable saprolite) that
occasionally emerge in the gleysols of lowlands, as inferred from the very characteristic 18O enrichment of waters (Tardy et al., 2009).
The identification of these three components relies upon chemical tracing. The concentrations of Na+ and FSS (fine suspended sediment) are selected as the best tracers (Tardy et al., 2005). The fluctuations of [Na+] track the processes of dissolution and evaporation which tend to generate a concentration gradient from the superficial layer of soil to groundwaters which are directly at the contact with the chemical front of alteration. On the other side, the
fluctuations of [FSS] track the soil erosion which is almost specific of surface runoff. The chemical tracers in each reservoir determine the contribution of these source reservoirs to the total river flow Qt by solving the system of equation composed of 2 equations of mass conservation for each tracer (Eq.7) and the equation of flow conservation (Eq.8). j k j k j i j k j k j i j k j k j i j k i
C
Rs
QRs
Qt
C
Ri
QRi
Qt
C
Rb
QRb
Qt
C
,=
(
)
×
+
(
)
×
+
(
)
×
(7) j k j k j k j kQRi
QRb
Qt
QRs
+
+
=
(8)where j indexes the considered sub-basin and i the parameter used as a chemical tracer.
[Na+] and [FSS] within each reservoir corresponds to the values established by Tardy et al. (2005). The next step consists in adjusting
C
ijRs
,C
Ri
j
i and
C
Rb
ji to the whole data set (42 parameters excluding the 2 tracers) by
performing multilinear regressions. As a result, we define statistically the most probable composition of each reservoir RS, RI, RB. End-member mixing models are calibrated for each of the 10 stations located along the
Amazon River main stem (from Saõ Antonio do Içá to Óbidos) but also for each of the 8 major tributaries. Then, the decomposition of hydrograph is performed theoretically by cumulating the reservoir inflow QK of each
tributary (trib) to each station (1 ≤ j ≤ 8). 1 , 1 + +
=
+
j trib K j K j KQ
Q
Q
(9)where K is the index for hydrological reservoirs : RS, RI or RB. Consequently, for each hydrological node, two
models of repartition are implemented. The first one is calibrated using chemical data measured at each of the 10 stations, whereas the second one is calibrated using a calculated pool of chemical data, corresponding to the variable spatial contribution of sub-basins to the Amazon River discharge. It is expected that differences between the chemical characteristics of reservoirs are good indicators of floodplains biogeodynamics. Full data is provided in appendix (Table A3).
c. Biologically-mediated processes
The biological control of chemical factors in river, popularized by Redfield (1958), is evaluated in the model M4 by testing the influence of biotic processes on the composition of the baseflow RB. The protocol of calculation for
evaluating QRS(j), QRI (j) and QRB (j) is identical to that of the model M3. The composition of baseflow is
[ ] [
]
j k j k j k BIOO
CO
I
=
2−
2 (10)In the case of intense photosynthesis, O2 is actively produced while CO2 is removed and consequently IBIO increases. Conversely, when the decomposition prevails, CO2 is actively produced while O2 is removed and consequently IBIO diminishes. The model M4 is formalised as follows:
[
]
j k j k j k BIO j i BIO j i j k j k j i j k j k j i j k iC
Rs
QRs
Qt
C
Ri
QRi
Qt
C
Rb
K
I
QRb
Qt
C
,=
(
)
×
+
(
)
×
+
(
)
+
×
×
(11) with j i BIOK
corresponding to the rate of uptake or release of each bioactive element (i) for each station (j) associated to biologically-mediated processes in the river water. If ji BIO
K
> 0, the concentration increases when the photosynthesis pathway prevails ( jk BIO
I
> 0) and decreases when the mineralization predominates ( j k BIOI
< 0). The mineralization leads to the removal of dissolved O2 and to the release of CO2. That is the reason why IBIOassociated to mineralization paths is usually negative and potentially very negative. Therefore, j i BIO
K
< 0 indicates that the concentration increases when mineralization pathway prevails ( jk BIO
I
< 0) and decreases when photosynthesis predominates ( jk BIO
I
> 0). In the case of isotopic data (δ18O, δ13C) which are all negative, the interpretation of ji BIO
K
is inverted. For simplification purposes, the signs of j i BIOK
associated to isotopic values were systematically inverted to homogenise the deciphering for all the parameters. Full model outcomes relative to M4 are presented in appendix (Table A4).d. Composite approach
The model M5 is a composite approach which integrates both variable spatial contribution (M1) and variable hydrological source (end-member mixing models). First, we establish for each cruise k (Nk = 8), each parameter i and each hydrological node j, the relative difference, noted j
k i
C
,Δ
, between calculated (calc.) and observed (obs.) values, as follows:.)
(
.)
(
.)
(
, , , ,calc
C
calc
C
obs
C
C
j k i j k i j k i j k i−
=
Δ
(12)The second step consists in relating this relative difference with several factors. We have selected three covariates corresponding to the relative differences Δ (QRS / Qt), Δ (QRI / Qt) and Δ Qt:
(
)
(
)
j i j k j i j k I j i j k S j i j k iQR
Qt
QR
Qt
Qt
C
=
α
×
Δ
+
β
×
Δ
+
γ
×
Δ
+
δ
Δ
, (13) with:(
)
(
)
(
)
(
)
⎪ ⎩ ⎪ ⎨ ⎧ − = Δ − = Δ − = Δ 1 , 1 , , ) / ( 1 , , ) / ( , 1 3 1 3 j k tot j k j k j k I j k I j k I j k S j k S j k S Qt obs Qt Qt M Qt QR M Qt QR Qt QR M Qt QR M Qt QR Qt QR (14) j iδ
in Eq.13 stands for the residual relative difference j k iC
,Δ
when the three following conditions are fulfilled:(i) :
(
)
j k SQt
QR
Δ
= 0 ; (ii) :(
)
j k IQt
QR
Δ
= 0 ; (iii) : j kQt
Δ
= 0 The coefficients j iα
, j iβ
and j iγ
, estimated by multilinear regressions, provide qualitative information on river diagenesis in RS (surface runoff), RI (interflow) and Qt (total runoff). If the coefficient is positive, it indicates thatthe concentration increases in the correspondent runoff as the individual discharge QK increases. Considering the
total river flow Qt, the sign of j i
γ
indicates whether the discharge of floodplains, roughly estimated by1
,−
=
Δ
j k tot j k j kQt
Qt
Qt
contributes to increase or decrease the chemical concentration of the chemical parameter i in the river water at the station j. Values of QRS, QRI, QRB and Qt are given in appendix (Table A1 andFigure A1), M3 corresponding to model-derived data and M1 to data calculated from upstream sub-basins. A complementary approach (M6) consists in evaluating the combined effect of the total discharge j
k
Qt
and its excess or deficit j kQt
Δ
: j i j k j k j i j k j i j k j i j k iQt
Qt
Qt
Qt
C
,=
α
2×
Δ
+
β
2×
+
γ
2×
×
Δ
+
δ
2Δ
(15)The calibration of these 4 coefficients ( j i 2
α
, j i 2β
, j i 2γ
and j i 2δ
) for each sampling station and each parameter leads to synthetic 3-D diagrams (see Figure A2 in appendix) which allow describing the compositional fluctuations of the river water as a function of the river discharge jk
Qt
and the default of water balance j kQt
Δ
.4. Results and Discussion
After a brief comparison of the 5 models in term of statistical resolution capability, the information supplied individually by each method is analyzed. The analysis of their mutual consistency is more particularly performed.
The agreement between calculated and observed water composition is very significant for most of the parameters. The cumulative distribution of correlation coefficient for 5 tested models is presented Figure 2. This indicates that 50% of parameters modelled by M1 exhibit r² > 0.75. Unexpectedly, M1 provides better results than M2 does, suggesting that floodplains are not of constant composition, contrary to the assumption underlying the approach M2. The comparison between M3 and M4 reveals a significant improvement of the performance of end-member mixing models by taking into account the “hydrobiological index” IBIO which allows identifying the parameters
influenced by in-stream processes. The level of performance remains deficient (threshold arbitrarily fixed to r² < 0.60) on 25 % of parameters for M4 vs. 50% of parameters for M3. Finally, the mixed approach (M5) combining variable spatial contribution and end-member mixing models constitutes a very convenient compromise which provides the best results.
b. Variable regional contribution (M1 and M2)
The simple approach consisting in correlating incoming (theoretical, calculated) and outgoing (measured) concentrations (M1) provides insightful information. It appears that most of linear calibrations are very significant, except for SO42-, HPO42-, CSS, POCC, C/N (in all fractions) and PONC. These deficiencies reveal that substantial modifications occur in the floodplains.
Table 2 delivers the mean values of α (slope), β (intersect of line for x = 0), r² (correlation coefficient), bias and
average for each parameter, and for the 10 sampling stations located along the Amazon main stem. These linear calibrations indicate that the compositional fluctuations of river water in the Amazon reach might be greater than those impulsed by the tributaries inputs (α > 1 and β < 0) for pH, K+, Mg2+, NO
3-, CO2, NaSil, KSil, CaSil, MgSil, dolomite and FR. For example, when the inflow defines a low pH, the outflow is still more acidic and conversely
when the inflow defines an elevated pH, the outflow is more basic. Considering the parameters listed before, the open system dynamics along the Amazon main stem (and in its floodplains) accentuate the chemical perturbations initiated upstream, in the sub-basins. Conversely, the compositional fluctuations generated in the tributaries tend to be buffered in the outflow (α < 1 and β > 0) for other parameters such as Ca2+, HCO
3-, DIC, Cl-, DOC, O2, CSS, POCC, C/N (all the fractions), PONF, PONC, DON and [CaCO3].
A complementary analysis of Table 2 consists in assessing the bias between the concentrations in the inflow and in the outflow. Positive values (Bias > 0) indicate that concentrations in the inflow are superior to those measured in the outflow, and vice versa. Negative biases are observed for Ca2+, HCO
CaCO3. We observe also a decrease of δ13C in all the carbon fractions: DIC, POCF and to a lower extent POCC. In turn, positive biases are obtained for NO3-, CO2 and C/N (in all the fractions) while δ18O gets less negative. Globally speaking, the measured composition of the Amazon river (outputs) follows the chemical baseline imprinted by the tributaries (inputs). Thus, in-stream processes arising in the studied reach do not modify fundamentally the chemical composition acquired in the tributaries. The mitigation of compositional fluctuations is probably related to the contribution of ungauged rivers which influence substantially the chemical signal measured in the Amazon River (e.g. Ca2+, HCO3- and Cl-) due to the very low salinity of small rivers draining thick-sandy soils in Central Amazonia. Conversely, the accentuation of trends observed downstream seems to be due to organic matter decay which is expected to take place in the floodplain as water slowly enters the stream-channel from temporary storage. This leads to the release of CO2 (13C depleted) and nitrogenous dissolved species (NO3-, DON), and symmetrically to the removal of O2.
In the model M2, outputs are adjusted by prescribing ad-hoc additional contribution of small rivers (whose average composition is not accurately known) which border the Amazon River. The reconstituted mean annual composition of small rivers and floodplains (Bustillo, 2007) delivers reliable results for most of the parameters and provides valuable insight on the presumed impact of river processes. Yet, the correction proposed in the model M2, relying on the variable contribution but constant composition of small rivers and adjacent floodplains, unambiguously fails (Figure 2). This may be due to several factors: (1) the area of flooded areas, on which fall direct precipitation, is variable, (2) the biotic transformations undergone by transiting materials are not the same depending if floodplains fill or dry up, and (3) the respective contributions of small rivers draining lowlands (low TDS) and groundwater (high TDS) fluctuate along the hydrological cycle.
c. Hydrograph separation into 3 reservoirs (Model M3)
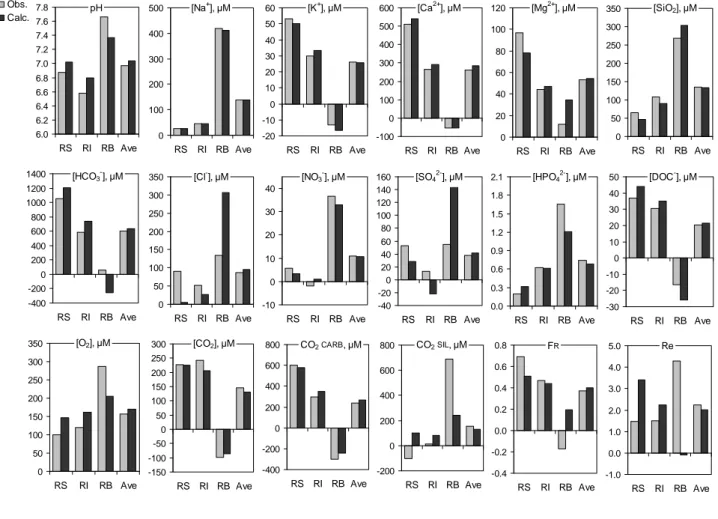
The detailed modelling outcomes relative to M3 are presented in appendix (Table A3). A simple comparison can be made between inputs (calculated) and outputs (observed). Mean values are more accurately examined (Figure
3a and Figure 3b). Observed values are established by averaging the results obtained for 9 sampling stations
(excluding Vargem Grande and Santo Antonio do Iça which are located at – and close to - the upstream boundary) located along the Amazon River main stem. Calculated concentrations (
C
ˆ
i,k) are obtained as follows:[
8]
, 7 , 6 , 5 , 3 , 2 , ,1
/
9
3
2
ˆ
=
×
=+
=+
×
=+
=+
=+
×
j= k i j k i j k i j k i j k i j k i k iC
C
C
C
C
C
C
(16)Notice that: [C]RS x QRS/Qt + [C]RI x QRI/Qt +[C]RB x QRB/Qt = [C]AVE for all the chemical parameters.
The agreement between both data sets is good, except for C/N, DON, HPO42-, CO2, O2 and pH. Despite some unavoidable deviations due to the imprecisions of the chemical analyses and due to simplifying assumptions required for modeling, the repartition of chemical species and isotopic signatures display the same pattern. The compositional contrasts between the 3 reservoirs tend to decrease in the outflow, suggesting that the intermittent storage of water in floodplains contributes to mix waters originating from different sources (hydrological reservoirs, sub-basins). This tends to homogenize their chemical composition at the outlet of the system. The examples provided by CSS, δ18O, DOC (Figure 3b), SO
42- and Cl- (Figure 3a) are particularly explicit. The greatest deviations are observed for the sand fraction CSS whose transport in the Amazonian reach is considerably delayed compared to solutes and water.
Concerning the major chemical species (anions and cations), concentrations in RS and RI tend to be lower in the
outflow: this effect of dilution is very marked for SO42-, Cl-, DOC, Ca2+ and HCO3- (Figure 3a). This is consistent with the biogeochemical balance calculated for the floodplains (Bustillo, 2007) which did not reveal any dissolution of carbonates in Central Amazonia. It is likely that a part of Ca2+ is adsorbed on transiting clay suspensions, fulvic acids and/or goethite (Weng et al., 2005) while HCO3- might be partly converted into CO2 as a result of pH buffering of very acidic waters provided by small Amazonian rivers draining lowlands and Negro river. We observe also a very significant increase of weathering rate in the outflow (see CO2SIL), attributed to the baseflow RB. The consequence is the correlative decrease of the lithological index FR and δ13C (DIC): 9.6 ‰ →
-11.7 ‰. However, the values established for δ13C (DIC) and FR are not totally compatible because a low
contribution of carbonates on DIC release (FR low) should lead to a very negative δ13C (DIC). The unexpected
heavy signature of δ13C (DIC) in the baseflow (Figure 3b) might be the consequence of (1) CO
2 outgassing (Richey et al., 2002) and (2) aquatic photosynthesis, which both subtract preferentially 12C and thus concentrate 13C in the river water.
Focus on the sampling stations of Paurá and Óbidos
The outcomes of end-member mixing model are more particularly analyzed downstream from the confluence of the 8 major tributaries, at the monitoring stations of Paurá and Óbidos (Table 3). Chemical characteristics of the three reservoirs are almost similar for Paurá and Óbidos; they display distributions comparable to those resulting from the conservative mixing of the 8 major tributaries. Even so, the statistical resolution might be deeply altered on
specific parameters for one station and not for the other (e.g. Ca2+, Mg2+ and HCO3-). Small errors of chemical analyses might have large repercussions on the outcomes of the models, especially when the number of samples is low and when the variability of the chemical baseline is moderate. For the sampling stations located at the outlet of large fluvial basins, the compositional fluctuations of the river water are often attenuated, due to the water storage in the floodplains and the slow motion of floodwave which mixes waters having resided for short or long time in the surface network. Even when r2 are low, the model outcomes are qualitatively very instructive to appreciate the dynamics within each reservoir and their heterogeneity. The similarity between the fictitious station (8 Rios) and the sampling stations (Paurá and Óbidos) indicates that the chemical composition (including isotopic composition) of the Amazon River water is essentially acquired before the waters supplied by tributaries reach the Amazonian floodplains. It seems that underlying processes driving biogeochemical budgets (chemical weathering, gas emissions towards the atmosphere, deposition vs. remobilization of sediments, etc) in the tributaries and in the Amazon main reach are of same nature and define comparable chemical equilibria. The large-scale flooding of lowlands, occurring almost concomitantly over Central Amazonia (Hamilton et al., 2002), provides autochthonous organic substrate for decomposition, leading subsequently to the creation of hypoxic and anoxic environments along river corridors. These reductive conditions influence considerably carbon and nutrient cycling due to the enhancement of gas emission (CH4, CO2, NO, N2O, N2) towards the atmosphere and thus determine the isotopic
signature of the dissolved inorganic carbon. The major chemical species released by chemical weathering in upstream reaches, where the bedrock outcrops, and in the floodplains, where coarse unweathered sediments deposit, seem to be transported (almost) conservatively within the river network.
d. Hydrobiological modelling (Model M4)
The analysis focuses more particularly on the sign of the coefficient j i BIO
K
associated to the hydrobiologicalfactor j
k BIO
I
. Model outcomes, on several characteristic parameters and for the 11 monitoring stations of the Amazon profile are represented at Figure 4 (full dataset at Table A4, electronic supplementary material). Chemical responses to hydrobiological factor may be roughly grouped into three categories: (1) ji BIO
K
> 0, indicating that concentrations (or values) increase concomitantly to IBIO, or that concentrations are higher when photosyntheticalpaths dominate; (2) j i BIO
K
< 0, indicating that concentrations (or values) increase when the mineralization prevails on the photosynthesis; (3) ji BIO
K
<< j isignificantly the chemical baseline. Among the parameters varying like j k BIO
I
, we have: pH, K+, NO3-, SO42-, HPO42-, O2, δ13C (DIC), δ13C (POCF) and C/N (3 fractions). Among the parameters varying in the opposite sense, we have: Ca2+, HCO3-, DOC, DIC, CO2, POCF, PONF, PONC, DON. Other parameters do not exhibit any significant and reproducible correlation with jk BIO
I
. A break is observed at Manaús, depending if we locate upstream or downstream from the confluent of Rio Negro. Roughly speaking, there is a loss of Ca2+, Mg2+, K+, HCO3- under photosynthetic regime and conversely a gain of these solutes after the confluent of Rio Negro. Similarly, the decrease of [DOC] is clearly observed downstream from Manaús but remains negligible upstream. When the photosynthetical paths dominate ( jk BIO
I
>> 0), CO2 is removed while O2 is released. As a result, the pH increases and influences the nature and magnitude of abiotic processes. First of all, the biological uptake of CO2 operates a carbon fractionation which tends to make heavier, by mass effect, the value of δ13C (DIC) in the river water. Concomitantly, the decrease of [Ca2+] and [HCO3-] supports the hypothesis that Ca2+ is adsorbed by clay minerals, which releases H+ and leads to the subsequent protonization of HCO3- (which frees CO2). After the confluence of Rio Madeira, the dynamics of Ca2+ is reversed: all other things being equal, [Ca2+] and [HCO3-] tend to increase (photosynthetical path). The rise of pH and/or [O2] related to photosynthetical paths might promote the side-chain oxidation of nitrogenous functions contained in dissolved organic molecules (Aufdenkampe et al., 2001; Aufdenkampe, 2002). Their condensation makes them get more hydrophobic (Tardy et al., 2009), and leads presumably to their sorption onto fine suspended sediments to form diagenetic POCF. The rise of POCF/PONF and POCC/PONC reflects the genesis of autochthonous molecules which progressively obliterates the signal of soil-derived substances. Actually, riparian grasses and floating aquatic plants which grow in the floodplains exhibit high atomic ratio C/N, evaluated to 42 by Victoria et al. (1992), suggesting that the uptake of NO3- is rather low and does not counter-balance totally the input associated to the sorption of DOM. However, the most significant rise is observed for [DOC]/[DON] due to the diagenesis of DOM which tends to release NO3- and to concentrate carbon in DOM.Conversely, when the mineralization paths prevail on photosynthesis ( j i BIO
K
<< 0), low 13C/12C source of DIC is released in the river while O2 is consumed. The chemical signals associated to mineralization are, roughly speaking, symmetrical to those imprinted by the photosynthesis. The Andean soil-derived POCC, mainly mobilized in surface runoff, is exposed to increasing temperature as transported downstream and subjected to mineralization in lowland environments (McClain et al., 1995). This source of unstable carbon provides significant amount ofcarbon substrate that fuels the heterotrophic metabolism of the river, after deposition of large quantities of carbon. In addition to allochthonous POCC, the mechanism locally named “terras-caídas” corresponding to the large-scale bank erosion during flood periods (Irion et al., 1997), promotes the large-scale destruction of well developed floodplain forest communities (Junk and Piedade, 1997) and provides large amounts of highly unstable organic substrate. The contribution of grass várzeas to the carbon budget of floodplains, appreciated by the isotopic composition of várzea sediments (Victoria et al., 1992; Martinelli et al., 2003), increases as we move downstream. This suggests that the impact of aquatic vegetation on the carbon budget of floodplain progressively increases (Quay et al., 1992). Owing to preservation mechanisms during decomposition (such as adsorption-linked protection), the fine fraction POCF is clearly refractory: j
i BIO
K
<< [POCF] AVE, and does not appear to besignificantly influenced by in-stream mineralization.
e. The composite approaches (M5 and M6)
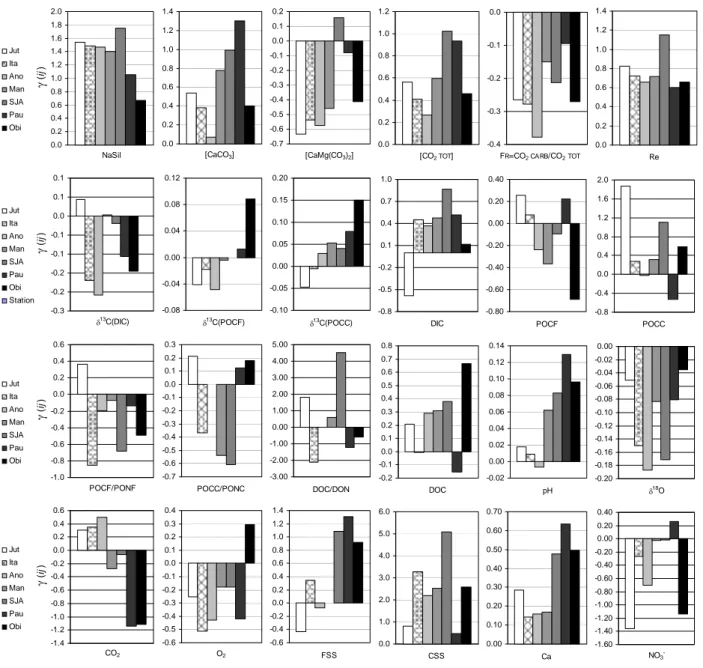
The model M5 exhibits an unexpected high performance, for all monitoring stations and all chemical parameters, as shown in appendix (Table A5). The reconstitution of isotopic signatures is very convincing for δ18O (SMOW) and δ13C (DIC) while the lowest levels of confidence are observed for POCC, CSS, PONC and C/N atomic ratios for POCC and POCF. The significant improvement compared to M1 and M3 denotes the influence of floodplains on the chronological variations of the Amazon River composition, mainly due to (1) the polarity of water circulation in the floodplains, and (2) to the variable contribution of each individual runoff to the water budget of floodplains. The chemical response of river to the polarity of water circulation in the floodplains can be approached by analysing the magnitude and the sign of j
i
γ
(cf. Eq.13) corresponding to the variation of concentration in the river water associated to the water balance of floodplains jk
Qt
Δ
. The complete data set compiling the values ofj i
γ
is supplied in the electronic supplementary materials (Table A5); several selected values are represented atFigure 5. Despite some variations between stations, the magnitude and the sign of
γ
ij match quite well. Themodel M5, taking into account simultaneously the following variables: j k
Qt
Δ
, ΔQRS/Qt and ΔQRI/Qt, althoughproviding reliable outcomes, might sometimes be difficult to interpret, notably because of covariations between variables. For example, j
k
Qt
floodplains involves principally the hydrological reservoir RI. Moreover, the simple interpretation of
γ
ij does notallow investigating the additional impact of the river flow, whose magnitude influences floodplain dynamics. To facilitate the deciphering process, the model M6 was implemented. The calibration of the four parameters (see Eq.15), leads to the determination of 3-D diagrams with spatial representation realized for 600 mm.yr-1 ≤ j
k
Qt
≤ 1600 mm.yr-1 (average = 1 122 mm.yr-1) and -0.05 ≤ jk
Qt
Δ
≤ 0.30 (average = 0.134). These figures, available infull in appendix (Figure A2) for the station of Óbidos, represent the variations of concentration (or isotopic value) as a function of the river outflow, and as a function of the water balance of floodplains, tracked by j
k
Qt
Δ
. Themean concentration of each parameter, calculated in the inflow (for 8 cruises), is centred on j k
Qt
= 1 122 mm.yr-1and j
k
Qt
Δ
= 0.134. The isolines represent the changes of chemical characteristics as we stray from the centralpoint, assuming that the chemical composition of the inflow remains constant whatever j k
Qt
and jk
Qt
Δ
. In thissection, the objective is not to predict the chemical composition of the outflow but rather the deviation to the inflow. As a consequence, the following diagrams must be read and interpreted only in terms of relative values. On each diagram are identified the main sequence of hydrological cycle : (1) lowest waters, characterised by low Qt and excess of outflow → (2) rising waters, exhibiting intermediate Qt and a severe deficit of outflow → (3) highest waters, with high Qt and moderate deficit of outflow → (4) falling waters, with intermediate Qt and excess of outflow → (1) lowest waters.
1) M
AJOR CHEMICAL SPECIES AND CHEMICAL WEATHERINGConcerning the major chemical species, a dilution effect is observed during the phase of water storage while concentrations rise when the waters stored in the floodplains join back the main channel. The influence of the circulation polarity is greater after the confluence of Rio Japurá, as the Amazon valley widens. Considering the poles of chemical erosion, it is noticeable that the apparent rate of chemical alteration is substantially greater (both for silicates and carbonates) when the floodplains empty, with the exception of dolomite, all other things being equal (Figure 5). On the average, the lithological index FR (cf. list of parameters) exhibits lower values during the
emptying of floodplains. It suggests that submerged low plains drain areas where the alteration of sedimentary minerals mimics the weathering of crystalline rocks. It is likely that chemical weathering in floodplains manifests itself sequentially, when the floodplains dry up i.e. when the water stored in low plains joins back the main
channel. Following Johnsson & Meade (1990), these model outcomes support the idea that the chemical weathering of the additional flow is mainly driven by the diagenesis of unweathered sediments, deposited during the filling of floodplains (Martinelli et al., 1993). The decrease of lithological index FR during the emptying of
floodplains coincides with lower δ13C (DIC), compared to the stage of filling (Figure 6a). The parallel evolution of δ13C (DIC) and F
R confirms that the isotopic signal of dissolved inorganic carbon is fundamentally determined by
the pattern of weathering processes (synthesized by FR). Because of the hydrological dynamics of floodplains,
following an annual immutable cycle, the chemical expression of weathering processes is sequential as well. It should also be noticed that the index Re (SiO2/Al2O3 in altered products inferred from the chemistry of river water, Tardy et al., 2004) is much higher during the emptying of floodplains, suggesting that SiO2 might be picked up and converted into a particulate form due to the growth of diatoms which is encouraged in adjacent lakes and flooded areas.
2) B
UDGET OF SEDIMENTSThe sand fraction CSS exhibits systematically lower concentrations during the phase of water storage ( j i
γ
are all positive at Figure 5) than during the emptying stage (Figure 6b). This result supports the idea that the sediments tend to deposit as the river inundates the low plains and tend to be remobilized as the extension of submerged areas lessens. The greatest contrasts are observed between Itapeua and São José da Amatari and the lowest is accredited to Paurá, after the confluence of Rio Madeira which provides large amounts of coarse sediments. The trends for the silt-clay fraction are less explicit. Considering the silt-clay fraction FSS, no clear tendency can be outlined on the Vargem Grande-Manacapurú reach. In turn, between São José da Amatari and Óbidos, the pattern is very similar to the one described for CSS, suggesting that the flushing action of Negro River (Meade et al., 1985; Dunne et al., 1998) might promote the remobilization of fine sediments when the floodplains drain.3) R
IVER METABOLISMConsidering the gaseous composition of the river, the computed j i
γ
indicate higher [CO2] during the emptying of flooded area on the upstream reach and lower [CO2] on the downstream reach (from Manacapurú to Óbidos). All other things being equal, pH appears to be higher during the emptying of floodplains while [O2] is lower.Considering nitrogenous species, the evolutions are the following: while the floodplains dry up, a generalized drop of [NO3-] and a gain of [PONC] and [DON] are observed, with the exception of Paurá and São José da Amatari where sorption processes of dissolved organic matter arise (Aufdenkampe et al., 2001; Tardy et al., 2009).
Considering organic carbon species, j i
γ
highlight a gain of POCF and POCC during the emptying of floodplains and conversely a deficit of DOC. The major exception corresponds to the station of Paurá, highly influenced by the forwarded contribution of Rio Madeira which reverberates directly on the chronological evolution of processes. As the waters stored in the floodplains join back the main channel, the atomic ratio POCF/PONF rise whereas DOC/DON and POCC/PONC drop drastically. The drift observed along the Amazon profile involves the increasing contribution of submerged areas to the water budget of the Amazon River, as we move downstream. This amplifies the imprint of river diagenesis on the organic matter. As heterotrophic processes operate more and more intensely, the maturation of organic matter is accelerated and leads to lower and lower POCF/PONF in the water draining floodplains. The effects of these processes on the isotopic signature of carbon are not appreciable. Concerning POCC, the concentrations tend to be higher during the emptying of the floodplains. The effects on the isotopic signal of δ13C (POCC) are noticeable, leading unequivocally to 13C enriched signature when the water stored in floodplains rejoins the main channel (Figure 6c). The presumed influence of aquatic grasses, whose isotopic signature is heavy (-13 ‰, according to Victoria et al., 1992), on the isotopic composition of POCC, seems to be confirmed here.The amounts of DOM, both those observed at Óbidos and those reconstituted by modelling (model M6) exhibit a drastic decline of [DON] and a correlative increase of [DOC] / [DON] when the inundation of the floodplains occurs, i.e. during rising water stage. At this stage, the chemical nature of DOM, mobilized by surface runoff (Tardy et al., 2005), is mainly soil-derived and refractory (Hedges et al., 1986). Low C/N molecules, conveyors of positive charge (e.g. amino-acids) or hydrophobic (humic acids), are recognized to be the best candidates to sorption onto fine sediments (Aufdenkampe et al., 2001), leading subsequently to rising C/N in the remaining DOM fraction. Conversely, the emptying of floodplains coincides with a rise of [DOC] and [DON] and a decrease of [DOC]/[DON]. This supports the idea that additional DOC and DON observed during the emptying of floodplains is autochthonous, is released by the decay of aquatic biomass which contains high proportion of amino acids (low C/N) compared to soil-derived DOM (Hedges et al., 1994). The high variability of C/N tends to confirm that along a complete hydrological cycle, distinct pools of molecules (allochthonous soil-derived vs. autochthonous
river-derived), exhibiting contrasted reactivity and very dissimilar elemental composition, are exported by the Amazonian rivers (Amon & Benner, 1996a; Amon & Benner, 1996b).
5. Summary and concluding remarks
The six hydrochemical models which were tested provide a valuable insight on the main factors (hydrological source, water budget of the floodplains, nature of hydrobiological pattern i.e. photosynthesis vs. mineralization, air-water gaseous exchanges, etc) controlling the biogeochemical and sedimentary budgets of the Amazonian floodplains. The influence of floodplain and additional flow (small rivers, alluvial groundwater, direct precipitation) could be set in evidence for most of studied parameters (Bustillo, 2007). Unfortunately, due to lack of reliable data concerning the water chemistry of small tributaries, the influence of variable additional input (involving variable contribution of small rivers and alluvial groundwaters to the river flow) cannot be distinguished from the effects of the diagenesis operating in the floodplains. At the light of the results provided by the six mixing models, 3 main issues dealing with the biogeochemistry and hydrology of the floodplains are addressed:
(1)- Coupling between sediment deposition and biogeochemical diagenesis;
(2)- Organic metabolism of the river and its effects on the nature and intensity of biotic processes;
(3)- Nature and intensity of abiotic processes, involving notably the sorption of DOM, the evaporation of wetlands and the river outgassing;
A companion paper (Bustillo et al., submitted to Earth Interactions) aims to investigate more in detail these 3 topics which are intrinsically related and which determine most of the biogeochemical budget relative to Amazonian floodplains.
The magnitude and polarity of water exchanges between the Amazon River and its floodplains strongly influences the sedimentary and chemical signals measured in the river waters. The floodplains constitute widespread sites where major biotic and abiotic processes affecting the dynamics of transiting materials occur: sedimentation, remobilization of sediments, organic matter decay, CO2 outgassing, etc.
Unexpectedly, the chemical trends observed upstream are sometimes accentuated downstream, as shown by the model M1. It supports the idea that the processes operating downstream are of same nature than those occurring upstream, prolonging therefore the imprint given by upstream rivers to the chemical baseline. Due to the increase in floodplain size as we move downstream, the impact of floodplain filling and draining on the biogeochemical qualities of the water are therefore amplified downstream. Taking into account the additional contribution of
ungauged areas, using ad-hoc constant characteristics to close the river budget (model M2) does not improve the performance of modelling compared to the simplest possible model M1. It means that the composition of the “additional” flow is probably very variable, more particularly because the alluvial groundwaters draining unweathered sediments deposited alongside the Amazon River (high TDS) and the small tributaries draining thick-sandy soils (intensively leached, low TDS) do not contribute synchronously to the river flow (Bustillo, 2007) and exhibit very distinct chemical characteristics.
The mixing model M3 sets in evidence a decrease of compositional differences between hydrological reservoirs as we move downstream. This homogenization might be the result of the mixture of waters having resided more or less durably in the hydrographic network. The main differences between incoming and outgoing compositions is attributable to the baseflow RB, and to a lesser extent, to the delayed direct runoff RI. This would be the result of
in-stream biogeochemical processes: the aquatic photosynthesis impacts RB whose contribution to river flow is
maximum during lowest waters stage i.e. when autotrophic regime prevails, while organic matter decay impacts more particularly RI (↑ CO2, ↓ pH, ↓ O2, ↓ δ13C-DIC, ↓ DON, ↓ DOC et ↓ DOC/DON) whose contribution is
maximum when the emptying of floodplains (where heterotrophic regime prevails) occurs.
The model M4, also based on variable hydrological source, involves the hydrobiological index
[ ] [
]
j k j k j k BIO O COI = 2 − 2 , used as a tracer of autotrophic vs. heterotrophic regime. This improves considerably the
performances of the simulations, compared to M3. The model M4 enables to (1) identify the parameters significantly influenced by in-stream processes and (2) to determine their response depending on the nature and magnitude of hydrobiological regime. Globally speaking, the hydrobiological regime promotes large variations of pH and [O2] which have direct repercussions on the biodynamics of other chemical variables. The autotrophic regime is dominant (IBIO > 0) during lowest waters stage, when (1) the river turbidity is minimum, (2) when the
river-floodplain connectivity is interrupted and (3) when the rate of incoming solar radiation reaching the water body is maximum (flow concentrated within the well-exposed main channel). The rises of pH and [O2] directly induced by aquatic photosynthesis coincide with losses of organic nitrogen to the benefit of mineral nitrogen, increase of 13C/12C for DIC (isotopic fractionation induced by aquatic photosynthesis), and losses of Ca2+ and HCO3-. The heterotrophic regime is dominant over the annual cycle, except during lowest waters stage. The heterotrophic signal is hugely amplified when the waters stored in the floodplains rejoin the main channel. Falling waters constitute privileged moments to appreciate the biogeodynamics of the floodplains, because their discharge in the main channel is intermittent. The decrease of pH and [O2] related to the heterotrophic regime coincide with
increase of [CO2], decrease of δ13C(DIC), decrease of [DOC]/[DON] and rise of δ13C(POCC) which is interpreted as the result of the sequential release of autochthonous carbon (C4 aquatic grasses).
The models M5 and M6 enable to test more specifically the impact of floodplains water balance (filling vs. emptying) on the differences of chemical concentrations between the tributaries and the Amazon River. This test appears to be very conclusive, setting in evidence that chemical signals observed in the Amazon River waters are thoroughly influenced by the magnitude and polarity of water exchanges between the Amazon River main channel and its floodplains.
List of parameters
Indexes: i stands for chemical species, j for the sampling station and k for the number of the sample.
Hydroclimatic features
RS: forwarded direct runoff; RI: delayed direct runoff; RB: baseflow
QK: discharge of each individual runoff with K standing for RS, RI or RB.
Geochemical characteristics (see Tardy et al., 2004, for full details)
Re = SiO2 / Al2O3 in altered products. Stoechiometry of clays formed by chemical weathering. CO2CARB = CO2 consumed by the alteration of carbonated rocks.
CO2SIL = CO2 consumed by the alteration of crystalline rocks.
CO2TOT = CO2SIL + 2.CO2CARB. DIC released by geochemical alteration.
FR = CO2CARB / CO2TOT. Lithological index = part of DIC originating from the dissolution of carbonates. WR = Chemical weathering rate (m.Ma-1).
F CO2 = Rate of CO2 consumption (TC.km-2.a-1).
Hydrochemical modelling
j k BIO
I
= Hydrobiological index based on the gaseous composition of the river water.j i BIO
(
)
j kQt
Qt
Δ
= index of hydrograph stage (>0 during rising water, <0 during falling water and =0 for highestwaters and lowest waters).
1
,−
=
Δ
j k tot j k j kQt
Qt
Qt
= water balance of floodplains (<0 if filling and >0 if emptying). ji
α
: variation of concentration in the river water associated to the variation of QRS/Qt in the main channel.j i
β
: variation of concentration in the river water associated to the variation of QRI/Qt in the main channel.j i
γ
: variation of concentration in the river water associated to the water balance of floodplains j kQt
Δ
.j i
δ
: residual variation of concentration in the river water, for ΔQRS/Qt = ΔQRI/Qt = ΔQt = 0.Acknowledgements
This work was funded by the Brazilian FAPESP agency by way of a post-doctoral fellowship (no 2005/58884-5) associated to the project entitled “A large-scale synthetic model applied to the hydroclimatology and eco-geodynamics of the Amazon River basin”. This study benefited from insightful comments from 2 anonymous referees whose very careful review and far-reaching vision contributed indeed to improve substantially the quality of the language and the clarity of the thinking.


![FIG. 4. Influence of the hydrobiological regime, appreciated by K BIO i j / [i] Ave,8R for 12 chemical parameters (noted i) at the 11 sampling stations (noted j) over the Amazon River longitudinal profile: Vargem Grande (VG), Santo Antonio do Iça (SA](https://thumb-eu.123doks.com/thumbv2/123doknet/14710737.567484/37.892.96.782.106.585/influence-hydrobiological-appreciated-chemical-parameters-sampling-stations-longitudinal.webp)
![FIG. 6. Mean simulated variations of (a) δ 13 C (DIC), (b) [CSS] and (c) δ 13 C (POCC) as a function of the river outflow (Qt) and the floodplain water balance FWB = Δ Qt kj = Qt kj , obs Qt totj , k − 1](https://thumb-eu.123doks.com/thumbv2/123doknet/14710737.567484/39.892.246.653.98.879/mean-simulated-variations-pocc-function-outflow-floodplain-balance.webp)