HAL Id: inserm-00117195
https://www.hal.inserm.fr/inserm-00117195
Submitted on 4 Sep 2009
HAL is a multi-disciplinary open access archive for the deposit and dissemination of sci-entific research documents, whether they are pub-lished or not. The documents may come from teaching and research institutions in France or abroad, or from public or private research centers.
L’archive ouverte pluridisciplinaire HAL, est destinée au dépôt et à la diffusion de documents scientifiques de niveau recherche, publiés ou non, émanant des établissements d’enseignement et de recherche français ou étrangers, des laboratoires publics ou privés.
mining area in France.
Marie-Gabrielle Dondon, Florent de Vathaire, Philippe Quénel, Nadine Fréry
To cite this version:
Marie-Gabrielle Dondon, Florent de Vathaire, Philippe Quénel, Nadine Fréry. Cancer mortality during the 1968-1994 period in a mining area in France.. European Journal of Cancer Prevention, Lippincott, Williams & Wilkins, 2005, 14, pp.297-301. �inserm-00117195�
Acknowledgments : We are grateful to Bertrand Javelaud for his helpful contribution to this work and to Lorna Saint Ange for editing.
Cancer mortality during the 1968-1994 period in a mining area in France.
Running title : Cancer mortality (1968-1994) in a mining area.
Marie-Gabrielle Dondon1 MSc, Florent de Vathaire$1 PhD, Philippe Quénel2 MD PhD, Nadine Fréry2 PhD
1 INSERM U605, Institut Gustave-Roussy, Villejuif, France
2 National Institute for Public Health Surveillance (InVS), Department of Environmental Health, Saint Maurice, France
$ Corresponding author: Florent de Vathaire
INSERM U605 – Institut Gutave-Roussy – 39, rue Camille Desmoulins - 94805 Villejuif - France.
Tel : 01 42 11 54 57 – Fax : 01 42 11 53 15 – E-mail : fdv@igr.fr
Abstract
We performed a geographical analysis of cancer mortality in the communes surrounding an industrial mining complex (Salsigne, France) where suspicious levels of pollution due to arsenic were measured.
Compared to that observed in a control area, we showed a significant excess of mortality due to all cancer types (SMR ratio=1.1), lung cancer (SMR ratio=1.8), pharynx cancer (SMR ratio=2.1) in the whole population, and due to digestive system cancer (SMR ratio=1.3) among women. The results were similar after controlling for the occupation distribution in the populations. Excluding mining complex workers deaths from the deaths in the studied populations did not modify the pattern of our results.
We concluded that the excess of cancer deaths could not be exclusively due to potential professional exposures among the workers of the mining complex and are probably explained by environmental contamination.
Key words
cancer mortality - environmental study - geographical study - lung cancer - metal industry.
Introduction
The La Combe du Saut industrial mining complex has been in the Salsigne area (south of France), in the Orbiel river valley, for many years. Mining operations have been carried out as well as pyro-metallurgy and hydro-metallurgy of gold, sulphur and arsenic ore.
A historical study of a cohort of workers at this industrial mining complex revealed an excess of lung cancer mortality, but was not able to control for smoking habits and other potential confounding factors (Simonato et al. 1994).
Metrological campaigns have for many decades, signaled suspicious levels of pollution due to arsenic in the Orbiel river, in crops, and in the atmosphere of the surrounding communes. Collective arsenic-induced intoxications due to atmospheric pollution in 1937, and to pollution of the Orbiel river in 1970 occurred in the surrounding communes (Javelaud 1994). Recently, arsenic levels were measured: 60 μg/l in the Orbiel river, 110 to 150 mg/kg in Orbiel alluvium and 300 mg/kg in the soil in the surrounding communes (Internet 2000).
A cancer incidence study could not be performed because none of the existing cancer registries cover this area. We decided to study cancer mortality in this area for the following reasons : the ancestry of potential exposure, the fact that the causes of deaths have been recorded in « communes » (French electoral ward, smallest administrative area in France) in France since 1968, and the stability of this predominantly rural population.
Material and methods
DATA
Salsigne is located in the Aude « département » (main administrative division of France), in the south of France.
The initial causes of death due to cancer from 1968 to 1994 by sex, year, 5-year age categories and commune of residence at the time of death were obtained from the « Institut National de la Santé et de la Recherche Médicale » (INSERM). No data were available in France before this period.
Census data by commune for 1968, 1975, 1982, 1990 and 1999 were obtained from the « Institut National de la Statistique et des Etudes Economiques » (INSEE). The population was estimated from these data by linear interpolation, each year from 1968 to 1994 in each commune.
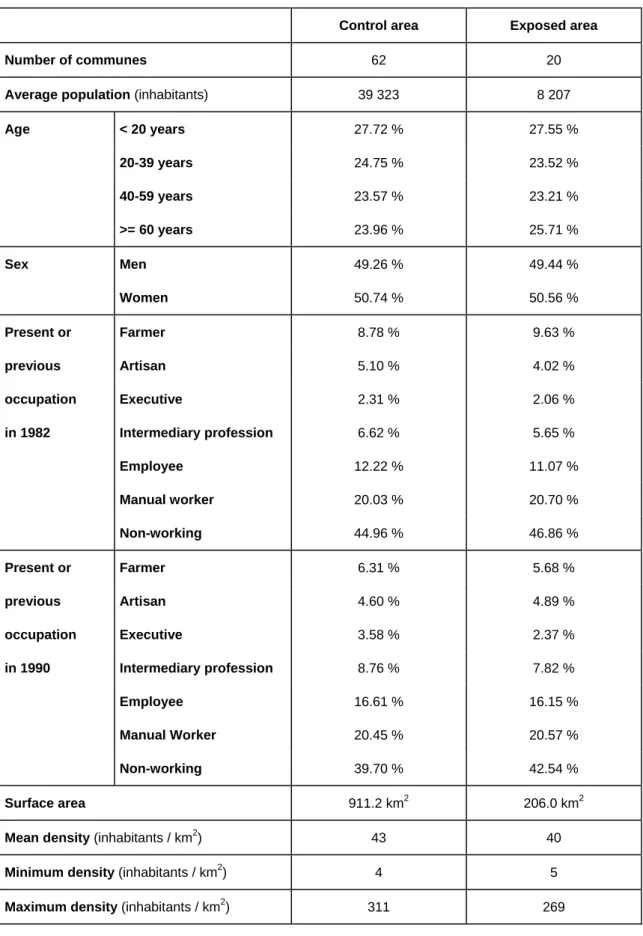
We obtained the distribution of occupations (farmer, artisan, executive, intermediary profession, employee, manual worker and non-working) for each commune from INSEE, for the 1975, 1982, 1990 censuses, as a percentage of the whole population in the commune. The previous occupations of retired people were not available for the 1975 census. As cancer is a disease that mainly affects the elderly, we did not take into account the distribution of occupations in this census. As shown in Table 1, the distribution of occupations of employed or retired persons at the time of the census did not vary significantly between 1982 and 1990. We therefore decided to take into account only the distribution of occupations at the time of the 1982 census, in the middle of the period studied (1968-1994).
We also obtained the cases of death due to lung cancer that occurred in the historical cohort study of mining complex workers performed by IARC (Simonato et al. 1994). These data included the date of birth and of death, as well as the place of birth of each of the 36 workers who died of lung cancer in this cohort. Using these data, we obtained the commune of residence at the time of death of 32 of these 36 workers.
ANALYSIS
To test the probability of an increase in cancer mortality in and around Salsigne, we defined an exposed area and a control area. The cancer mortality observed in these areas was compared to that expected from overall cancer mortality in France. Standardized mortality ratios (SMR) were thus obtained. SMR confidence intervals were calculated with the exact method (Breslow and Day 1987).
The SMR in the exposed area was then compared to that of the control area, by estimating the ratio of the SMR. As the confidence interval of a ratio of the SMR cannot be calculated analytically, we performed simulations. The observed numbers of cancers in both the exposed and the control areas were supposed to follow Poisson distribution. For each SMR ratio, 100 000 couples of values were simulated and their ratios were calculated. The 2500th and the 97500th of these ratios, classified in ascending order, were retained as the lower and upper limits of the 95 % confidence interval of the SMR ratio.
The exposed area was defined as all the communes surrounding the La Combe du Saut industrial site. The exposed area covers approximately 206 km2 and the industrial site is situated in the Orbiel river valley, in the heart of the exposed area.
The average population density in this exposed area was 40 inhabitants / km2, with a maximum of 269 inhabitants / km2.
We chose a control area in close proximity to the exposed area with a similar age structure, sex ratio and socio-economic status. It encompassed all the communes within 20 km of Salsigne, that had not previously been included in the exposed area, with the exception of Carcassonne, Aussillon and Mazamet, which are intermediate cities with respectively 42351, 7847 and 13102 inhabitants. The average population density in the control area was 43 inhabitants / km2, with a maximum of 311 inhabitants / km2.
We defined three time periods (1968-1975, 1976-1985, 1986-1994) in order to study the evolution of cancer mortality over time.
To verify the specific role of environmental contamination, we restricted our analysis to the adult male population and to the period covered by the IARC study (1972-1987) (Simonato et al. 1994).
As occupations exert a strong influence on the death rate for multiple cancer sites, we adjusted for occupations by introducing the proportion of each type of occupation as a co-variable in a Poisson regression model.
Results
The general characteristics of the exposed and control areas and of their respective population are described in Table 1. Similar ages, occupations and population densities were observed.
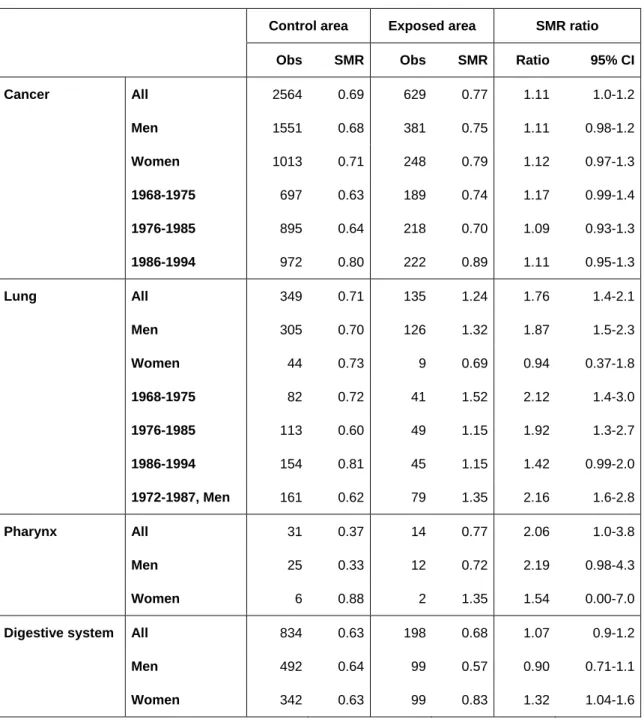
From 1968 to 1994, 629 people died of cancer in the exposed area compared to 818 expected from overall cancer mortality in France (SMR = 0.77, 95% CI: 0.71 to 0.83). The SMR in the control area was 0.69 (95% CI: 0.67 to 0.72). A deficit of cancer mortality was therefore demonstrated in the two areas, as compared to the national level. The ratio of the SMR between the exposed area and the control area was 1.1 (95% CI: 1.0 to 1.2). This corresponded to a significant excess of cancer mortality of 11% in the exposed area compared to the control area. This excess was not contingent on sex and was higher between 1968 and 1975 (ratio of SMR = 1.2, 95% CI: 1.0 to 1.4) than between 1976 and 1985 (ratio of SMR = 1.1, 95% CI: 0.9 to 1.3) and between 1986 and 1994 (ratio of SMR = 1.1, 95% CI: 1.0 to 1.3) (Table 2). There was an excess of 8 deaths due to cancer in Lastours, a commune in the center of the exposed area (SMR = 1.4, 95% CI: 0.9 to 2.0).
Compared to mortality in France, a significant 20% excess of lung cancer mortality (SMR = 1.2, 95% CI: 1.0 to 1.5) in the exposed area and a significant 30% deficit (SMR = 0.7, 95% CI: 0.6 to 0.8) in the control area were demonstrated. This corresponded to a significant excess of mortality of 80% (ratio of SMR = 1.8, 95% CI: 1.4 to 2.1) in the exposed area compared to the control area, that was higher among men (ratio of SMR = 1.9, 95% CI: 1.5 to 2.3) than among women (ratio of SMR = 0.9, 95% CI: 0.4 to 1.8), but not significantly (p=0.08). This excess of lung cancer mortality decreased significantly over time periods: it was higher between 1968 and 1975 (ratio of SMR = 2.1, 95% CI: 1.4 to 3.0) than between 1976 and 1985 (ratio of SMR = 1.9, 95% CI: 1.3 to 2.7) and between 1986 and 1994 (ratio of SMR = 1.4, 95% CI: 1.0 to 2.0) (Table 2). All the SMR for lung cancer higher than 1.6 were observed in the exposed area, with the exception of one commune.
A significant 110% excess of pharynx cancer mortality (ratio of SMR = 2.1, 95% CI: 1.0 to 3.8) was observed in the exposed area compared to the control area (Table 2).
A significant 30% excess of digestive system cancer mortality (ratio of SMR = 1.3, 95% CI: 1.0 to 1.6) was observed among women in the exposed area compared to the control area. This excess was not seen among men (Table 2); the interaction between the effect of sex and the area was significant (p=0.02). As shown in table 4, this excess concerned non significantly all digestive cancers individually except cancer of the pancreas and of the esophagus.
In a Poisson regression model, the proportion of the non-working population was associated with an increased risk of lung cancer mortality (p=0.05), but no specific job category was associated with a significant effect on the risk of death due to this cancer type. No significant relation was observed between the proportion of inhabitants in any job category in 1982 and the risk of death for all cancers and pharynx cancer. Taking into account the percentage of the population in each commune in each job category did not modify our results concerning the excess of death observed in the exposed area. In particular, adjustment for the proportion of manual workers did not modify the ratio of SMR for all cancer types (ratio of SMR = 1.1, 95% CI: 1.0 to 1.2), lung cancer (ratio of SMR = 1.8, 95% CI: 1.4 to 2.1) and pharynx cancer (ratio of SMR = 2.1, 95% CI: 1.1 to 3.9).
Discussion
We performed a geographical analysis of cancer mortality by commune from 1968 to 1994, in the Salsigne region in the south of France, where high environmental levels of arsenic have been measured. We showed a significant excess of 62 deaths due to cancer (95% CI: 12 to 109), compared to a control area. There was a significant excess of mortality due to lung and pharynx cancer in the whole population and due to digestive system cancer among women. Our results were not modified when the proportions of manual workers in each commune were taken into account.
Although animal studies have been largely negative, a causal relation has been demonstrated between arsenic and cancer in humans, through respiratory exposure or through ingestion in drinking water (Hayes 1997). As regards its potential carcinogenicity, the IARC has classified arsenic in category 1, i.e. as « carcinogenic to humans » (IARC 1987).
In general, geographical studies are few powerful because, in such studies, it is not possible to perform individual adjustment on potentially confounding variables such as smoke and dietary habits, particularly if they are focused on lung and digestive cancer. Nevertheless, it is noteworthy that the control area we chose was very similar to the exposed area in terms of age, sex, population density, and professional status. In France, in addition to a north east-south west gradient, such variables are the major determinants of smoking habits (Salem et al. 1999). Although we were not able to obtain information about such habits in the exposed and control areas, the differences are probably very small. Similarly, in a given geographical area, age, sex, population density and the professional status are the
major determinants of dietary habits. In addition, adjustment on the professional status did not modify our results. Thus, our results could hardly be attributable to differences between exposed and control areas concerning geographical and demographical risk factors, which play a role in lung and digestive cancer.
Only a small number of women worked in the mining complex. Thus, the significant excess of digestive cancer mortality observed among women cannot be explained by occupational exposure and is possibly explained by environmental contamination.
When our analysis was restricted to the adult male population and to the period covered by the IARC study (1972-1987), we obtained a deficit of cancer mortality (SMRall cancer=0.7, 0.6-0.8) and an excess of lung cancer mortality (SMRlung cancer=1.4, 95%CI=1.1-1.7) in the exposed area as compared to the national level.
These SMR were lower than those observed in the IARC study (SMRall cancer=0.8,
0.7-0.9 and SMRlung cancer=2.1, 95%CI:1,5-3,0) (Simonato et al. 1994).
During the 1972-1987 period, we found an excess of 42 deaths (95% CI: 31-51) due to lung cancer among men in the exposed area compared to the control area. During the same period, a total of 36 male workers from the IARC workers cohort died of a lung cancer, of whom 23 had lived in the exposed area, 3 in the control area, 4 in the city of Carcassonne which was in the excluded area, and 2 in another area. The place of death was unknown for 4 of them. The IARC cohort study included all the men who worked for more than 1 year after 1954 and were alive and not lost to follow-up before 1972, i.e. 1363 workers (Simonato et al. 1994). We did not know the total number of workers who lived in the exposed area and hence are not able to compute the lung cancer SMR for the exposed area,
excluding the workers from the mining complex both from the number of deaths and from the populations at risk. Nevertheless, the excess of lung cancer we observed in the exposed area would necessarily remain significant when these workers are excluded.
Indeed, when all the 27 deaths due lung cancer in workers who may have lived in the exposed area were excluded (certainly = 23, place of death unknown = 4), 52 (= 79-27) deaths due to lung cancer observed in the exposed area were not potentially linked to occupational exposure in mines. Of these 52 deaths, 15 could be considered in excess (95% CI: 1 to 25), as compared to the 37 deaths expected from control area.
This excess number is an underestimation of the true excess, because workers were not eliminated from populations. Indeed, from a sub-cohort of 256 gold miners, we estimated that the workers from the mining complex represented probably about 20% of the population in the exposed area, but 4% of that in the control area. Thus the rate in the exposed area has been lowered by about 20%, but of 4% in the control area, and then the expected number (37) has probably been overestimated of about 17%.
The strong excess of lung cancer death we observed was specific of men, but, due to the rarity of this cancer in women, the difference of SMR between sexes was not significant (p=0.08). Our results is in agreement with that of Besso (Besso et al. 2003) and Chen (Chen and Ahsan 2004) who evidenced lung cancer excess risk higher in men than in women. If not due to hazard, two possible explanations remain: specific susceptibility of men, or interaction with other risk factors more frequent in male population, for example smoking.
In conclusion, an excess of deaths due to lung, pharynx and digestive system cancers was observed in a predefined area encompassing the mining complex of Salsigne, as compared to that observed in a similar control area situated in close proximity. The excess of deaths due to lung cancer among men and to digestive cancer among women could not be exclusively due to potential occupational exposures among the workers at the mining complex and are possibly explained by environmental contamination.
Reference List
1. Simonato L, Moulin JJ, Javelaud B, et al. A retrospective mortality study of workers exposed to arsenic in a gold mine and refinery in France. Am J Ind Med. 1994;25:625–33
2. Javelaud B. Arsenic et dérivés. - Editions Techniques – Encycl. Méd. Chir. (Paris, France), Toxicologie, pathologie professionnelle, 16-002-A-30, 1994, 7p.
3. Syndicat intercommunal pour l'aménagement hydraulique des bassins de l'Orbiel et du Trapel. Etude pour un Bilan Environnemental de la Vallée de l'Orbiel. September 2000. Available:
http://www.languedoc-roussillon.drire.gouv.fr/publications/orbiel/index.html [accessed 20 May 2004]. 4. Breslow NE, Day NE. Statistical methods in cancer research. Vol 2. The design
and analysis of cohort studies. IARC 1987.
5. Salem G., Rican S., Jougla E. Atlas de la santé en France. Vol. 1- Les causes de décès. Paris : John Libbey Eurotext, 1999. 190 p.
6. Hayes RB. The carcinogenicity of metals in humans. Cancer Causes Control. 1997;8:371-85.
7. IARC. Overall evaluations of carcinogenicity: an updating of IARC Monographs volumes 1 to 42. IARC Monogr Eval Carcinog Risks Hum 1987; Suppl 7: 1-440.
8. Besso A, Nyberg F, Pershagen G. Air pollution and lung cancer mortality in the vicinity of a nonferrous metal smelter in Sweden. Int J Cancer. 2003 Nov 10;107(3):448-52.
9. Chen Y, Ahsan H. Cancer burden from arsenic in drinking water in Bangladesh. Am J Public Health. 2004 May;94(5):741-4.
Table 1: General characteristics of the exposed and control areas and of their respective population during the 1968-1994 period.
Control area Exposed area
Number of communes 62 20
Average population (inhabitants) 39 323 8 207
Age < 20 years 27.72 % 27.55 % 20-39 years 24.75 % 23.52 % 40-59 years 23.57 % 23.21 % >= 60 years 23.96 % 25.71 % Sex Men 49.26 % 49.44 % Women 50.74 % 50.56 % Present or Farmer 8.78 % 9.63 % previous Artisan 5.10 % 4.02 % occupation Executive 2.31 % 2.06 % in 1982 Intermediary profession 6.62 % 5.65 % Employee 12.22 % 11.07 % Manual worker 20.03 % 20.70 % Non-working 44.96 % 46.86 % Present or Farmer 6.31 % 5.68 % previous Artisan 4.60 % 4.89 % occupation Executive 3.58 % 2.37 % in 1990 Intermediary profession 8.76 % 7.82 % Employee 16.61 % 16.15 % Manual Worker 20.45 % 20.57 % Non-working 39.70 % 42.54 % Surface area 911.2 km2 206.0 km2
Mean density (inhabitants / km2) 43 40
Minimum density (inhabitants / km2) 4 5
Maximum density (inhabitants / km2) 311 269
Table 2: Number of deaths, SMR in control and exposed areas, ratio of SMR with 95% CI during the 1968-1994 period.
Control area Exposed area SMR ratio
Obs SMR Obs SMR Ratio 95% CI
Cancer All 2564 0.69 629 0.77 1.11 1.0-1.2 Men 1551 0.68 381 0.75 1.11 0.98-1.2 Women 1013 0.71 248 0.79 1.12 0.97-1.3 1968-1975 697 0.63 189 0.74 1.17 0.99-1.4 1976-1985 895 0.64 218 0.70 1.09 0.93-1.3 1986-1994 972 0.80 222 0.89 1.11 0.95-1.3 Lung All 349 0.71 135 1.24 1.76 1.4-2.1 Men 305 0.70 126 1.32 1.87 1.5-2.3 Women 44 0.73 9 0.69 0.94 0.37-1.8 1968-1975 82 0.72 41 1.52 2.12 1.4-3.0 1976-1985 113 0.60 49 1.15 1.92 1.3-2.7 1986-1994 154 0.81 45 1.15 1.42 0.99-2.0 1972-1987, Men 161 0.62 79 1.35 2.16 1.6-2.8 Pharynx All 31 0.37 14 0.77 2.06 1.0-3.8 Men 25 0.33 12 0.72 2.19 0.98-4.3 Women 6 0.88 2 1.35 1.54 0.00-7.0
Digestive system All 834 0.63 198 0.68 1.07 0.9-1.2
Men 492 0.64 99 0.57 0.90 0.71-1.1
Women 342 0.63 99 0.83 1.32 1.04-1.6
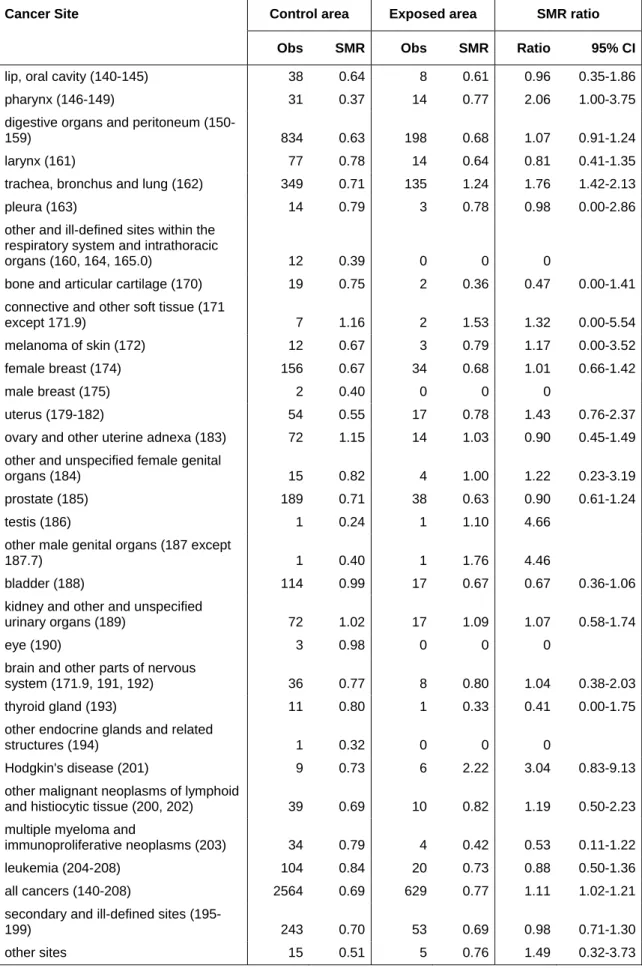
Table 3 : Number of deaths due to cancer, SMR in control and exposed areas, ratio of SMR with 95% CI during the 1968-1994 period, according to the cancer site.
Cancer Site Control area Exposed area SMR ratio
Obs SMR Obs SMR Ratio 95% CI
lip, oral cavity (140-145) 38 0.64 8 0.61 0.96 0.35-1.86 pharynx (146-149) 31 0.37 14 0.77 2.06 1.00-3.75 digestive organs and peritoneum
(150-159) 834 0.63 198 0.68 1.07 0.91-1.24
larynx (161) 77 0.78 14 0.64 0.81 0.41-1.35
trachea, bronchus and lung (162) 349 0.71 135 1.24 1.76 1.42-2.13
pleura (163) 14 0.79 3 0.78 0.98 0.00-2.86
other and ill-defined sites within the respiratory system and intrathoracic
organs (160, 164, 165.0) 12 0.39 0 0 0
bone and articular cartilage (170) 19 0.75 2 0.36 0.47 0.00-1.41 connective and other soft tissue (171
except 171.9) 7 1.16 2 1.53 1.32 0.00-5.54
melanoma of skin (172) 12 0.67 3 0.79 1.17 0.00-3.52 female breast (174) 156 0.67 34 0.68 1.01 0.66-1.42
male breast (175) 2 0.40 0 0 0
uterus (179-182) 54 0.55 17 0.78 1.43 0.76-2.37 ovary and other uterine adnexa (183) 72 1.15 14 1.03 0.90 0.45-1.49 other and unspecified female genital
organs (184) 15 0.82 4 1.00 1.22 0.23-3.19
prostate (185) 189 0.71 38 0.63 0.90 0.61-1.24
testis (186) 1 0.24 1 1.10 4.66
other male genital organs (187 except
187.7) 1 0.40 1 1.76 4.46
bladder (188) 114 0.99 17 0.67 0.67 0.36-1.06
kidney and other and unspecified
urinary organs (189) 72 1.02 17 1.09 1.07 0.58-1.74
eye (190) 3 0.98 0 0 0
brain and other parts of nervous
system (171.9, 191, 192) 36 0.77 8 0.80 1.04 0.38-2.03 thyroid gland (193) 11 0.80 1 0.33 0.41 0.00-1.75 other endocrine glands and related
structures (194) 1 0.32 0 0 0
Hodgkin's disease (201) 9 0.73 6 2.22 3.04 0.83-9.13 other malignant neoplasms of lymphoid
and histiocytic tissue (200, 202) 39 0.69 10 0.82 1.19 0.50-2.23 multiple myeloma and
immunoproliferative neoplasms (203) 34 0.79 4 0.42 0.53 0.11-1.22 leukemia (204-208) 104 0.84 20 0.73 0.88 0.50-1.36 all cancers (140-208) 2564 0.69 629 0.77 1.11 1.02-1.21 secondary and ill-defined sites
(195-199) 243 0.70 53 0.69 0.98 0.71-1.30
other sites 15 0.51 5 0.76 1.49 0.32-3.73
Table 4 : Number of deaths due to digestive system cancer in women, SMR in control and exposed areas, ratio of SMR with 95% CI during the 1968-1994 period.
Control area Exposed area SMR ratio
Obs SMR Obs SMR Ratio 95% CI
Esophagus (150) 13 0.68 3 0.72 1.06 0.00-3.06
Stomach (151) 52 0.43 16 0.60 1.40 0.73-2.33
Colon, rectum, rectosigmoid junction and anus (153-154)
151 0.65 44 0.87 1.33 0.93-1.83
Liver and intra-hepatic bile ducts (155 except 155.2)
11 0.99 3 1.26 1.27 0.00-3.87
Gallbladder and extra-hepatic bile ducts (156)
15 0.50 7 1.07 2.14 0.66-5.04
Pancreas (157) 49 0.77 9 0.65 0.84 0.33-1.57
Other digestive tumors 51 0.64 17 0.98 1.53 0.81-2.54 Total digestive system (150-159) 342 0.62 99 0.81 1.32 1.04-1.64