HAL Id: hal-00302087
https://hal.archives-ouvertes.fr/hal-00302087
Submitted on 29 Aug 2006HAL is a multi-disciplinary open access
archive for the deposit and dissemination of sci-entific research documents, whether they are pub-lished or not. The documents may come from teaching and research institutions in France or abroad, or from public or private research centers.
L’archive ouverte pluridisciplinaire HAL, est destinée au dépôt et à la diffusion de documents scientifiques de niveau recherche, publiés ou non, émanant des établissements d’enseignement et de recherche français ou étrangers, des laboratoires publics ou privés.
A modeling analysis of a heavy air pollution episode
occurred in Beijing
X. An, T. Zhu, Z. Wang, C. Li, Y. Wang
To cite this version:
X. An, T. Zhu, Z. Wang, C. Li, Y. Wang. A modeling analysis of a heavy air pollution episode occurred in Beijing. Atmospheric Chemistry and Physics Discussions, European Geosciences Union, 2006, 6 (4), pp.8215-8240. �hal-00302087�
ACPD
6, 8215–8240, 2006Modeling heavy air pollution in Beijing X. An et al. Title Page Abstract Introduction Conclusions References Tables Figures J I J I Back Close
Full Screen / Esc
Printer-friendly Version Interactive Discussion
EGU
Atmos. Chem. Phys. Discuss., 6, 8215–8240, 2006 www.atmos-chem-phys-discuss.net/6/8215/2006/ © Author(s) 2006. This work is licensed
under a Creative Commons License.
Atmospheric Chemistry and Physics Discussions
A modeling analysis of a heavy air
pollution episode occurred in Beijing
X. An1, T. Zhu1, Z. Wang2, C. Li1, and Y. Wang2
1
State Key Joint Laboratory of Environmental Simulation and Pollution Control, Center for Environmental Sciences, Peking University, Beijing 100871, China
2
LAPC, Institute of Atmospheric Physics, Chinese Academy of Sciences, Beijing 100029, China
Received: 17 July 2006 – Accepted: 23 August 2006 – Published: 29 August 2006 Correspondence to: Z. Wang (zifawang@mail.iap.ac.cn)
ACPD
6, 8215–8240, 2006Modeling heavy air pollution in Beijing X. An et al. Title Page Abstract Introduction Conclusions References Tables Figures J I J I Back Close
Full Screen / Esc
Printer-friendly Version Interactive Discussion
EGU
Abstract
Because concentrations of fine particulate matter (PM) and ozone in Beijing often ex-ceed healthful levels, China is to taking steps to improve Beijing’s air quality for the 2008 Olympic Games. In this paper the Models-3 Community Multiscale Air Quality (CMAQ) Modeling System was used to investigate a heavy air pollution episode in
Bei-5
jing during 3–7 April 2005. The modeling domain covered from East Asia with four nested grids with 81 to 3 km horizontal resolution focusing on urban Beijing. This was coupled with a regional emissions inventory with a 10 km resolution and a local 1 km Beijing emissions database. The trend of predicted concentrations of various pollutants agreed reasonably well with the observations and captured the main features of this
10
heavy pollution episode. The simulated column concentration distribution of PM was correlated reasonably with the MODIS remote sensing products. Control runs with and without Beijing emissions were conducted to quantify the contributions of non-Beijing sources (NBS) to the Beijing local air pollution. The contributions of NBS to each species differed spatially and temporally with the order of PM25>PM10>SO2>SOIL for
15
this episode. The percentage contribution of NBS to fine particle (PM2.5) in Beijing was averaged about 40%, up to 80% at the northwest of urban Beijing and only 10–20% at southwest. The spatial distribution of NBS contributions for PM10was similar to that for PM2.5, with a slightly less average percentage of about 30%. The NBS contributions for SO2and SOIL (diameter between 2.5 µm and 10 µm) were only 10–20% and 5–10%.
20
In addition, the pollutant transport flux was calculated and compared at different levels to investigate transport pathway and magnitude. It was found that the NBS contribution correlated with the transport flux, contributing 70% of PM10 concentration in Beijing at the time of transport flux peak during a strong episode with a transport path from southwest to northeast.
ACPD
6, 8215–8240, 2006Modeling heavy air pollution in Beijing X. An et al. Title Page Abstract Introduction Conclusions References Tables Figures J I J I Back Close
Full Screen / Esc
Printer-friendly Version Interactive Discussion
EGU
1 Introduction
Regional air pollution over Mega-city clusters has been accompanied with the quick economical expansion in China. Mega-cities are significant sources of aerosols and oxidants, which are important atmospheric components having direct impacts on air quality and climate on a regional and even global scale. It is critical to understand the
5
key chemical and physical processes controlling the concentrations of these species in these polluted regions. As a research hotspot, one of the dominant mega-city clusters is located in Beijing, the capital of China, and its surroundings areas (Fig. 1). With a population more than 14 million, Beijing’s economy growth has been rapidly growing with an annual increasing rate exceeding 10% continuously. For example, the total
10
energy consumption is increased from 38.5 million ton standard coal in 1999 to 45.1 million-ton standard coal in 2002, resulting in a very serious air pollution problem. After Beijing succeeded in the competition for the bid to host the 2008 Olympic Games, improving the air quality in Beijing has been one of the most important tasks for the Chinese government. After a series of air antipollution measures including increasing
15
the natural gas supply, centralizing the heat supply, removing electric heat devices, and using of low sulfur coals, air quality in Beijing has improved obviously since 1997. The number of days of meeting Air Pollution Standard II or better increased from 56 days in 1998 to 254 days in 2005. However, the average concentration of main contaminants remained high in the past three years, indicating that emissions controls only in Beijing
20
are not enough to solve the regional pollution problems over Beijing.
Several studies pointed out that the regional air pollution in Beijing was caused not only by local sources but also significantly by non-Beijing sources (Zhang et al., 2004; Xu et al., 2004; Sun et al., 2004). The basin-like geophysical feature of urban Beijing and its unique weather system are the dominant factors influencing air quality (Ren et
25
al., 2004). Su et al. (2004) investigated certain transport pathways of NBS to Beijing and found that a convergence zone of air pollutants occurred within the atmospheric boundary layer along the combination of the Yanshan-Taihang mountains and the North
ACPD
6, 8215–8240, 2006Modeling heavy air pollution in Beijing X. An et al. Title Page Abstract Introduction Conclusions References Tables Figures J I J I Back Close
Full Screen / Esc
Printer-friendly Version Interactive Discussion
EGU
China Plain. The contribution of various emission sources shows a specific structure in spatial distribution and depends on the location and weather system.
In order to improve air quality in Beijing with comprehensive measures, it is neces-sary to quantitatively evaluate the contribution of NBS so that regional emissions can be controlled more efficiently. This can be achieved through a regional air quality
mod-5
eling system. Yan et al. (2005) made a long-term simulation of SO2and discussed the impacts of different types of sources on air quality. The transport of pollutants among several cities in North China was investigated by Zhang et al. (2004) with simplified chemical transport model, which considered no chemical reactions in simulating PM10. In this study the formation process of a typical heavy air pollution episode in
Bei-10
jing during 2–7 April 2005 was investigated with the Models-3/CMAQ. This episode clearly showed the typical evolution process of high particle pollution over Beijing with continuous several days’ pollution. The temporal and spatial characteristics of the main contaminants were analyzed with a focus on the contributions of NBS to SO2, PM10and PM2.5concentrations in Beijing. The modeling results were also compared with
obser-15
vations of SO2 and particle matters at a 325 m meteorological tower located on the campus of the Institute of Atmospheric Physics (IAP), meteorological data observed at six monitoring sites in Beijing, and satellite aerosol remote sensing results from NASA.
2 Observations and regional patterns of the high air pollution episode
2.1 Air Pollution Index (API) of Beijing and surrounding cities
20
Air Pollutant Index (API) is issued every day by SEPA (State Environment Protection Agency of China) with the monitoring data of suspended particulate matter (PM10), sul-fur dioxide (SO2), and nitrogen dioxide (NO2) (http://www.sepa.gov.cn). An index value under 100 indicates the air quality of that monitoring station conforms to the National ambient air quality criteria II. A value over 100 will worsen the allergy symptom of
un-25
ACPD
6, 8215–8240, 2006Modeling heavy air pollution in Beijing X. An et al. Title Page Abstract Introduction Conclusions References Tables Figures J I J I Back Close
Full Screen / Esc
Printer-friendly Version Interactive Discussion
EGU
cities in 2–8 April 2005. An obvious high pollution episode occurred in Beijing with API over 100 lasting more than 4 days from 4–8 April and reaching heavy pollution levels with a maximum API of 350 on 5–6 April.
2.2 SO2and particles observed at IAP 325 m tower
Six platforms were made on the IAP tower for simultaneous collection of samples for
5
analysis of SO2 and particulate matter. The 43 CTL instruments of high precision im-pulse fluorescence (USA Thermion Environment Corporation) were used for measur-ing gas at 8 m, 47 m, 120 m, and 280 m. The RP1400a instruments (USA ANPU) were used for measuring mass concentration of the particles at 8 m and 240 m. The avail-able data shown in Fig. 3 for this study include SO2 at 47 m and PM10 at 8 m. From
10
Fig. 3, it can be seen that SO2concentrations were high on 4–6 April, with peak value exceeding 60 ppb. Hourly variations of PM10has similar patterns with SO2(Fig. 3), but with much higher levels reaching 300 µg/m3for PM10 during 4–6 April, respectively.
2.3 Meteorological patterns and controlling factors
Through the analysis of synoptic meteorological charts for this period, it was found that
15
initial weak winds and stable weather patterns prevailed followd by transport of Asian dust from Inner Mongolia causing the 4-day high of air pollution mixing of anthropogenic pollutants and natural dust particles. Surface synoptic patterns show that from 4–6 April, there is a strong high pressure system located over Yangtze River with the low in Beijing. This kind of surface pattern is unfavorable for pollution to diffuse. By analyzing
20
the variance of average meteorological elements such as pressure (Fig. 3a) and wind speed (Fig. 3b) averaged over six observation stations in Beijing from 4–7 April, it was found that the average surface pressure of the six stations was lower than 1010 hPa. During the period of 4 April, 00:00 to 6 April, 12:00 (Local Time, LT), the average surface 4 wind speed was lower than 2 m/s, which caused pollutions to accumulate and
25
ACPD
6, 8215–8240, 2006Modeling heavy air pollution in Beijing X. An et al. Title Page Abstract Introduction Conclusions References Tables Figures J I J I Back Close
Full Screen / Esc
Printer-friendly Version Interactive Discussion
EGU
the observed SO2and PM10 concentrations at the IAP site were also very high during this period.
3 Model description and validation
The Models-3/CMAQ is developed by the U.S. EPA (Byue et al., 1999) and has been widely used in North America and East Asia. It has successfully applied to investigate
5
the Asian continental outflow of carbon monoxide, ozone, and aerosol sulfate to the western Pacific Ocean (Zhang et al., 2002; Uno et al., 2005; Yamaji et al., 2006). 3.1 Model setup
The NCAR/Penn State Mesoscale Model (MM5) (Grell et al., 1994) was used to gener-ate the meteorological fields for CMAQ. The Sparse Matrix Operator Kernel Emissions
10
(SMOKE) module was applied to prepare the emission inventory and generate grid-ded emission data for the CMAQ model. The input data for emissions were composed of the regional data from Streets et al. (2004) with 10 km resolution updated from the TRACE P emissions inventory and a detailed local source emissions database of Bei-jing city with 1 km resolution for point, mobile, area, and others sources for SMOKE
15
processing.
Four nested grids at the horizontal resolution of 81 km, 27 km, 9 km and 3 km with the same center located at (35.0◦N, 116.0◦E) were used for MM5 and CMAQ in this study. The coarse domain covers East Asia with 83×65 horizontal grids and the second domain includes most provinces of North China. The third domain consists of Beijing
20
and the surrounding cities, with the focus of the fourth domain on urban Beijing. There are 12 vertical layers extending from the surface to approximately 12 km in CMAQ, which are reduced from 30 sigma levels of MM5 using the mass-weighted averaging algorithms for reducing the computational costs. Vertical layers of CMAQ are unevenly distributed and surface layer is approximately 35 m.
ACPD
6, 8215–8240, 2006Modeling heavy air pollution in Beijing X. An et al. Title Page Abstract Introduction Conclusions References Tables Figures J I J I Back Close
Full Screen / Esc
Printer-friendly Version Interactive Discussion
EGU
The selected simulation period for analysis is from 2 to 8 April 2005, with 10-day spin-up from 23 March. Two experiments were performed to evaluate the contribution of NBS to air quality in Beijing: the base run (BR) with all sources and a control run (CR) with only NBS.
3.2 Comparison of model results with observation and MODIS AOD
5
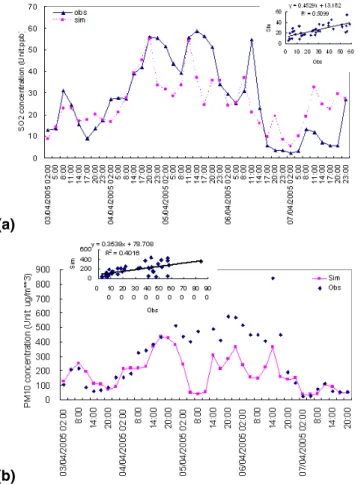
Figure 4 shows the comparison of simulated SO2 and PM10 concentrations with ob-served data at 47 m (SO2) and 8 m (PM10) height of IAP tower. The model simulated the magnitude and the diurnal patterns of SO2 and PM10 well. The correlation coef-ficient of SO2 and PM10 between the model and observation is higher than 0.70 and 0.60 respectively. The model can also simulate the variations of the particles during
10
this episode, but the simulation generally under predicted particle concentrations due to uncertainties in emissions and a lack of dust emission module in the current CMAQ system.
The model results are also compared with MODIS optical depth data. Satellite re-mote sensing provides a means to derive aerosol distribution at global and regional
15
scales. The Moderate Resolution Imaging Spectroradiometer (MODIS) aboard two of NASA’s Earth Observing System (EOS) satellites (Terra and Aqua) began a new era of aerosol remote sensing over land (Chu et al., 2003). Aerosol optical depth (AOD) products from MODIS have been verified by the sun-photometer observations in some regions of China (Li et al., 2003) and used to research air pollution in and around
Bei-20
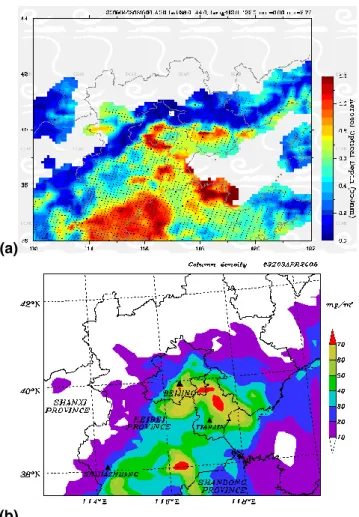
jing areas (Li et al., 2005). The researched results show that the MODIS AOD data have high accuracy and can better describe the regional and urban pollution distri-bution. Figure 5a shows the spatial distribution of MODIS Level 2 products of AOD (Version 4) with 10 km nadir spatial resolution in and around Beijing areas on 3 April, 03:15 Z, 2005. Data over ocean parts are not used for larger uncertainty is usually
25
caused by high concentration of sediment. Regions in the north part of the figure are also blank for the surface is too bright (not covered with dense vegetation) to get pre-cise aerosol retrieval. Figure 5b is the model simulated PM10column density of Beijing
ACPD
6, 8215–8240, 2006Modeling heavy air pollution in Beijing X. An et al. Title Page Abstract Introduction Conclusions References Tables Figures J I J I Back Close
Full Screen / Esc
Printer-friendly Version Interactive Discussion
EGU
and surrounding areas on 3 April, 03:00 Z, 2005. Compared Fig. 5a with Fig. 5b, it can be seen that at in most areas the distributions patterns of simulated column density are consistent with MODIS AOD. In the coastal areas of Bo Hai Bay, about 200 km away from Beijing, MODIS observed larger AOD values than our model . The difference between the two sources is mainly due to MODIS AOD retrieval errors near estuary
5
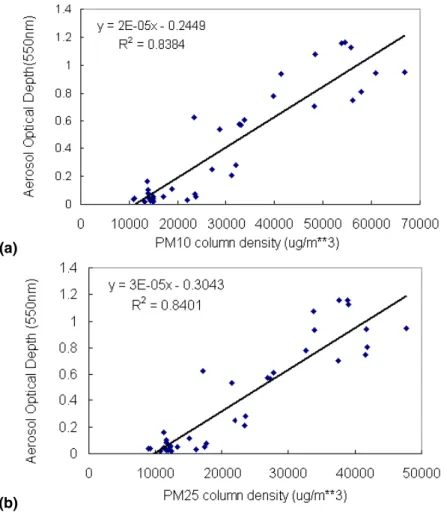
and coastal areas with high sediment concentration in the water (Li et al., 2003). AOD values in the Beijing area corresponding to our model grids are derived from MODIS level 2 products according to the nearest valid data within the scope from 39◦N to 40.5◦N, and from 115.5◦E to 117◦E. The correlation coefficient between MODIS AOD and model results are higher than 0.90 (R-squred ∼0.84) (Fig. 6).
10
4 Results and discussions
4.1 Temporal and spatial distribution of simulated PM10concentration
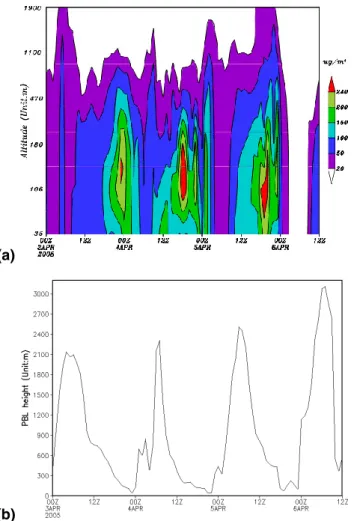
Figure 7a shows the simulated altitude-time cross sections of PM10 concentrations at the IAP site. From 4–6 April of 2005, PM10 concentrations below 200 m were very high, especially at night, which corresponded to the lower atmospheric boundary layer
15
(ABL) height (Fig. 7b) from 20:00 to 08:00 (LCT), preventing atmospheric pollutants from dispersing away. Also during this period the surface wind speed was very weak especially from 4 April, 17:00 to 5 April, 08:00 and from 5 April, 20:00 to 6 April, 08:00 (LCT) with a wind speed of less than 1.0 m/s (Fig. 3).
4.2 NBS contributions to SO2and particle in Beijing during the episode
20
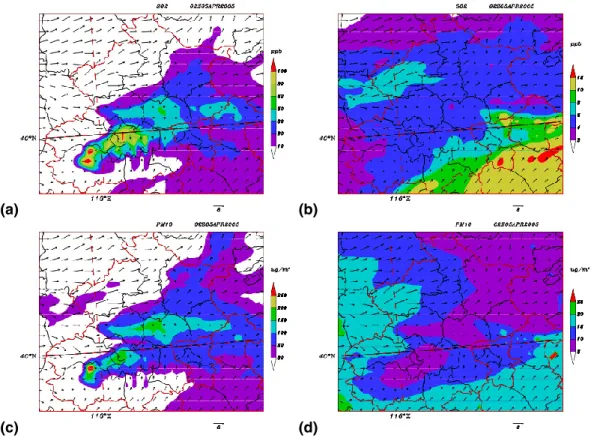
Figure 8 represents the simulated SO2 and PM10 concentrations in the fourth nested domain (3 km) at 02:00 Z, on 5 April. The horizontal distributions of SO2 and PM10 are shown in Figs. 8a and c with all sources and in Figs. 8b and d for only NBS, respectively. Figure 8a shows that SO2concentrations at most urban Beijing are higher
ACPD
6, 8215–8240, 2006Modeling heavy air pollution in Beijing X. An et al. Title Page Abstract Introduction Conclusions References Tables Figures J I J I Back Close
Full Screen / Esc
Printer-friendly Version Interactive Discussion
EGU
than 30 ppb, peaking around at 110 ppb in the west of urban Beijing. Compared with Fig. 8b, the contribution of NBS to SO2 in most areas of urban Beijing is about 6 ppb, with higher contributions in southeast area. The patterns of PM10 concentrations are similar to those of SO2, with a maximum of more than 210 µg/m3 at west of urban Beijing (Fig. 8c). The contribution of NBS for PM10 concentration in Beijing is about
5
10–15 µg/m3(Fig. 8d).
The following formula was used to calculate the percentage contributions (PC) from NBS to PM10, PM2.5, SO2 and SOIL (soil particle with diameter between 2.5 µm and 10 µm):
P C= C(CR) × 100/C(BR)
10
where C(CR) and C(BR) are the simulated concentrations of PM10, PM2.5, SO2 or SOIL, with BR run (all sources) and CR run (only NBS), respectively.
Using the results from the two runs, the distribution patterns of PC for PM10 and PM2.5 were obtained. PM10 and PM2.5 generally show similar patterns, indicating the same source regions for both of them. The contributions of NBS are variously
15
distributed over urban Beijing. Detailed contribution ratios of NBS at urban area are summed up in Table 1. The mean contribution of NBS to PM2.5 is 30–40%, with max-imum up to 60% at the southeast of urban and only 15% at southwest Beijing. The spatial distribution for PM10 is very close to PM2.5, but with slightly less values of 5%. The mean contributions of NBS for SO2is about 10–20% with the maximum up to 30%
20
at southeast of urban area, in contrast, the contribution of NBS to SOIL is about 5–10% at most urban area. Table 1 also clearly points out that NBS contributions are different for each pollutant, with the order of PM25>PM10>SO2>SOIL for this episode.
It can also be elucidated from the table that the NBS contribution of fine particles is larger than that of coarse particles to Beijing background PM levels as the fine particles
25
ACPD
6, 8215–8240, 2006Modeling heavy air pollution in Beijing X. An et al. Title Page Abstract Introduction Conclusions References Tables Figures J I J I Back Close
Full Screen / Esc
Printer-friendly Version Interactive Discussion
EGU
4.3 Pathways of NBS transporting to Beijing
The vertical altitude-time cross section and the west-east cross section of PM10 flux along Beijing are shown in Fig. 9 and Fig. 10, respectively. PM10 flux is calculated by the following formula:
flux= C × V
5
Where C is the simulated concentration of PM10 and V is the wind velocity.
From 3 to 6 April, strong PM10 fluxes were calculated coming from the southwest to the northeast of Beijing, especially during nighttime. The peak PM10 flux was seen at about 14:00 Z on 5 April of 2005, which corresponded to the peak value of con-tribution percentage to PM10 at this time (Fig. 11). The peak PM10 flux was up to
10
1100 µg*m2*s−1 at an altitude of about 200 m and correspondingly the peak contribu-tion ratio of NBS to PM10was up to 60%.
Figure 11 shows that the PM10 flux peaks at the same time as the maximum of the contribution to PM10 occurs, with a delayed PM10 concentration peak. At 18:00 Z on 3 April, 15:00 Z on April 4 and at 14Z on April 5, the contribution percentage of NBS was
15
very large with a strong PM10 flux imported from surrounding areas into Beijing, which induced the high PM10 concentration at later time (at 23:00 Z on 3 April, 20:00 Z on 4 April and at 20:00 Z on 5 April). The contribution of surrounding sources plays a very important role in forming high pollution concentration in Beijing during this episode.
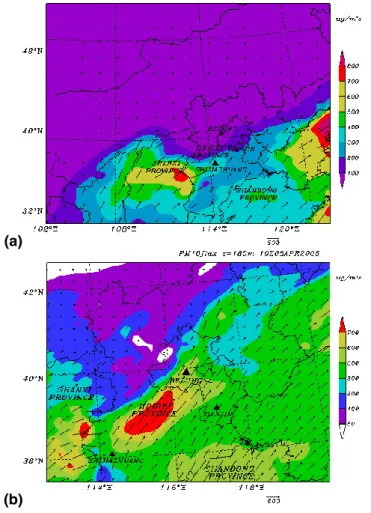
From the horizontal distribution chart of PM10 fluxes (Fig. 12), it can be seen that
20
strong particle fluxes were transported from the southwest area of Beijing by southwest wind. At 06:00 Z on 5 April, the flux center located at the boundary of Hebei province from Shanxi province. At 10:00 Z on 5 April, the high flux center moved to the northeast of Shijiazhuang. Later, the flux peak reached Beijing at about 14:00 Z. Therefore, the dominant transport pathway for NBS effecting Beijing was by the west and southwest
25
flow during this episode. Meteorological analysis (Sect. 2.3) shows that during this period, Beijing was controlled by southwest wind on 850 hPa and surface, and located at low pressure on groove. This type of meteorological pattern offers a convenient
ACPD
6, 8215–8240, 2006Modeling heavy air pollution in Beijing X. An et al. Title Page Abstract Introduction Conclusions References Tables Figures J I J I Back Close
Full Screen / Esc
Printer-friendly Version Interactive Discussion
EGU
condition for sources located at southwest region to be transported into Beijing. And also after 5 April, the floating dust storms brought by a strong Mongolia cyclone across north China strengthened this process.
5 Summary
The Models-3/CMAQ coupled with MM5 and SMOKE module was applied to evaluate
5
the contributions of NBS to high SO2and particles pollutants in Beijing during 3–7 April 2005. Comparisons of model results with observed data at the IAP tower and MODIS AOD showed that the model captured the main observed features of this serious pol-lution episode. The correlation coefficient for SO2 between the model and observed data was averaged around 0.70 while the correlation coefficient for the modeled
col-10
umn loading of particles and MODIS AOD reached 0.90. The spatial distributions of SO2 and PM10 simulated by the model showed that high concentrations were trans-ported from southwest area of Beijing to the northeast by west and southwest winds. This was also confirmed with synoptic chart analysis and transport flux analysis during this period. The sensitivity studies indicated that NBS contributions varied temporally
15
and spatially for certain pollution species. For PM2.5, the largest contribution was up to 80% at the northwest of urban, the least was about 10–20% at southwest. For PM10, spatial distribution and temporal variance of contributions were close to those of PM2.5, but slightly less. Model results also revealed that NBS contributes more to fine particle than coarse particles. The contributions of SO2 and SOIL were only 10–20%
20
and 5–10%. The calculated transport flux results show that the PM10 flux peak and percentage contribution peak of NBS to PM10 happened almost simultaneously with a delay the PM10concentrations.
This study presents a well behaved modeling system for investigating the Beijing urban pollutions and source contributions. For a comprehensive analysis of Beijing
25
air pollutions, more observational data are needed for model validations and longer simulations are required to obtain the seasonal variations of NBS contributions.
ACPD
6, 8215–8240, 2006Modeling heavy air pollution in Beijing X. An et al. Title Page Abstract Introduction Conclusions References Tables Figures J I J I Back Close
Full Screen / Esc
Printer-friendly Version Interactive Discussion
EGU Acknowledgements. This study was supported by Key Project of Chinese Academy of
Sci-ences (KZCX3-SW-341), Natural Science Foundation of China (40490265) and Chinese Ministry of Science and Technology (2002CB410802). The authors gratefully acknowledge D. Street for offering emission inventory of East Asia and P. Castellanos at University of Mary-land to revise the manuscript.
5
References
Chu, D. A., Kaufman, Y. J., Zibordi, G., Chern, J. D., Mao, J. T., Li, C. C., and Holben, B. N.: Global monitoring of air pollution over land from the Earth Observing System-Terra Moderate Resolution Imaging Spectroradiometer (MODIS), J. Geophys. Res. Atmos., 108D(21), 4661, doi:10.1029/2002JD003179, 2003.
10
Draxler, R. R. and Rolph, G. D.:HYSPLIT (HYbrid Single-Particle Lagrangian Integrated Trajec-tory) Model access via NOAA ARL READY Website (http://www.arl.noaa.gov/ready/hysplit4.
html), NOAA Air Resources Laboratory, Silver Spring, MD, 2003.
Grell, G. A., Dudhia, J., and Stauffer, D. R. A.: A description of the Fifth Generation Penn State/NCAR Mesoscale Model (MM5), NCAR Technical Note, 1994, NCAR/TU-398+STR,
15
138, 1994.
Li, C. C., Mao, J .T., Lau, K. H. A., Chen, J. C., Yuan, Z. B., Liu, X. Y., Zhu, A. H., and Liu, G. Q.: Characteristics of distribution and seasonal variation of aerosol optical depth in eastern China with MODIS products, Chinese Sci. Bull., 48(22), 2488–2495, 2003.
Li, C. C., Mao, J. T., Lau, K. H. A., Yuan, Z. B., Wang, M. H., and Liu, X. Y.: Application of
20
MODIS satellite products on the air pollution research in Beijing, Science in China Series D, 35, 209–219, 2005.
MCNChttp://cf.unc.edu/cep/empd/products/smoke
Ren, Z. H., Wan, B. T., Yu, T., et al.: Influence of Weather System of Different Scale s on Pollution Boundary Layer and the Transport in Horizontal Current Field, Res. Environ. Sci.,
25
17(1), 7–13, 2004.
Rolph, G. D.: Real-time Environmental Applications and Display System (READY) Web-site (http://www.arl.noaa.gov/ready/hysplit4.html), NOAA Air Resources Laboratory, Silver Spring, MD, 2003.
ACPD
6, 8215–8240, 2006Modeling heavy air pollution in Beijing X. An et al. Title Page Abstract Introduction Conclusions References Tables Figures J I J I Back Close
Full Screen / Esc
Printer-friendly Version Interactive Discussion
EGU
Su, F. Q., Gao, Q. X., Zhang, Z. G., et al.: Transport Pathways of Pollutant s from Out side in Atmosphere Boundary Layer, Res. Environ. Sci., 17,(1), 26–29, 2004.
Sun, Y. L., Zhuang, G. S., Wang, Y., Han, L. H., et al.: The air-borne particulate pollution in Beijing – Concentration, composition, distribution and sources, Atmos. Environ., 38, 5991– 6004, 2004..
5
US EPA: Science Algorithms of the EPA Models-3 Community Multiscale Air Quality Model (CMAQ) Modeling System, U.S. EPA Report EPA/600/R-99/030, Research Triangle Park, NC, 1999.
Uno, I., Ohara, T., Sugata, S., et al.: Development of RAMS/CMAQ Asian Scale Chemical Transport Modeling System, J. Jpn. Soc. Atmos. Environ., 40(4), 148–164, 2005.
10
Xu, X. D., Zhou, L., Zhou, X. J., et al.: Urban Environment Region Influenced by Surrounding Sources During Serious Atmospheric Pollution Process, SCIENCE IN CHINA Ser. D Earth Sciences (in Chinese), 34(10), 958–966, 2004.
Kazuyo, Y., Ohara, T., Uno, I., et al.: Analysis of seasonal variation of ozone in the boundary layer in East Asia using the Community Multi-scale Air Quality model: What controls surface
15
ozone level over Japan? Atmos. Environ., 40(10), 1856–1868, 2006.
Yan, P. and Huang, J.: Long Term Simulation of SO2in Beijing and Calculation and Evaluation of Effects of Different Type Sources on SO2, Science in China, 35D, 167–176, 2005.
Zhang, M. G., Uno, I., Akimoto, H., et al.: Large-scale structure of trace gas and aerosol distributions over the western Pacific Ocean during the Transport and Chemical
20
Evolution Over the Pacific (TRACE-P) experiment, J. Geophys. Res., 108(D21), 8820, doi:1011029P2002JD002946, 2003.
Zhang, M. G., Uno, I., Sugata, S., et al.: Numerical study of boundary layer ozone transport and photochemical production in East Asia in the wintertime. Geophys. Res. Lett., 29(11), 1545, doi:10.1029/2001GL014368, 2002.
25
Zhang, Z. G. , Gao, Q. X., Han, X. Q., et al.: The study of pollutant transport between the cities in North China, Res. Environ. Sci. (in Chinese), 17(1), 14–20, 2004.
ACPD
6, 8215–8240, 2006Modeling heavy air pollution in Beijing X. An et al. Title Page Abstract Introduction Conclusions References Tables Figures J I J I Back Close
Full Screen / Esc
Printer-friendly Version Interactive Discussion
EGU
Table 1. The average percentage contributions of NBS to SO2and particle in urban Beijing.
Area NW SW Center NE SE AVE
PM2.5 50% 15% 40% 50% 65% 45%
PM10 40% 10% 30% 40% 50% 40%
SO2 20% 25% 15% 20% 30% 20%
ACPD
6, 8215–8240, 2006Modeling heavy air pollution in Beijing X. An et al. Title Page Abstract Introduction Conclusions References Tables Figures J I J I Back Close
Full Screen / Esc
Printer-friendly Version Interactive Discussion
EGU
ACPD
6, 8215–8240, 2006Modeling heavy air pollution in Beijing X. An et al. Title Page Abstract Introduction Conclusions References Tables Figures J I J I Back Close
Full Screen / Esc
Printer-friendly Version Interactive Discussion
EGU
ACPD
6, 8215–8240, 2006Modeling heavy air pollution in Beijing X. An et al. Title Page Abstract Introduction Conclusions References Tables Figures J I J I Back Close
Full Screen / Esc
Printer-friendly Version Interactive Discussion
EGU
Fig. 3. Temporal variations of observed SO2and particle concentrations at IAP site and average pressure, wind speed at six observations sites in Beijing from 1 April 2005 00:00 to 11 April 2005 00:00 (LT).
ACPD
6, 8215–8240, 2006Modeling heavy air pollution in Beijing X. An et al. Title Page Abstract Introduction Conclusions References Tables Figures J I J I Back Close
Full Screen / Esc
Printer-friendly Version Interactive Discussion
EGU
(a)
(b)
Fig. 4. Comparison of observed and simulated SO2 (a) and PM10(b) concentration of three
ACPD
6, 8215–8240, 2006Modeling heavy air pollution in Beijing X. An et al. Title Page Abstract Introduction Conclusions References Tables Figures J I J I Back Close
Full Screen / Esc
Printer-friendly Version Interactive Discussion
EGU
(a)
(b)
Fig. 5. (a) Aerosol Optical Depth spatial distributions by MODIS at 03:15 (UTC) on 3 April 2005 (b) Model simulated PM10column density of Beijing and surrounding areas at 03:00 (UTC) on 3 April 2005.
ACPD
6, 8215–8240, 2006Modeling heavy air pollution in Beijing X. An et al. Title Page Abstract Introduction Conclusions References Tables Figures J I J I Back Close
Full Screen / Esc
Printer-friendly Version Interactive Discussion
EGU
(a)
(b)
Fig. 6. Correlation between simulated PM10 (a) and PM2.5 (b) column density with Aerosol
ACPD
6, 8215–8240, 2006Modeling heavy air pollution in Beijing X. An et al. Title Page Abstract Introduction Conclusions References Tables Figures J I J I Back Close
Full Screen / Esc
Printer-friendly Version Interactive Discussion
EGU
(a)
(b)
Fig. 7. Vertical distributions of simulated PM10 concentration and calculated atmospheric boundary layer (ABL) height by MM5 along IAP site(a) Altitude-time cross sections of PM10
ACPD
6, 8215–8240, 2006Modeling heavy air pollution in Beijing X. An et al. Title Page Abstract Introduction Conclusions References Tables Figures J I J I Back Close
Full Screen / Esc
Printer-friendly Version Interactive Discussion
EGU
(a) (b)
(c) (d)
Fig. 8. Horizontal distributions of simulated SO2and PM10concentrations over Beijing area at
02:00 (UTC) on 5 April 2005.
(a) For SO2of all sources;(b) for SO2of sources outside Beijing;(c) same as (a), but for PM10;
ACPD
6, 8215–8240, 2006Modeling heavy air pollution in Beijing X. An et al. Title Page Abstract Introduction Conclusions References Tables Figures J I J I Back Close
Full Screen / Esc
Printer-friendly Version Interactive Discussion
EGU
Fig. 9. Altitude-time cross sections of PM10flux (Unit: µg m−2s−1) along Beijing from 3 April to 7 April 2005.
ACPD
6, 8215–8240, 2006Modeling heavy air pollution in Beijing X. An et al. Title Page Abstract Introduction Conclusions References Tables Figures J I J I Back Close
Full Screen / Esc
Printer-friendly Version Interactive Discussion
EGU
Fig. 10. West-east cross section of PM10flux (Unit: µg m−2s−1) along Beijing from 3 April to 6 April.
ACPD
6, 8215–8240, 2006Modeling heavy air pollution in Beijing X. An et al. Title Page Abstract Introduction Conclusions References Tables Figures J I J I Back Close
Full Screen / Esc
Printer-friendly Version Interactive Discussion
EGU
Fig. 11. Temporal variance of PM10 concentration, PM10flux (µg m−2s−1) and contribution of sources outside Beijing to PM10.
ACPD
6, 8215–8240, 2006Modeling heavy air pollution in Beijing X. An et al. Title Page Abstract Introduction Conclusions References Tables Figures J I J I Back Close
Full Screen / Esc
Printer-friendly Version Interactive Discussion
EGU
(a)
(b)
Fig. 12. Horizontal distributions of PM10fluxes (µg m−2s−1) on 180 m high at(a) 06:00 (UTC)