HAL Id: hal-02636975
https://hal.inrae.fr/hal-02636975
Submitted on 27 May 2020
HAL is a multi-disciplinary open access
archive for the deposit and dissemination of sci-entific research documents, whether they are pub-lished or not. The documents may come from teaching and research institutions in France or abroad, or from public or private research centers.
L’archive ouverte pluridisciplinaire HAL, est destinée au dépôt et à la diffusion de documents scientifiques de niveau recherche, publiés ou non, émanant des établissements d’enseignement et de recherche français ou étrangers, des laboratoires publics ou privés.
N status at flowering, with a putative major role of root
nitrate transporter NRT2.1.
François Taulemesse, Jacques Le Gouis, David Gouache, Yves Gibon, Vincent
Allard
To cite this version:
François Taulemesse, Jacques Le Gouis, David Gouache, Yves Gibon, Vincent Allard. Post-flowering nitrate uptake in wheat is controlled by N status at flowering, with a putative major role of root nitrate transporter NRT2.1.. PLoS ONE, Public Library of Science, 2015, 10 (3), �10.1371/jour-nal.pone.0120291�. �hal-02636975�
Post-Flowering Nitrate Uptake in Wheat Is
Controlled by N Status at Flowering, with a
Putative Major Role of Root Nitrate
Transporter NRT2.1
François Taulemesse1,2,3, Jacques Le Gouis1,2, David Gouache3, Yves Gibon4, Vincent Allard1,2*
1 INRA, UMR 1095 Génétique Diversité et Ecophysiologie des Céréales, Clermont-Ferrand, France, 2 Université Blaise Pascal, UMR 1095 Génétique Diversité et Ecophysiologie des Céréales, Aubière, France, 3 Arvalis-Institut du Végétal, Service Biotechnologies, Boigneville, France, 4 INRA, UMR 1332 Biologie du Fruit et Pathologie, Villenave d’Ornon, France
*vincent.allard@clermont.inra.fr
Abstract
In bread wheat (Triticum aestivum L.), the simultaneous improvement of both yield and grain protein is difficult because of the strong negative relationship between these two traits. How-ever, some genotypes deviate positively from this relationship and this has been linked to their ability to take up nitrogen (N) during the post-flowering period, regardless of their N sta-tus at flowering. The physiological and genetic determinants of post-flowering N uptake relat-ing to N satiety are poorly understood. This study uses semi-hydroponic culture of cv. Récital under controlled conditions to explore these controls. The first objective was to record the ef-fects of contrasting N status at flowering on post-flowering nitrate (NO3-) uptake under non-limiting NO3-conditions, while following the expression of key genes involved in NO3-uptake and assimilation. We found that post-flowering NO3-uptake was strongly influenced by plant N status at flowering during the first 300–400 degree-days after flowering, overlapping with a probable regulation of nitrate uptake exerted by N demand for growth. The uptake of NO3 -correlated well with the expression of the gene TaNRT2.1, coding for a root NO3-transporter, which seems to play a major role in post-flowering NO3-uptake. These results provide a use-ful knowledge base for future investigation of genetic variability in post-flowering N uptake and may lead to concomitant gains in both grain yield and grain protein in wheat.
Introduction
Although grain yield (GY) remains the main breeding priority for wheat breeders, grain protein concentration (GPC) is another important priority, as GPC is a key element of wheat end-use value [1,2] and thus determines both the price paid to the farmer per tonne and also the opportunity for achieving export quality. However, the strongly negative relationship
a11111
OPEN ACCESS
Citation: Taulemesse F, Le Gouis J, Gouache D, Gibon Y, Allard V (2015) Post-Flowering Nitrate Uptake in Wheat Is Controlled by N Status at Flowering, with a Putative Major Role of Root Nitrate Transporter NRT2.1. PLoS ONE 10(3): e0120291. doi:10.1371/journal.pone.0120291
Academic Editor: Haibing Yang, Purdue University, UNITED STATES
Received: September 15, 2014 Accepted: January 20, 2015 Published: March 23, 2015
Copyright: © 2015 Taulemesse et al. This is an open access article distributed under the terms of the
Creative Commons Attribution License, which permits unrestricted use, distribution, and reproduction in any medium, provided the original author and source are credited.
Data Availability Statement: All relevant data are within the paper and its Supporting Information files. Data availability Raw data from physiological measurements, NO3- uptake measurements, metabolites concentration assays and gene expression quantifications used in the study are available as supplementary data (S1 Dataset). Funding: This work was supported by the French "Fonds de Soutien à l’Obtention Végétale" (FSOV) 2010F project (2011-2013). The authors are also grateful to the ANRT (Association Nationale de la Recherche et de la Technologie) which supports the
between GY and GPC [3,4] complicates the simultaneous improvement in these two traits, as increases in GY are generally detrimental to GPC. A classic agronomic strategy for obtaining high GY with adequate GPC in high-input agriculture is based on growing genotypes having strong yield potential, coupled with fertilisation practices that favour high GPC. In particular, delaying the last nitrogen (N) fertiliser application at heading, allows the low GPC, potentially associated with high GY, to be increased to an acceptable level. However, this approach is in-creasingly being questioned in a world where there is increasing pressure to reduce N inputs, both because of its rising cost and also because of a rising awareness of the environmental dam-age resulting from excessive N use in agriculture [5].
Monaghan et al. [6] proposed an alternative strategy for improving GPC without decreasing GY, thus breaking the negative GY-GPC relationship. This strategy originates from the obser-vation that some genotypes exhibit robust deviations (whether positive or negative) from the regression of GPC on GY. This deviation, grain protein deviation (GPD), has a strong genetic basis [4,7] and has interesting potential as a breeding criterion. Based on this proposition, some studies have focused on identifying the physiological basis of genetic variability in GPD. In particular, Bogard et al. [8] showed that GPD was highly correlated with post-flowering N uptake regardless of plant N status at flowering. This led to the hypothesis that GPD could be conditioned by a putative genetic variability in the control of N satiety, that would allow some varieties to absorb more N after flowering. Testing of such a hypothesis demands a better understanding of post-flowering N uptake in wheat and its regulation by plant N status.
Grain N originates from two distinct sources: remobilisation from vegetative organs of N as-similated pre-flowering, and post-flowering uptake of N from the soil. The relative contribu-tions to grain N of these two sources are negatively correlated [6,8,9], and are strongly dependent on environmental factors [10]. Typically, for wheat under field conditions, post-flowering N uptake contributes between 5 and 40% to total grain N [8,11–13]. The fraction de-pends also on growing context and, to a lesser extent, on genotype. A number of experiments have been carried out on wheat and barley under controlled conditions to study N uptake, in-cluding during the post-flowering period. These offer interesting understandings, such as of ef-fects of N availability on the dynamics of biomass accumulation and N concentration [14], of N uptake dynamics under N-limiting conditions [15], of root N uptake capacity during the post-flowering period [16], and of the fate of the N taken up post-flowering [17]. Nevertheless, little is known of the kinetics of post-flowering N uptake, or of the associated control mecha-nisms. New information is needed at both the whole plant scale and at the molecular scale. In the latter case, the conservation of the metabolic pathways associated with both N uptake and N assimilation in higher plants, offers useful tools for studying post-flowering N uptake at the molecular scale.
Several recent reviews provide an extensive view of known mechanisms of N uptake and as-similation [18–21]. Uptake of N appears to be regulated mainly by plant demand [22,23]. How-ever, a major area of continuing discussion among authors centres on the nature of the signal for N satiety. This has been proposed to be: (a) NO3-[24–26] or (b) circulating amino-acids such as
glutamine [27,28]. The principal forms in which N is taken up from the soil by plants are as ni-trate (NO3-) and as ammonium (NH4+), with NO3-being preferred under aerobic conditions
[29]. In higher plants, NO3-uptake involves two distinct systems classified according to their
af-finities for NO3-. The low-affinity transport system (LATS) is predominant when N
concentra-tions ([N]) in the medium are high, with a Kmconstant in the mM range. The high-affinity
transport system (HATS) operates under low [N] conditions, with a Kmin theμM range [19].
LATS is coded by the NRT1 gene family which has 53 known members in Arabidopsis thali-ana while HATS is coded by the NRT2 gene family which has seven members in A. thalithali-ana. Among the LATS family, AtNRT1.1 (CHL1) is the most studied, and both it and AtNRT1.2 are
PhD thesis (CIFRE 878/2011) during which the analyses were conducted. The funders had no role in study design, data collection and analysis, decision to publish, or preparation of the manuscript.
Competing Interests: The authors have declared that no competing interests exist.
expressed in the root epidermis and participate in NO3-uptake [30]. Meanwhile, AtNRT1.1 is a
dual-affinity transporter being both constitutive and inducible, and it is involved in NO3-uptake
under both high- and low-NO3-concentrations [31]. Moreover, it has recently been shown that
AtNRT1.1 can transport both NO3-and/or auxin depending on the external concentrations of
NO3-[32]. In rice, Oryza sativa, OsNRT1 is the homolog of AtNRT1.1 and has been cloned and
characterised as a low-affinity NO3-transporter which is expressed constitutively in the root
epi-dermis [33]. Based on sequence homology approaches, a number of other putative NRT1 family members (homologous to the A. thaliana NRT1 family) have been found in a range of species including: Cucumis sativus, Oryza sativa, Zea mays, Sorghum bicolor and Brachypodium distach-yon [34,35]. Although homologues of most members of the A. thaliana NRT1 gene family prob-ably exist in wheat, to our knowledge, only one has been studied [36].
The two main genes expressed in A. thaliana roots coding for HATS are AtNRT2.1 and AtNRT2.2. Of these, AtNRT2.1, in interaction with an AtNAR2 protein [37] accounts for about 75% of the high-affinity NO3-uptake [38]. These genes are induced by low NO3-
concen-tration ([NO3-]) and repressed by high [NO3-] and so belong to the group of inducible HATS.
The HATS NO3-uptake system is also implicated in plant responses to N starvation.
Expres-sion of AtNRT2.1 increases rapidly when NO3-is supplied to N-starved plants but later
de-creases if the provision of NO3-is maintained [39]. Putative homologues of the main HATS
coding genes in maize are ZmNRT2.1 and ZmNRT2.2. These were detected by the sequence ho-mology approach [34] and were later studied under hydroponic conditions where they seem to play a key role in N uptake even at [NO3-] higher than 1 mM [40]. The orthologue of
AtNRT2.1 in wheat is TaNRT2.1, and this has been characterised and its expression profiles suggest that it too belongs to the inducible HATS [41]. To our knowledge, TaNRT2.1 is the only member of the NRT2 gene family currently characterized in wheat.
Following its uptake, NO3-is reduced to nitrite (NO2-) by nitrate reductase (NR) and the
NO2-is subsequently reduced to ammonium by nitrite reductase (NiR) [42]. A loop between
glutamine synthetase 2 (GS2) and the two forms of glutamine 2-oxoglutarate amino transferase (GOGAT), NADH-GOGAT and Fd-GOGAT, finally integrate the N into amino acids [43]. Genes involved in N reduction and assimilation have been investigated in wheat [44–46].
The objective of our study was to provide a clearer view of post-flowering NO3-uptake
dy-namics in wheat in relation to the N status at flowering. To study the uptake of NO3-in detail,
a semi-hydroponic approach under controlled conditions was established because of its suscep-tibility to environmental factors. Wheat plants (cv. Récital) were grown under four pre-flowering conditions with contrasting levels of [NO3-]. At flowering, all conditions were altered
to be NO3-non-limiting, allowing plants to fully exploit their NO3-uptake potentials. The use
of15N pulse labelling allowed detailed recording of the dynamics of post-flowering NO3-
up-take and relative quantification of the expression of the main genes involved in both NO3-
up-take and assimilation and enabled links to be observed between gene expression and NO3-uptake.
Materials and Methods
Plant material
Selected wheat grains (55 to 60 mg) of cv. Récital were sown in germination trays filled with compost and placed in a heated greenhouse at 20°C for 14 days. After emergence, plants were vernalised for six weeks in a plant growth chamber (6°C, 8 h photoperiod, light intensity 350 μmol PAR m-2s-1). After vernalisation, the roots were washed free of compost and plants were
transplanted into PVC tubes (7 cm diam, 60 cm high) filled with a perlite:sand mixture (1:1, v: v) for semi-hydroponic culture. The lower end of each tube was closed with a perforated cap to
contain the substrate while allowing excess nutrient solution to drain. Two plants were trans-planted into each tube and tubes were placed vertically in eight containers (64 tubes per con-tainer, container area 0.49 m2). The resulting planting density (260 plants m-2) is comparable to that in the field under local agronomic practices.
Containers were placed in a growth chamber under a long-day photoperiod (16 h light at 20°C, 8 h dark at 18°C). Light intensity was 650μmol PAR m-2s-1. Air temperature, humidity and light intensity at canopy level were recorded every 15 min using a CR1000 datalogger (Campbell Scientific, Logan, Utah, USA). Each tube was fitted with an automated micro-irrigation system, receiving one of four different nutrient solutions containing 1, 4, 7 or 10 mM NO3-(the four nutrient treatments are referred to as N1, N4, N7 or N10, respectively). The
nu-trient solution compositions were adapted from Castle and Randall [47] (S1 Table). Two of the eight containers were irrigated with each of the nutrient solutions, with each tube receiving 66 ml of nutrient solution every three hours.
The flowering date (Zadok’s GS65) of each main stem was recorded. From flowering to ma-turity, all containers were irrigated with 66 ml every three hours of the same nutrient solution containing 10 mM of NO3-. Before each sampling, a subset of plants from each treatment
(8 tubes per NO3-pre-flowering condition) were submitted to 24 h of pulse labelling with15N
by watering with 66 ml every three hours of a 10 mM NO3-nutrient solution enriched in15N
by 10%.
Sampling protocol
Eight sampling dates were chosen during the post-flowering period. The first destructive sam-pling took place one day after flowering (GS65) and the remainder at approximately GS65+ 125, 250, 400, 500, 600, 800 and 1200 degree-days (DD) base 0°C. Each sampling was made at the same time of day (1–2 h after the start of the light period). On each sampling date, 16 tubes (32 plants) from each of the four NO3-treatments were collected. Of these, four were used for
physiological measurements and analysis of total nitrogen, four for gene expression and NO3
-analysis and the remaining eight for15N analysis. Each tube (two plants) was considered a biological replicate.
Physiological measurements and total nitrogen sample analysis
Physiological analyses were performed on four biological replicates. The processing of the two plants from each tube consisted first of counting the number of tillers and spikes per tube. The plants were then separated into six fractions; grains, chaff, stems (including leaf sheaths), green laminae, dry laminae, and roots. At stage GS65, in the absence of developed grains, ears were not separated into grain and chaff. All samples were oven dried to constant weight for 48 h at 80°C before dry weight (DW) measurement. Dry samples were ground to a fine powder using a ball mill and total nitrogen concentration was measured with the Dumas combustion method using a Flash EA 1112 Series CNS analyser (ThermoFisher Scientific, Illkirch, France).
Analysis of
15N
Plants exposed to15N pulse labelling were oven dried for 48 h at 80°C before DW measurement and ground before shipping to the UC Davis Stable Isotope Facility (Davis, CA, USA) for15N abundance determination where samples were analysed using a PDZ Europa ANCA-GSL ele-mental analyser interfaced to a PDZ Europa 20–20 isotope ratio mass spectrometer (IRMS) (Sercon Ltd., Cheshire, UK). The15N analyses were performed on eight biological replicates.
Gene expression and NO
3-concentration assay sample preparation
The same samples were used to assay gene expression and NO3-concentrations. Roots, stems
and flag leaves of the two plants from each tube were pooled to form one biological replicate per organ, ground in liquid nitrogen, and stored at -80°C pending analysis.
NO
3-concentration assays
Root, stem and flag leaf sub-samples (10 mg) were shipped to the Bordeaux INRA Metabolome Platform (https://www.bordeaux.inra.fr/umr619/RMN_index.htm; Bordeaux, France) for de-termination of NO3-concentrations using a spectrophotometry method as described in Cross
et al. [48]. The NO3-assays were performed on four biological replicates.
qRT-PCR experiments
Total RNA was extracted from three biological replicates of root, stem and flag leave samples from treatments N4 and N10 for the first seven sampling dates. Samples from the final sam-pling date were not extracted because of their advanced state of senescence. About 100 mg of frozen powder were used for each RNA extraction which was carried out using the Nucleomag 96 RNA kit (Macherey-Nagel, Düren, Germany) on the Biosprint 96 (Qiagen, Hilden, Ger-many). Total RNA samples were then purified with the NucleoSpin 96 RNA kit (Macherey-Nagel). The RNA quality was observed by migration in agarose gel. Reverse transcription of 1μg of RNA was carried out with the iScript Select cDNA Synthesis kit (Bio-Rad, Richmond, California). The three steps—extraction, purification and reverse transcription—were carried out according to the manufacturer’s instructions.
Primer pairs were developed to quantify expression levels of TaNRT1 (GenBank AY587264), TaNRT2.1 (GenBank AF332214.1), TaGS2 (GenBank DQ124212.1), TaNR, TaNiR, TaFd-GOGAT and TaNADH-GOGAT (whose partial sequence coming from Boisson et al. [44]) (S2 Table). All couples developed were generic and, thus, amplified three homeolo-gous copies. The specificity of the primer pairs and their efficiency were validated between 85 and 100%.
The quantitative real-time PCR experiment (qPCR) was carried out on a LightCycler 480 system (Roche, Indianapolis, Indiana) with the LightCycler 480 SYBR Green 1 Master Kit. The qPCR program involved pre-incubation for 10 min at 95°C, followed by 45 cycles of amplifica-tion, each consisting of denaturation for 10 s at 95°C, followed by annealing for 15 s at 60°C and finishing with elongation at 72°C for 15 s. To ensure that single products were amplified, a melting curve was analysed at the end of each assay. Because of relatively low expression levels, the two NO3-transporter genes were analysed with the cDNA template diluted to 1/8, while for
all other genes the cDNA template was diluted to 1/20. qPCR was carried out using a 15μl re-action volume containing 5μl diluted cDNA, 7.5 μl SYBR green mix, 0.75 μl each of 10 μM for-ward and reverse primers and 1μl of water. Relative expression was determined using the ΔCT method corrected for primer efficiency [49]. Results were normalised to the expression of two housekeeping genes, Ta54280 and Ta54948, selected from Paolacci et al. [50] (S2 Table) whose expression stability had already been validated under our experimental conditions.
Statistical analyses
Results were analysed after conversion to a per-square-meter basis, using tube surface area. All statistical analyses were carried out using R v2.15.1 [51], and graphics were drawn using Sigma-Plot v8.0.
Nitrogen nutrition index
The N nutrition index (NNI) was calculated at flowering as the above-ground N concentration divided by the critical plant N concentration. The critical plant N concentration is defined as the minimum N concentration needed for maximum growth rate [52]. The critical N concen-tration was calculated using the equation of the critical N concenconcen-tration curve for cereals pro-posed by Justes et al. [53].
Results
Effects of pre-flowering NO
3-treatments on plant morphology, biomass
and N concentration
Four levels of NO3-in the nutrient solutions were used until flowering (1, 4, 7 and 10 mM,
re-spectively referred to as N1, N4 N7 and N10). These led to highly contrasting tiller numbers, biomasses and N concentrations at flowering (Table 1). Tiller number increased significantly with rising [NO3-]. Values lay between 522 tillers m-2for N1, and 1371 tillers m-2for N10,
indi-cating a strong morphological response to rising N. Tiller number increased linearly with [NO3-] (r2= 0.99, p = 0.005; data not shown), with an average slope of 92.5 tillers m-2per mM
of [NO3-]. Plant biomass ranged from 393 gDW m-2for N1 to 1702 gDW m-2for N10. Even
though the biomass difference between plants at flowering from N4 to N7 was not significantly different (p = 0.168), a linear regression across the four [NO3-] treatments vs plant biomass did
reveal a significant relationship (r2= 0.95, p = 0.026; data not shown). This trend shows that all treatments lay within a range where [NO3-] was limiting for plant growth. Plant N
concentra-tion (plant [N]) at flowering increased strongly and linearly with nutrient [NO3-] (r2= 0.99,
p = 0.003; data not shown). The average slope was 0.183 percentage points of plant [N] per mM of NO3-.
All the above trends are supported by a calculation of NNI at flowering (Table 1), which shows a significant linear response to NO3-(r² = 0.99, p = 0.005; data not shown). The average
increase was 0.22 points per mM of [NO3-]. With regard to the critical nitrogen dilution curve
developed for wheat [53], only N1 appeared to be limited by N status with NNI less than 1. This index was developed for field crops, so it should be used carefully under our conditions, nevertheless it clearly indicates a differential effect for the four [NO3-] treatments used in
our study.
After flowering, all plants were exposed to the same, non-limiting 10 mM NO3-nutrient
so-lution. At maturity, the DW hierarchy between treatments was conserved (Table 2) although there was no significant difference between N7 and N10. The range of DW was fairly consistent with values of 1701, 2966, 4637 and 4822 gDW m-2for N1, N4, N7 and N10, respectively. For plant [N] at maturity, despite no significant differences between N1, N4 and N10, there did seemed to be a trend for plants having been exposed to high pre-flowering N, to have less plant [N] at maturity. Plant [N] at maturity was 2.1 and 2.2%DW for the high-NO3-treatments
(N7 and N10, respectively) and 2.4 and 2.5% DW for the low-NO3-treatments (N1 and N4,
respectively).
Interestingly, the two groups of treatments described for plant [N] stood out for the agro-nomic variables of grain yield, grain N concentration (grain [N]) and total grain N. There were no significant differences in grain yield either between N1 and N4 (690, 1051 g m-2, respective-ly) or between N7 and N10 (1828 and 1944 g m-2, respectively). Probably due to the semi-hydroponic growth conditions, grain yields were high (equivalent to 69 and 194 q ha-1for the two extreme treatments). Grain [N] values were 3.1 and 2.9%DW for N1 and N4, respectively and 2.5%DW for N7 and N10, respectively. There were strong and highly significant
opposite-going effects of pre-flowering NO3-treatment on grain yield and grain [N]. Grain yield and
grain [N] were therefore negatively correlated (r2= 0.99, p = 0.002). Total grain N (Table 2) was lower than total post-flowering N uptake (calculated by difference between total plant N at maturity,Table 2, and total plant N at flowering,Table 1), indicating that there was no net remobilisation of N from vegetative parts to the grains under our semi-hydroponic conditions. Harvest index lay between 0.39 and 0.44, which is close to values commonly observed under field conditions.
Starting from significantly different levels of plant [N] at flowering, plants from the four [NO3-] treatments quickly converged showing comparable [N] by GS65+300DD (Fig. 1).
Con-vergence occurred between flowering and GS65+300DD, and led to plant [N] values between approximately 2.1 and 2.5%DW for all treatments. Interestingly, the convergence between treatments was reflected not only in an increase in plant [N] in the low-N pre-flowering treat-ments (N1 and N4) but also in a decrease in the high-N pre-flowering treattreat-ments (N7 and N10). During this phase, plants from N1 and N4 exhibited [N] increases of 59 and 20%, respec-tively, while plants from N7 and N10 exhibited [N] decreases of 13 and 18%, respectively. From GS65+300DD until maturity, plant [N] remained relatively stable for all treatments, varying between 2.0 and 2.7%DW.
NO
3-uptake during the post-flowering period
The15N pulse labelling allows precise measurement of the dynamics of plant NO3-uptake during
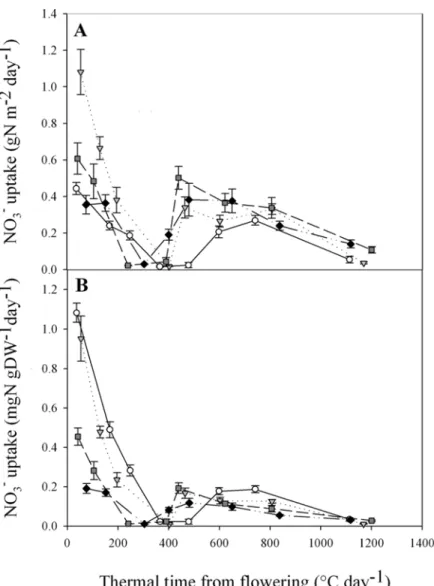
the post-flowering period.Fig. 2Ashows that all treatments had strong NO3-uptakes at flowering,
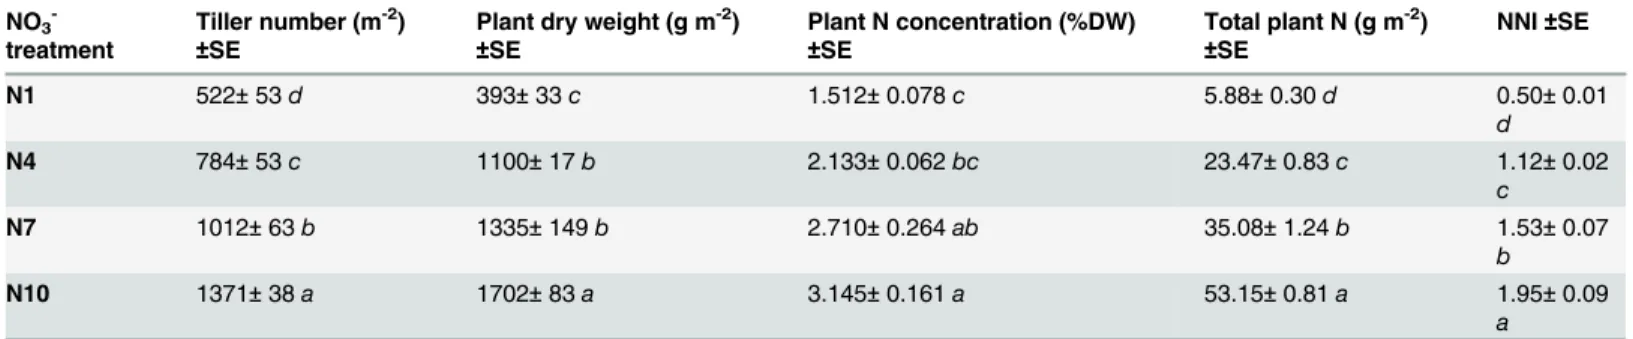
Table 1. Tiller number, plant dry weight, plant N concentration, total plant N and NNI atflowering for the four NO3-treatments.
NO3
-treatment
Tiller number (m-2)
±SE
Plant dry weight (g m-2)
±SE Plant N concentration (%DW) ±SE Total plant N (g m-2) ±SE NNI±SE N1 522± 53 d 393± 33 c 1.512± 0.078 c 5.88± 0.30 d 0.50± 0.01 d N4 784± 53 c 1100± 17 b 2.133± 0.062 bc 23.47± 0.83 c 1.12± 0.02 c N7 1012± 63 b 1335± 149 b 2.710± 0.264 ab 35.08± 1.24 b 1.53± 0.07 b N10 1371± 38 a 1702± 83 a 3.145± 0.161 a 53.15± 0.81 a 1.95± 0.09 a
Values are the means of four biological repetitions± 1 standard error (SE). Statistically non-significantly different groups (Tukey multiple comparisons, p < 0.05) are labeled with the same lowercase letter. NNI = Nitrogen Nutrition Index.
doi:10.1371/journal.pone.0120291.t001
Table 2. Plant dry weight, plant N concentration, grain yield, grain N concentration and harvest index at maturity for the four NO3-treatments.
NO3 -treatment Plant dry weight (g m-2) ±SE Plant N concentration (%DW)±SE Total plant N (g m-2)±SE Grain yield (g m-2)±SE Grain N concentration (%DW)±SE Total grain N (g m-2)±SE Harvest index±SE N1 1701± 187 c 2.438± 0.061 a 41.40± 4.43 c 690± 103 b 3.050± 0.107 a 20.79± 2.45 b 0.44± 0.02 a N4 2966± 251 b 2.452± 0.066 a 72.46± 5.59 bc 1051± 109 b 2.926± 0.054 a 30.73± 3.22 b 0.39± 0.01 a N7 4637± 270 a 2.086± 0.043 b 96.73± 6.10 ab 1828± 90 a 2.549± 0.074 b 46.58± 2.49 a 0.44± 0.02 a N10 4822± 375 a 2.242± 0.113 ab 108.79± 12.77 a 1944± 179 a 2.489± 0.097 b 48.72± 5.79 a 0.43± 0.02 a
Values are the means of four biological repetitions± 1 standard error (SE). Statistically non-significantly different groups (Tukey multiple comparisons, p < 0.05) are labeled with the same lowercase letter.
with levels between 0.36 and 1.08 gNO3-m-2day-1depending on [NO3-] treatment. After
flower-ing and regardless of [NO3-] treatment, NO3-uptake showed a rapid decrease from flowering
until a date between GS65+300DD and GS65+400DD where uptake stopped. NO3-uptake then
recovered rapidly to a substantial level between 0.2 and 0.5 gNO3-m-2day-1depending on [NO3-]
treatment and then slowly declined until maturity. In addition to NO3-uptake dynamics, these
re-sults also show that NO3-uptake continued until late during the post-flowering period when
plants were exposed to a non-limiting level of NO3-in the nutrient solution.
When NO3-uptake is normalised to plant DW, it is easier to interpret differences in NO3-
up-take between the four [NO3-] treatments (Fig. 2B). Although in terms of temporal dynamics,
NO3-uptake looks very similar either in absolute terms (Fig. 2A) or when normalised by DW
(Fig. 2B), the latter representation shows that plants from N1 had strong NO3-uptakes per unit
DW (Fig. 2B). As expected, NO3-uptake was strongly impacted by plant N status at flowering.
Also at flowering, NO3-uptake per unit DW was considerably larger for plant exposed to the
low [NO3-] treatments pre-flowering. Relative to N10, daily fluxes of NO3-uptake were 5.7-,
5-and 2.4-times higher for N1, N4 5-and N7, respectively. Furthermore, the normalisation of NO3
-uptake per unit DW allows better comparisons of the different periods of the temporal dynamic. Indeed, the direct effect of NO3-uptake on plant [N] was much stronger at flowering than later
during the post-flowering period (Fig. 2B). Lastly, the exact stage of NO3-uptake recovery seems
to differ between the [NO3-] treatments. The most obvious trend is that plants exposed to higher
pre-flowering [NO3-], restarted uptake earlier than those exposed to lower pre-flowering [NO3-].
Post-flowering dynamics of [NO
3-] and NO
3-transporter gene expression
in roots
The gene expression and NO3-concentration measurements were carried out only on N4 and
N10 plants because these represent a best compromise between a distinct N effect and
non-Fig 1. Plant N concentration dynamics during the post-flowering period for the four NO3-treatments.
Values are the means of four biological repetitions± 1 standard error for N1 (open circles), N4 (grey triangles), N7 (dark grey squares) and N10 (black diamonds).
extreme plant structures. Because of the strong correlation observed between roots and stems [NO3-] dynamic during the post-flowering period (r2= 0.695, p<0.0001) (S1 Fig), and because
flag leaves were not impacted by NO3-treatment (S3 Table), the results presented in this
sec-tion are based on root samples only. This specific focus on roots for [NO3-] was chosen to
im-prove results clarity, given that roots and stems bring redundant information, and flag leaves seemingly bring no information on the differences on plant N status observed in the present study. Results from stems and flag leaves are however available as supplementary data (S2 Fig).
Levels of root [NO3-] at flowering were strongly impacted by NO3-treatment (Fig. 3).
In-deed, at flowering, N4 plants exhibited root [NO3-] of 29.1μmol gFW-1whereas in N10 plants
[NO3-] was 2.6-times higher (77.8μmol gFW-1). After flowering, the two treatments rapidly
converged to around 80μmol gFW-1after about 300DD. Despite some variability between sampling dates, [NO3-] remained relatively stable thereafter. The rapid convergence of root
Fig 2. Plant NO3
-uptake dynamic during post-flowering period for the four NO3
-treatments per square meter (A) or per unit DW (B). Data were obtained by substitution of the previous nutrient solution by an identical one but labelled 10%15N nutrient solution 24 h before sampling. Values are the means of eight
biological repetitions± 1 standard error for N1 (open circles), N4 (grey triangles), N7 (dark grey squares) and N10 (black diamonds).
[NO3-] between the two treatments was caused mainly by a near doubling of [NO3-] in N4
dur-ing the 200 DD immediately followdur-ing flowerdur-ing (Fig. 3). The levels of [NO3-] in the roots were
not significantly related to NO3-uptake (data not shown).
In the two members of the main families of low and high affinity NO3-transporters,
TaNRT1 and TaNRT2.1, post-flowering gene expression dynamics provides valuable informa-tion that increases our understanding of NO3-uptake. For TaNRT2.1, the relative expression
level at flowering depended on the pre-flowering NO3-treatment (Fig. 4A) with its expression
in N4 roots being twice that in N10 roots. Both treatments then exhibited a sharp decrease in expression of root TaNRT2.1 between flowering and GS65+200DD. After that, the difference in expression between the two treatments became small, both showing an increase after 200DD and a further decrease between GS65+400DD and GS65+600DD. The last measurement point shows an unexpected increase in TaNRT2.1 expression for both treatments but the more pro-nounced increase in N4 led to significant differences between N4 and N10.
The relative expression dynamics of TaNRT1 in roots (Fig. 4B) differed from that of TaNRT2.1. First, expression of TaNRT1 was low at flowering with no significant difference in relative expression levels between N4 and N10 at that time. After that, expression in N4 plants was consistently lower than in N10 plants, except at GS+400. Second, the expression patterns between the two genes are extremely different, with TaNRT1 showing an increase in expression from flowering to GS65+400DD and then a decrease which was more pronounced in N4 than in N10. This was followed by an increase during the final measurement period in N4 which came into balance with expression in N10.
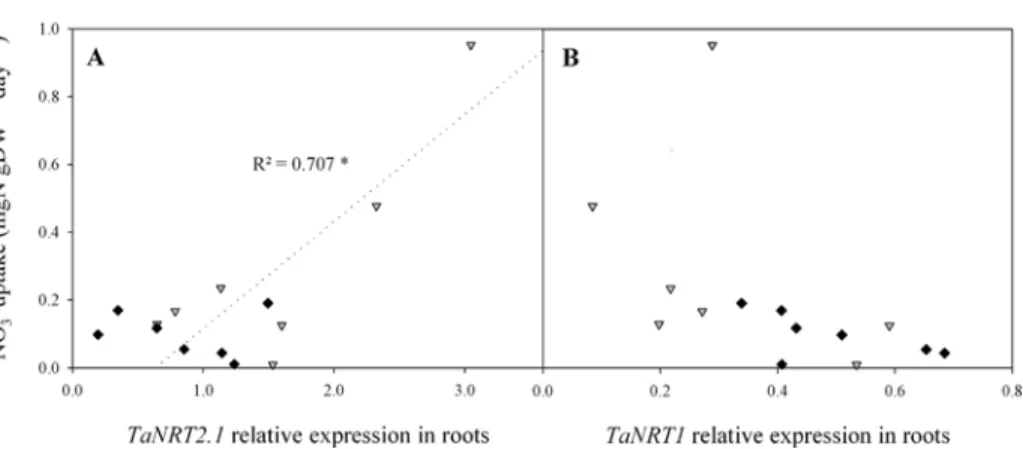
The level of NO3-uptake per unit DW was significantly and positively correlated with
TaNRT2.1 expression in N4 (r2= 0.707, p = 0.018;Fig. 5A) but not in N10 (r2= 0.011). The variation in both variables was extremely small in the latter treatment relative to those in N4 plants. Conversely, TaNRT1 expression was not significantly correlated with NO3-uptake (r2=
0.21 and 0.33 for N4 and N10, respectively;Fig. 5B).
A strong negative correlation was observed between root [NO3-] and TaNRT2.1 expression
for N4 (Fig. 6A), while no significant relationship was detected for N10. Results from N10 plants were significantly impacted by three unexplained outliers originating from the GS65 +400DD sampling date. Without these, the relation between the two variables would have been comparable under the two treatments.
In order to focus on a developmental phase when the grain sinks for N were weak, the rela-tion between root NO3-content and TaNRT2.1 expression was also observed during the period
between flowering and GS65+300DD. Here, the negative relationship between TaNRT2.1 ex-pression and root [NO3-] was highly significant for both treatments (r2= 0.94 and 0.82 for N4
and N10, respectively,Fig. 6B).
NO
3-reduction and assimilation network
To provide a biologically coherent description, correlations between the expressions patterns of the major genes involved in NO3-uptake, the reduction and assimilation networks were
exam-ined pairwise according to the path of NO3-assimilation. Root samples from N4 and N10 were
observed independently. In the same way as for [NO3-], results presented for gene expression are
based solely on root samples. This specific focus on roots was again retained for clarity, enabled by high positive correlations (0.61< r < 0.81) observed between roots and flag leaves for all ob-served genes except TaNADH-GOGAT (S3 Fig). Expression dynamics in stems during the post-flowering period were however correlated to those observed in roots for TaNR only (S4 Fig).
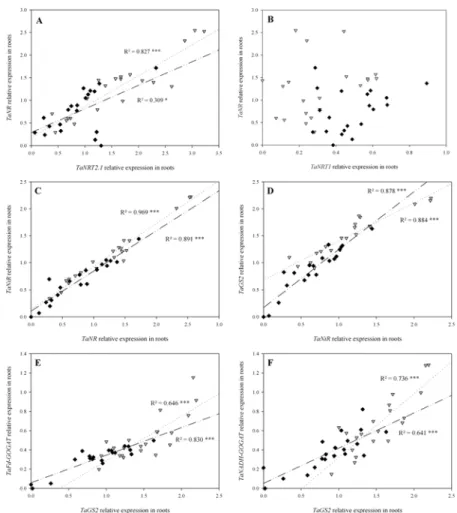
There was a significant positive correlation between the expression patterns of the high-affinity NO3-transporter family member TaNRT2.1 and the nitrate reductase TaNR in both
N4 and in N10 in roots (Fig. 7A). The lower r2observed for N10 is explained mainly by the three outliers. Conversely, there was no obvious link between the expression of the low-affinity NO3-transporter family member TaNRT1 and TaNR either in N4 or in N10 (Fig. 7B).
Subse-quently, there was a strong positive correlation between TaNR and the nitrite reductase (TaNiR) expression patterns (Fig. 7C). Correlations were significant in both N4 and N10 be-tween these two contributors to N reduction. Continuing to follow the path of N in the plant, significant positive correlations were observed between the expressions of TaNiR and gluta-mine synthetase 2 gene (TaGS2) in the two treatments (Fig. 7D). Lastly, correlations were ob-served between the expressions of TaGS2 and two forms of glutamine oxoglutarate
aminotransferase (GOGAT)—ferredoxin-dependent GOGAT (TaFd-GOGAT;Fig. 7E) and NADH-dependent GOGAT (TaNADH-GOGAT;Fig. 7F). At this level of N assimilation,
Fig 3. Roots NO3
-concentration dynamics during the post-flowering period for two contrasting NO3
-treatments (N4 and N10). Values are the means of four biological repetitions± 1 standard error for N4 (grey triangles) and N10 (black diamonds).
doi:10.1371/journal.pone.0120291.g003
Fig 4. Relative expression patterns ofTaNRT2.1 (A) and TaNRT1 (B) genes in roots from flowering (GS65) to GS65+800DD for two contrasting NO3
-treatments (N4 and N10). Values are the means of three biological repetitions± 1 standard error for N4 (grey triangles) and N10 (black diamonds). Quantification was performed by qRT-PCR. Relative expression values were calculated using theΔCT method corrected for primer efficiency, using Ta54280 and Ta54948 as internal controls.
Fig 5. Relations between plant NO3-uptake and relative expression levels ofTaNRT2.1 (A) and
TaNRT1 (B) in roots from flowering (GS65) to GS65+800DD for two contrasting NO3
-treatments (N4 and N10). Uptake data were obtained by substitution of previous nutrient solution by an identical one but labelled 10%15N nutrient solution 24 h before sampling. Values are means of eight biological repetitions for
NO3-uptake and of three biological repetitions for gene expression for N4 (grey triangles) and N10 (black
diamonds). Correlations are based on seven post-flowering sampling dates. Statistical analyses were by the Pearson correlation test. Gene expression quantification was performed by qRT-PCR. Relative expression values were calculated using theΔCT method corrected for primer efficiency, using Ta54280 and Ta54948 as internal controls.
doi:10.1371/journal.pone.0120291.g005
Fig 6. Relations between roots NO3
-concentration and relative expression level ofTaNRT2.1 in roots for two contrasting NO3-treatments (N4 and N10) from flowering (GS65) to GS65+800DD (A) and from
flowering (GS65) until NO3-uptake stop (respectively GS65+400DD and GS65+300DD for N4 and N10)
(B). Values are the three individual biological repetitions for seven post-flowering sampling dates for N4 (grey triangles) and N10 (black diamonds) (A) or respectively four and three sampling dates for N4 and N10 (B). Gene expression quantification was performed by qRT-PCR. Relative expression values were calculated using theΔCT method corrected for primer efficiency, using Ta54280 and Ta54948 as internal controls. Statistical analyses were by the Pearson correlation test.
expression patterns were positively and significantly correlated both in N4 and N10. The over-all observation of correlations between the relative expression patterns of over-all these central net-work genes suggests a coordinated regulation of nitrogen metabolism with, probably, a limited involvement of TaNRT1 under our experimental conditions.
Discussion
The objectives of this study were to provide a detailed vision of post-flowering N uptake and to identify possible control mechanisms, using a prospective approach based on correlations be-tween physiological traits, NO3-uptake, NO3-concentrations and expression level of key genes
of the N metabolism. Clearly, the present work does not provide any functional dissection of the interaction between these physiological processes but highlights strong correlations be-tween variables during post-flowering N uptake on wheat plants in realistic conditions in term of plant size, canopy structure and grain sink strength.
Fig 7. Correlations between relative expression patterns of the main genes involved in NO3-uptake,
reduction and assimilation in roots from flowering (GS65) to GS65+800DD for two contrasting NO3
-treatments (N4 and N10). Values originate from seven post-flowering sampling dates, each including three individual biological repetitions for N4 (grey triangles) and N10 (black diamonds). Relations are for (A) TaNRT2.1 and TaNR, (B) TaNRT1 and TaNR, (C) TaNR and TaNiR, (D) TaNiR and TaGS2, (E) TaGS2 and TaFd-GOGAT, and (F) TaGS2 and TaNADH-GOGAT. Quantification was performed by qRT-PCR. Relative expression values were calculated using theΔCT method corrected for primer efficiency, using Ta54280 and Ta54948 as internal controls. Statistical analyses were by the Pearson correlation test.
To achieve this, wheat plants were grown under four pre-flowering NO3-treatments to
create contrasting N statuses at flowering and monitor post-flowering NO3-uptake under
non-limiting NO3-conditions. Results show that NO3-uptake occurred until late grain filling. N
sta-tus influenced NO3-uptake rates at flowering and all treatments converged rapidly towards
comparable levels of NO3-uptake. Treatment differences in [N] at flowering decreased
consid-erably under non-limiting NO3-conditions. NO3-uptake rate was correlated with TaNRT2.1
expression, which in turn was correlated with TaNR expression. The main components of the gene network involved in NO3-uptake, NO3-reduction and N assimilation showed
coordinat-ed patterns of expression. Root [NO3-] levels were negatively correlated with TaNRT2.1,
indicating that NO3-could be a regulating element for TaNRT2.1 expression and, so also of
NO3-uptake. Here, we will discuss: (i) the experimental conditions; (ii) the control of
post-flowering NO3-uptake; (iii) the putative impact of TaNRT2.1 on NO3-uptake and its putative
regulation; and (iv) possible limiting factors for grain [N] under extreme conditions of NO3-availability.
Evaluation of growing conditions
Growing wheat in controlled hydroponic conditions allows nutrient availability to be closely regulated. Nevertheless, it is difficult to obtain nutrient availabilities fully comparable with those under field conditions. Previous studies [14–17,54] have developed fertilisation protocols for use in hydroponic culture that allow field N conditions to be mimicked with constant avail-ability of growth-limiting levels of N. Here, a more classical approach was used to drive growth during the pre-flowering period. This involved four distinct NO3-treatments and generated
canopies of markedly contrasting structure. The level of [NO3-] in the nutrient solutions
strongly influenced pre-flowering plant development, with increments of [NO3-] increasing
til-ler density linearly by about 90 tiltil-lers m-2mM-1, biomass by about 140g m-2mM-1and [N] by 0.2 percentage points mM-1.
A further objective of the experimental setup was to apply NO3-at excess levels during the
post-flowering period in order to study the effects of N status at flowering on NO3-uptake
under non-limiting conditions. Although 10 mM [NO3-] in a nutrient solution is usually
con-sidered to be non-limiting for growth in Arabidopsis [21,55,56], and is usually the highest level N treatment in hydroponic wheat [36,57], it is difficult to be certain that this level was strictly non-limiting as we did not include treatments with even higher levels of [N]. Barneix [58] stat-ed in a review that high N uptake rates, lead to high levels of N nutrition, but they inhibit leaf senescence and the remobilisation of N to the grain. In our study, the absence of significant net remobilisation of N from vegetative parts during the post-flowering period (the amount of N taken up was higher than the total in the grain for all treatments) suggests that NO3-was
in-deed available in a sufficient quantity. This scenario differs from the 60 to 95% of N remobilisa-tion usually observed in the field [8,11,13].
Therefore, it seems reasonable to infer that the NO3-treatments used here led not only to
highly contrasting stands at flowering but they further allowed the post-flowering growth to be non-limiting with regard to NO3-.
Post-flowering control of NO
3-uptake
Under our semi-hydroponic, non-limiting NO3-conditions, plants exhibited positive NO3-
up-take until late in grain filling. Similar observations have been reported for barley cultured hy-droponically under N-limiting conditions [15] and for wheat [14,16,17,54], as well as for wheat under semi-controlled conditions, more similar to the field [59]. In these studies, N uptake also occurred until close to grain maturity, showing that these plants do not have an intrinsic
physiological incapacity to take up N during grain filling. Compared to the NO3-uptake rates
in the present study, the lower rates generally observed in the field are thus unlikely related to an intrinsic incapacity of the plant but instead to some unfavourable conditions that affect ei-ther the availability of N in the soil or the plant’s demand for it.
In their hydroponic study on wheat, Oscarson et al. [16] showed that under N-limiting con-ditions, N uptake gradually decreases throughout the post-flowering period. However, under non-limiting conditions, we show that NO3-uptake is far from constant from flowering to
ma-turity. This leads to the hypothesis that NO3-uptake is regulated by factors other than NO3
-availability. Information on N uptake dynamics in wheat under non-limiting conditions is scarce, particularly during the post-flowering period. Both Imsande and Touraine [60], and Feil [22] in a review based on both controlled conditions and field experiments hypothesised that N uptake reflects the internal demand of the crop and is not determined only by the exter-nal [N]. This idea also finds support in some more recent experimental studies [61,62] as well as in assessments of N uptake arising from wheat crop simulation models. These models, de-spite some calculation differences, calculate N uptake as governed by a balance between the plant’s needs to support growth and the availability of N in the soil [63]. Thus, under non-limiting N conditions, N uptake is potentially fully governed by the plant’s demand for N for growth.
If the present study confirms earlier findings on post flowering N uptake in wheat, it also provides a clearer view of the small-scale dynamics of the process. Post-flowering NO3-uptake
dynamics can be divided into three distinct phases. The first of these is from flowering to some-time between GS65+300DD and GS65+400DD (depending on treatment). Here NO3-uptake
declines considerably from its level at flowering. Next, in the second phase, NO3-uptake almost
ceases for a period of about 100DD. And last, in the third phase, a recovery of NO3-uptake
oc-curs which persists to maturity. Interestingly, each phase coincides with a physiological evolu-tion in development, supporting the idea that NO3-uptake could be strongly controlled by a
growth demand for N.
The general decline in NO3-uptake during the first phase is synchronous with a reduction
in the sink strength of plant growth. Indeed, immediately after flowering, there are few new sinks for N as the photosynthetic apparatus is already fully developed, whereas the spikes are not yet into a phase of rapid biomass increase. The main biomass increment occurring during this phase is driven by post flowering stem elongation. The stem is a structural tissue that is rel-atively poor in N compared with, say, a leaf. Both the upper internode and the ear peduncle are known to continue extension for approximately one week after anthesis [64]. Although a com-mon tendency in NO3-uptake decrease was observed after flowering in the four NO3-
treat-ments, there were quite marked differences in NO3-uptake levels between treatments. Thus,
immediately after flowering when NO3-availability became non-limiting, NO3-uptake ranked
inversely with the level of pre-flowering NO3-treatment. Also, NO3-uptake rate at flowering
and its dynamics during the first phase immediately afterwards, are in line with a convergence towards a common value for [N]. This observation supports the idea that NO3-uptake could
be regulated also by plant N status. The high levels of NO3-uptake at this time observed in the
low-NO3-treated plants, was associated with an increase in total plant [N] and this mainly
through N enrichment of the existing organs. This phenomenon is a familiar response of plants re-supplied with N after a period of N starvation. Under such conditions increased N uptake rates have been reported in both wheat [65] and barley [24]. Furthermore, the plant [N] con-vergence between treatments was not due solely to increased plant [N] in the low-NO3-
treat-ments but also to decreased plant [N] in the high-NO3-treatments. This was linked mainly
with a greater increase in stem biomass in the high-NO3-treatments than in the low-NO3
resulting in more light competition among the plants [52]. Because stems are poorer in N than leaves, the relative change in proportion between leaf and stem coupled with a low NO3-uptake
rate resulted in a decrease in [N] at the whole plant level.
In contrast to the observations of Oscarson et al. [16], NO3-uptake in our study stopped
completely for a period of about 100°Cdays around GS65+300DD to GS65+400DD. Physiolog-ically, this phenomenon coincided with the absence of a significant sink for N. This is because the vegetative parts of the plant were fully developed, while the reproductive parts (the grains) had not yet started active filling. Furthermore, plant [N] was already extremely high at this stage in all treatments.
Still in agreement with the hypothesis of the control of N uptake by the N growth demand, the NO3-uptake resumed when the grains started to fill. If grain storage protein filling starts
around GS65+240DD, then its maximal rate occurs from about GS65+300DD to GS65 +600DD [66]. In absence of any net N remobilisation from the vegetative parts, this phase of renewed NO3-uptake was the main source of N for grain filling. Using15N pulse labelling in a
hydroponic study, Oscarson et al. [17] showed that where N was limiting, a temporary increase in NO3-availability late during grain filling resulted in a preferential allocation of
newly-assimilated N to the grain. The authors concluded that15N taken up during grain filling was rapidly incorporated in the mobile N pool of the plant and was allocated partly to tissue main-tenance but mainly to grain filling. Surprisingly, our different treatments which resulted in highly-contrasting grain yields instead had closely-similar NO3-uptake rates during this third
phase. This suggests that NO3-uptake was slowed in the high-NO3-treatments although these,
at least potentially, had greater sink demand for N. As NO3-was in excess, the ability of plants
to assimilate N probably reached its limits under such extreme conditions.
Relationships between plant NO
3-uptake and the expression of N
metabolism genes
The relative expressions of the seven main genes involved in NO3-uptake and N assimilation
were followed for the N4 and N10 treatments. These genes are hypothesised to be representa-tive of N network activity and composed of genes coding NO3-transporters, and key enzymes
involved in NO3-reduction and assimilation. Relative expression dynamics were followed in
the roots during the post-flowering period with the double purpose (a) of better understanding their behaviour and interrelationships for plants of different N status under non-limiting con-ditions, and (b) of observing the relationship between15N-based measurements NO3-uptake
and the expression the N network genes. Although the results presented here for genes expres-sion were focused on root samples, the concluexpres-sions of the study should not be biased for two main reasons. Firstly, a large part of N reduction and assimilation occurs in roots during grain filling in wheat (60 to 75% depending on N fertilization level) [67]. Secondly, the high positive correlations observed for all studied genes between roots and flag leaves (S3 Fig), except TaNADH-GOGAT, suggest that NO3-reduction and assimilation processes could be subjected
to a common regulation in these two major organs for N metabolism.
The significant correlation between NO3-uptake and TaNRT2.1 relative expression in N4
plants during the post-flowering period suggests an important role for this high-affinity nitrate transporter in NO3-uptake. Nevertheless, the absence of a correlation in N10 plants, suggests
that the relation is not linear at constant high NO3-availability. Conversely, no correlation
be-tween NO3-uptake and TaNRT1 relative expression could be detected, suggesting a limited
role for this gene under our conditions. Moreover, our results show that TaNRT2.1 is expressed at higher levels than TaNRT1 despite the high [NO3-] (10 mM) in the nutrient solution.
6 mM NO3-, where AtNRT2.1 was expressed at higher levels than AtNRT1.1 both in the plant’s
vegetative and reproductive stages [21]. Similarly, in maize, ZmNRT2.1 and ZmNRT2.2 were expressed at higher levels than ZmNRT1.1 and ZmNRT1.2 throughout the life cycle with both 0.5 and 2.5 mM NO3-, and ZmNRT2.1 expression patterns showed strong similarities to the
N uptake dynamic [40]. In wheat, Wang et al. [36] also showed that TaNRT2.1 is always ex-pressed at higher levels than TaNRT1 in NO3-ranges comparable to ours. These results suggest
that TaNRT2.1 participates in NO3-uptake in a substantial way, even at high [NO3-].
Corroborating correlations with NO3-uptake, TaNRT2.1 relative expression also correlated
with TaNR relative expression in roots (Fig. 7A) as well as in flag leaves (S5 Fig). The presumed major role of TaNRT2.1 in post-flowering NO3-uptake is supported by its consistent
expres-sion dynamics with the rest of the network. Conversely, the expresexpres-sion dynamics of TaNRT1 was not correlated with TaNR and, therefore neither with the rest of the network. TaNRT2.1 thus appears to have a major role in NO3-uptake, especially during periods of rapid uptake
under non-limiting NO3-conditions. However, the correlation between expression and uptake
was not perfect, suggesting that TaNRT2.1 is complemented by other NO3-transporters
oper-ating under a different control mechanism.
Regulation of NO3-transporters is a key factor for understanding NO3-uptake and NO3-
as-similation. Several hypotheses have been proposed for the regulation of the NRT2 gene family by internal feedback. According to literature sources, putative inhibitory signals are NO3
-[24–26] or circulating amino acids such as glutamine [27,28]. Under our conditions,
TaNRT2.1 expression was clearly negatively correlated with [NO3-] in roots, suggesting a
nega-tive feedback exerted by the root NO3-level. According to this hypothesis, during plant growth,
N demand exercised by newly-formed N sinks could limit NO3-accumulation in roots, thus
al-lowing the maintenance or increase of TaNRT2.1 expression. Decreases in N sink strength could lead to [NO3-] increases in the roots, resulting in TaNRT2.1 repression, and NO3-uptake
decrease. This hypothesis for NO3-uptake regulation fits with the assumption that NO3-uptake
is controlled by plant growth rate under non-limiting conditions.
Study of the relative expressions of the key N network genes reveals their apparent common reg-ulation during post-flowering period, with strong correlations between the various components. Root [NO3-] would seem to be a good candidate for the role of transmitting the plant N status
sig-nal to the NO3-transporters. Although relative gene expression studies should be complemented
by enzymatic activity assays, because additional regulation may occur at the post-transcriptional level, such as for NR [68], cytosolic GS1 [69], or the root ammonium transporter AMT1.1 [70], our results still seem to indicate a major role for TaNRT2.1 transporter in post-flowering NO3-uptake
under non-limiting NO3-conditions. Plants have shown the ability to quickly regulate their [N]
under non-limiting NO3-conditions when previously NO3-starved, coinciding with increases in
the relative expressions of key N metabolism genes. It is possible that this approach may allow iden-tification of genetic variability in the ability to quickly assimilate NO3-when NO3-is available. A
large capacity for NO3-assimilation during short favourable periods during the post-flowering
growth phase may be a determinant element for increasing grain [N].
Hypotheses for grain N content limitation
The main justification of studying the physiological basis of post flowering N uptake is its strong link with wheat grain [N], a major agronomic trait. Following the work of Monaghan et al. [6], Bogard et al. [8] demonstrated that genetic variability in grain [N] was strongly related to post-flowering N uptake capacity, regardless of plant N status at flowering. Thus, one objective of this work was to open tracks in the understanding of the complex regulations of post-flowering N uptake and N assimilation.
Here, high levels of grain yield were associated with decreased grain [N]. This observation is classic, since it is the basis of the extremely well known negative relationship between grain yield and grain protein [4,22,71]. It is, however, less intuitive under our conditions of non-limiting NO3-availability during grain filling.
In an ear-halving experiment with four cultivars of contrasting yield potential, Martre et al. [72] showed that grain [N] was mainly source-limited as grain [N] increased in halved ears, and as grain N per ear was nearly constant. More precisely, they stated that if yield is clearly limited by sink size, then their ear-halving experiment suggests that grain N filling is relatively more limited by N source. Following this hypothesis, several potential processes limiting N grain filling can be identified, from root N uptake to protein synthesis within the grain, pass-ing through N assimilation and N transport to ears. Our study suggests that NO3-uptake can
reasonably be dismissed from this series, because of the high post-flowering availability of NO3-. In addition the results obtained by Oscarson et al. [16] show that intrinsic root N uptake
capacity was never a limiting factor under hydroponic conditions. Grain protein synthesis ca-pacity and N transport into the ear can also be eliminated. First, there is no obvious reason for a higher capacity for protein synthesis in grains under a low-NO3-treatment than in those
under a high-NO3-treatment, based on the fact that in our study, the grains of the four
treat-ments had comparable individual masses (S4 Table). Second, using wheat ears grown in liquid culture, Barlow et al. [73] show that ear capacity to transport N compounds and grain capacity to synthesise protein were not limiting elements. This is supported by the conclusions of Mar-tre et al. [72] which state that the capacity of the sink to synthesise proteins does not regulate grain N accumulation. We therefore conclude that, the most likely hypothesis to explain the decrease in grain [N] with increasing yield, is a limitation operating at the level of N assimila-tion, with a possible saturation of the assimilation pathway.
In our study, increased grain yield was principally related to higher grain numbers per square meter (S4 Table), and these were mainly conditioned by pre-flowering NO3-availability.
Grain growth rate has been shown to be independent of N availability [74]. The independence between grain development and N availability implies that N demand by the grain during the post-flowering period depends mainly on a plant yield potential established before flowering and therefore varies with the availability of N before flowering. Thus, plants from the low-NO3-treatments developed a relatively small yield potential, and filled a low number of grains
under later high-NO3-conditions after flowering. Conversely, plants from the high-NO3-
treat-ments developed a relatively high yield potential, and filled a higher number of grains under the later high-NO3-conditions. In the latter case, this necessarily implies a reduced share of
available N per grain, thus leading to lower grain [N].
Our results do not allow a precise conclusion regarding the main metabolic process(es) re-sponsible for source limitation. Nevertheless, Jenner et al. [75] proposed that a single, or a few, of the amino-acids necessary for grain protein synthesis may limit the global N flux to the grain. For example proline is a major component of storage proteins but represents only a small fraction of the total amino-acid pool in the plant and this can be limiting. In addition, Howarth et al. [74] showed that glutamine was the principal amino acid accumulated in the grain, and that its accumulation occurred in the first seven days of grain filling. It may therefore be hypothesised that this key amino-acid may be limiting in the context of a strong demand over a short period of time.
Conclusion
This study based on a semi-hydroponic culture in controlled conditions of wheat cv. Récital shows that post-flowering NO3-uptake is controlled by N status at flowering in early stages
following flowering. Latter in the cycle, during the active grain development phase, NO3-
up-take appeared to be regulated by N demand for growth, although this study did not allow to functionally demonstrate this hypothesis. TaNRT2.1 seems to play a major role in NO3-uptake,
with expression patterns in both N4 and N10 treatments that were positively correlated with those of the main genes involved in NO3-reduction and assimilation. This study also shows
that root [NO3-] could play an important role in the regulation of TaNRT2.1 expression. These
findings were obtained on wheat plants at a developmental stage and with a canopy structure that are both meaningful for the underlying agronomic question asked. We believe these results form a good working basis for future research on genetic variability associated with the control of post-flowering N uptake with a long-term goal of forcing a break in the negative relationship between grain protein and grain yield.
Supporting Information
S1 Dataset. Raw data used in the study. (XLSX)
S1 Fig. Correlations of NO3-concentration between (A) roots and stems and (B) roots and
flag leaves for two contrasted NO3-treatments (N4 and N10) during the post-flowering
pe-riod.Values originate from two contrasted N treatments (N4 and N10) at eight post-flowering sampling dates, each including three individual biological repetitions. Statistical analyses were by the Pearson correlation test.
(TIF)
S2 Fig. NO3-concentration dynamics during the post-flowering period for two contrasting
NO3-treatments (N4 and N10) in stems (A) and flag leaves (B).Values are the means of four
biological repetitions ± 1 standard error for N4 (grey triangles) and N10 (black diamonds). (TIF)
S3 Fig. Correlations of the relative expression levels of five genes implied in NO3-reduction
and assimilation between roots and flag leaves for two contrasted NO3-treatments (N4 and
N10) from flowering (GS65) to GS65+800DD.Presented relations are for TaNR (A), TaNiR (B), TaGS2 (C), TaFd-GOGAT (D) and TaNADH-GOGAT (E). Values originate from seven post-flowering sampling dates, each including three individual biological repetitions for N4 and N10. Gene expression quantification was performed by qRT-PCR. Relative expression val-ues were calculated using theΔCT method corrected for primers efficiencies, using Ta54280 and Ta54948 as internal controls. Statistical analyses were by the Pearson correlation test. (TIF)
S4 Fig. Correlations of the relative expression levels of five genes implied in NO3-reduction
and assimilation between roots and stems for two contrasted NO3-treatments (N4 and
N10) from flowering (GS65) to GS65+800DD.Presented relations are for TaNR (A), TaNiR (B), TaGS2 (C), TaFd-GOGAT (D) and TaNADH-GOGAT (E). Values originate from seven post-flowering sampling dates, each including three individual biological repetitions for N4 and N10. Gene expression quantification was performed by qRT-PCR. Relative expression val-ues were calculated using theΔCT method corrected for primers efficiencies, using Ta54280 and Ta54948 as internal controls. Statistical analyses were by the Pearson correlation test. (TIF)
S5 Fig. Relations betweenTaNRT2.1 relative expression in roots and TaNR relative expres-sion in flag leaves for two contrasted NO3-treatments (N4 and N10) from flowering (GS65)
post-flowering sampling dates, each including three individual biological repetitions. Gene ex-pression quantification was performed by qRT-PCR. Relative exex-pression values were calculated using theΔCT method corrected for primers efficiencies, using Ta54280 and Ta54948 as inter-nal controls. Statistical ainter-nalyses were by the Pearson correlation test.
(TIF)
S1 Table. Elemental composition of nutrient solutions adapted from Castle and Randall (1987).
(PDF)
S2 Table. Target gene name, accession number and primer sequences of primer couples used in the study.
(PDF)
S3 Table. Roots, stems and flag leaves NO3-concentration at flowering for two contrasted
NO3-treatments (N4 and N10).Presented values are the mean of four biological repetitions ±
1 standard error (SE). Statistically non-significantly different groups (Tukey multiple compari-sons, p< 0.05) are labeled with the same lowercase letter.
(PDF)
S4 Table. Grain number and thousand-kernel-weight at maturity for the four NO3-
treat-ments.Presented values are the mean of four biological repetitions ± 1 standard error (SE). Sta-tistically non-significantly different groups (Tukey multiple comparisons, p< 0.05) are labeled with the same lowercase letter.
(PDF)
Acknowledgments
The authors thank Bernard Bonnemoy and Joelle Messaoud (INRA Clermont-Ferrand) for their technical assistance and Bertrand Hirel (INRA Versailles) for his useful comments on the manuscript. Sandy Lang (rescript.co.nz) proofread and provided language assistance.
Author Contributions
Conceived and designed the experiments: VA JLG FT. Performed the experiments: FT. Ana-lyzed the data: FT. Contributed reagents/materials/analysis tools: YG. Wrote the paper: FT VA JLG. Revising the manuscript critically: DG YG.
References
1. Branlard G, Dardevet M, Saccomano R, Lagoutte F, Gourdon J. Genetic diversity of wheat storage pro-teins and bread wheat quality. Euphytica. 2001; 119: 59–67.
2. Shewry PR. Improving the protein content and composition of cereal grain. J Cereal Sci. 2007; 46: 239–250.
3. Simmonds NW. The relation between yield and protein in cereal grain. J Sci Food Agric. 1995; 67: 309–315.
4. Oury F-X, Godin C. Yield and grain protein concentration in bread wheat: how to use the negative rela-tionship between the two characters to identify favourable genotypes? Euphytica. 2007; 157: 45–57. 5. Rothstein SJ. Returning to our roots: making plant biology research relevant to future challenges in
agri-culture. Plant Cell. 2007; 19: 2695–2699. PMID:17873097
6. Monaghan JM, Snape JW, Chojecki AJS, Kettlewell PS. The use of grain protein deviation for identify-ing wheat cultivars with high grain protein concentration and yield. Euphytica. 2001; 122: 309–317. 7. Oury FX, Berard P, Brancourt-Hulmel M, Heumez E, Pluchard P, Rousset M, et al. Yield and grain
pro-tein concentration in bread wheat: a review and a study of multi-annual data from a French breeding program [Triticum aestivum L.]. J Genet Breed. 2003;57.
8. Bogard M, Allard V, Brancourt-Hulmel M, Heumez E, Machet J-M, Jeuffroy M-H, et al. Deviation from the grain protein concentration-grain yield negative relationship is highly correlated to post-anthesis N uptake in winter wheat. J Exp Bot. 2010; 61: 4303–4312. doi:10.1093/jxb/erq238PMID:20679251
9. Cox MC, Qualset CO, Rains DW. Genetic variation for nitrogen assimilation and translocation in wheat. III. Nitrogen translocation in relation to grain yield and protein. Crop Sci. 1986; 26: 737–740.
10. Palta JA, Kobata T, Turner NC, Fillery IR. Remobilization of carbon and nitrogen in wheat as influenced by postanthesis water deficits. Crop Sci. 1994; 34: 118–124.
11. Van Sanford DA, MacKown CT. Cultivar differences in nitrogen remobilization during grain fill in soft red winter wheat. Crop Sci. 1987; 27: 295–300.
12. Palta JA, Fillery IRP. N application enhances remobilization and reduces losses of pre-anthesis N in wheat grown on a duplex soil. Aust J Agric Res. 1995; 46: 519–531.
13. Kichey T, Hirel B, Heumez E, Dubois F, Le Gouis J. In winter wheat (Triticum aestivum L.), post-anthe-sis nitrogen uptake and remobilisation to the grain correlates with agronomic traits and nitrogen physio-logical markers. Field Crops Res. 2007; 102: 22–32.
14. Oscarson P. The strategy of the wheat plant in acclimating growth and grain production to nitrogen availability. J Exp Bot. 2000; 51: 1921–1929. PMID:11113170
15. Mattsson M, Lundborg T, Larsson M, Larsson C-M. Nitrogen utilization in N-limited barley during vege-tative and generative growth III. Post-anthesis kinetics of net nitrate uptake and the role of the relative root size in determining the capacity for nitrate acquisition. J Exp Bot. 1992; 43: 25–30.
16. Oscarson P, Lundborg T, Larsson CM. Genotypic differences in nitrate uptake and nitrogen utilization for spring wheat grown hydroponically. Crop Sci. 1995; 35: 1056–1062.
17. Oscarson P, Lundborg T, Larsson M, Larsson C-M. Fate and effects on yield components of extra appli-cations of nitrogen on spring wheat (Triticum aestivum L.) grown in solution culture. Plant Soil. 1995; 175: 179–188.
18. Miller AJ, Fan X, Orsel M, Smith SJ, Wells DM. Nitrate transport and signalling. J Exp Bot. 2007; 58: 2297–2306. PMID:17519352
19. Tsay Y-F, Chiu C-C, Tsai C-B, Ho C-H, Hsu P-K. Nitrate transporters and peptide transporters. FEBS Lett. 2007; 581: 2290–2300. PMID:17481610
20. Glass ADM. Nitrate uptake by plant roots. Botany. 2009; 87: 659–667.
21. Masclaux-Daubresse C, Daniel-Vedele F, Dechorgnat J, Chardon F, Gaufichon L, Suzuki A. Nitrogen uptake, assimilation and remobilization in plants: challenges for sustainable and productive agriculture. Ann Bot. 2010; 105: 1141–1157. doi:10.1093/aob/mcq028PMID:20299346
22. Feil B. The inverse yield-protein relationship in cereals: possibilities and limitations for genetically im-proving the grain protein yield. Trends Agron. 1997; 1: 103–119.
23. Clarkson DT. Factors affecting mineral nutrient acquisition by plants. Annu Rev Plant Physiol. 1985; 36: 77–115.
24. Siddiqi MY, Glass AD, Ruth TJ, Rufty TW. Studies of the uptake of nitrate in barley I. kinetics of 13NO3
-influx. Plant Physiol. 1990; 93: 1426–1432. PMID:16667635
25. King BJ, Siddiqi MY, Ruth TJ, Warner RL, Glass AD. Feedback regulation of nitrate influx in barley roots by nitrate, nitrite, and ammonium. Plant Physiol. 1993; 102: 1279–1286. PMID:12231904
26. Wang R. Genomic analysis of the nitrate response using a nitrate reductase-null mutant of Arabidopsis. Plant Physiol. 2004; 136: 2512–2522. PMID:15333754
27. Vidmar JJ, Zhuo D, Siddiqi MY, Schjoerring JK, Touraine B, Glass AD. Regulation of high-affinity nitrate transporter genes and high-affinity nitrate influx by nitrogen pools in roots of barley. Plant Physiol. 2000; 123: 307–318. PMID:10806247
28. Nazoa P, Vidmar JJ, Tranbarger TJ, Mouline K, Damiani I, Tillard P, et al. Regulation of the nitrate transporter gene AtNRT2. 1 in Arabidopsis thaliana: responses to nitrate, amino acids and develop-mental stage. Plant Mol Biol. 2003; 52: 689–703. PMID:12956537
29. Maathuis FJ. Physiological functions of mineral macronutrients. Curr Opin Plant Biol. 2009; 12: 250–258. doi:10.1016/j.pbi.2009.04.003PMID:19473870
30. Huang N-C, Liu K-H, Lo H-J, Tsay Y-F. Cloning and functional characterization of an Arabidopsis nitrate transporter gene that encodes a constitutive component of low-affinity uptake. Plant Cell Online. 1999; 11: 1381–1392. PMID:10449574
31. Liu K-H, Huang C-Y, Tsay Y-F. CHL1 is a dual-affinity nitrate transporter of Arabidopsis involved in mul-tiple phases of nitrate uptake. Plant Cell. 1999; 11: 865–874. PMID:10330471
32. Krouk G, Lacombe B, Bielach A, Perrine-Walker F, Malinska K, Mounier E, et al. Nitrate-regulated auxin transport by NRT1.1 defines a mechanism for nutrient sensing in plants. Dev Cell. 2010; 18: 927–937. doi:10.1016/j.devcel.2010.05.008PMID:20627075