HAL Id: halshs-00960476
https://halshs.archives-ouvertes.fr/halshs-00960476v2
Preprint submitted on 5 Jun 2015HAL is a multi-disciplinary open access
archive for the deposit and dissemination of sci-entific research documents, whether they are pub-lished or not. The documents may come from teaching and research institutions in France or abroad, or from public or private research centers.
L’archive ouverte pluridisciplinaire HAL, est destinée au dépôt et à la diffusion de documents scientifiques de niveau recherche, publiés ou non, émanant des établissements d’enseignement et de recherche français ou étrangers, des laboratoires publics ou privés.
between protected areas and deforestation in the
Brazilian Amazon
Ariane Manuela Amin, Johanna Choumert, Jean-Louis Combes, Pascale
Combes Motel, Eric Nazindigouba Kere, Jean-Galbert Ongono Olinga, Sonia
Schwartz
To cite this version:
Ariane Manuela Amin, Johanna Choumert, Jean-Louis Combes, Pascale Combes Motel, Eric Nazindigouba Kere, et al.. A spatial econometric approach to spillover effects between protected areas and deforestation in the Brazilian Amazon. 2015. �halshs-00960476v2�
C E N T R E D'E T U D E S E T D E R E C H E R C H E S
S U R L E D E V E L O P P E M E N T
I N T E R N A T I O N A L
SERIE ETUDES ET DOCUMENTS DU CERDI
A spatial econometric approach to spillover effects between protected
areas and deforestation in the Brazilian Amazon
Ariane AMIN, Johanna CHOUMERT, Pascale COMBES MOTEL, Jean Louis COMBES, Eric Nazindigouba KERE,
Jean Galbert ONGONO-OLINGA, Sonia SCHWARTZ
Etudes et Documents n° 06
February 2014
CERDI
65 BD. F. MITTERRAND
63000 CLERMONT FERRAND - FRANCE TEL. 0473177400
FAX 0473177428
2
Ariane AMIN, Clermont Université, Université d'Auvergne, CNRS, UMR 6587, CERDI,
F-63009 Clermont Fd Email: Ariane.Amin@udamail.fr
Johanna CHOUMERT, Clermont Université, Université d'Auvergne, CNRS, UMR 6587, CERDI,
F-63009 Clermont Fd Email: Johanna.choumert@udamail.fr
Pascale COMBES MOTEL, Clermont Université, Université d'Auvergne, CNRS, UMR 6587,
CERDI, F-63009 Clermont Fd Email: P.Motel_Combes@udamail.fr
Jean Louis COMBES, Clermont Université, Université d'Auvergne, CNRS, UMR 6587, CERDI,
F-63009 Clermont Fd Email: J-L.Combes@udamail.fr
Eric Nazindigouba KERE, Clermont Université, Université d'Auvergne, CNRS, UMR 6587,
CERDI, F-63009 Clermont Fd Email: Eric.Kere@udamail.fr
Jean Galbert ONGONO-OLINGA, Clermont Université, Université d'Auvergne, CNRS, UMR
6587, CERDI, F-63009 Clermont Fd Email: Johanna.choumert@udamail.fr
Sonia SCHWARTZ, Clermont Université, Université d'Auvergne, CNRS, UMR 6587, CERDI,
F-63009 Clermont Fd Email: Sonia.Schwartz@udamail.fr
La série des Etudes et Documents du CERDI est consultable sur le site : http://www.cerdi.org/ed
Directeur de la publication : Vianney Dequiedt Directeur de la rédaction : Catherine Araujo Bonjean Responsable d’édition : Annie Cohade
ISSN : 2114 - 7957
Avertissement :
Les commentaires et analyses développés n’engagent que leurs auteurs qui restent seuls responsables des erreurs et insuffisances.
This work was supported by the LABEX
IDGM+ (ANR-10-LABX-14-01) within the program “Investissements d’Avenir” operated by the French National Research Agency (ANR)
3 Abstract
Protected areas are increasingly used as a tool to fight against deforestation. This paper presents new evidence on the spillover effects that occur in the decision to deforest and the creation of protected areas in local administrative entities in Brazilian Legal Amazon over the 2001-2011 period. We also highlight the interdependence between these two decisions. We proceed in two steps. First, we assumed that protected areas are created to stop the negative effects of deforestation on biodiversity. In order to control for the non-random location of protected areas, biodiversity indicators are used as excluded instruments. This model is estimated using a spatial model with instrumental variables. Second, a simultaneous system of spatially interrelated cross sectional equations is used to take into account the interdependence between the decision to deforest and the creation of protected areas. Our results show (i) that deforestation activities of neighboring municipalities are complements and that (ii) there is evidence of leakage in the sense that protected areas may shift deforestation to neighboring municipalities. The net effect of protected areas on deforestation remains however negative; it is moreover stable across two sub-periods. Our results confirm the important role of protected areas to curb deforestation and thereby biodiversity erosion. Moreover, they show that strategic interactions deserve attention in the effectiveness of conservation policies.
Keywords: Protected areas; deforestation; spatial interactions; simultaneous equations; Brazil; Amazon.
Code JEL: Q23, Q57, C31.
Acknowledgments
4
1
Introduction
The process of deforestation in the tropics has been the subject of an extensive literature (Angelsen & Kaimowitz 1999; Barbier 2004; and Geist & Lambin 2002, among others). Though substantial forested areas were converted into agricultural land in historical times and therefore contributed to population and income increases, contemporary deforestation generates concerns, since it is now admitted that deforestation activities have negative effects on the environment. For instance, forests are major carbon sinks, second only to oceans,1 therefore contributing to mitigating climate change. They are also home to numerous known and unknown species. Habitat disappearance in the tropics is a major concern, since the biodiversity gradient is greater in tropical than in cooler regions. Human encroachment is likely to drive species to extinction (Laurance et al. 2012). Moreover, land use changes, which are mainly the result of deforestation, contributes to anthropogenic GHG emissions. Van der Werf et al. (2009) concludes that deforestation is the second CO2 emitter after fossil fuel combustion. Finally, forests contribute to the water cycle: the Amazon basin accounts for one fifth of the total freshwater drained into oceans.
According to the Brazilian National Institute for Space Research (INPE), the year 2009 marked a reference point with respect to deforestation in Brazil: “only” 750,000 hectares were depleted, an impressive 75% decrease with respect to the 2.8 million hectares peak in 2004. Several voices, including Nepstad et al. (2009), do not exclude that the 2008-2009 financial crisis has something to do with this phenomenon. One may question this statement by considering the efforts made in the literature to unravel causes of deforestation in that region (see Andersen et al. 2002; Araujo et al. 2009; Binswanger 1991; Cattaneo & San 2005; and Pfaff 1999 among others). Moreover, Brazil is thoroughly engaged in environmental policies and the number of protected areas located in the Brazilian Legal Amazon has been substantially rising.2 Protected area surfaces in the Brazilian Legal Amazon have doubled between 2000 and 2009 and amount today to 2 million square kilometers, representing 42%
1
According to IPCC, it is, however, likely the case that CO2 uptake from the atmosphere by oceans will decrease (IPCC 2007, paragr.7.3.4.2), thus reinforcing the role of forests as carbon sinks.
2
The Brazilian Legal Amazon is a 5 million square kilometer administrative area defined for regional planning purposes comprising 4 million square km of tropical forests as well as the savanna (cerradão), and transitional vegetation in the southeast areas of the region. It covers nine states out of the twenty-nine of the Brazilian federation: Acre, Amapa, Amazonas, Mato Grosso, Rondonia, Roraima, Tocantins, Para, and a part of Maranao state.
5
of the surface in the Brazilian Amazon. Figure 1 below evidences a negative correlation between protected and deforested areas. Brazil is thus an illustrative example of conservation policies in developing countries which have often mainly relied on the implementation of protected areas (see e. g. the thorough review of Palmer & Di Falco (2012)).
The effective impact of protected areas on deforestation is subject to debate (Gaston et al. 2008; and Gaveau et al. 2009). Several authors focus on biases in the spatial distribution of protected areas: protected areas are not randomly distributed and are rather located on land of which characteristics do not favour agricultural expansion owing to their low soil fertility, slopes, poor accessibility, etc. (Albers & Ferraro 2006). Neglecting this bias could induce an overestimation of the impact of protected areas on deforestation (Nepstad et al. 2006; Sánchez-Azofeifa et al. 2003). Several empirical studies tackle this potential bias using matching methods (Andam et al. 2008; Gaveau et al. 2009; Pfaff et al. 2009; and Pfaff et al. 2014) which consist of selecting for every protected area (i.e. “treated area”) a control area with similar observable characteristics. However, the main limitation of this method is that the treated and the non-treated areas may differ in unobservable characteristics. Moreover, protected areas could cause leakages in deforestation (Ewers & A. S. L. Rodrigues 2008).
In this paper, we intend to add to the literature dedicated to the effectiveness of protected areas on deforestation using municipal level data over the Brazilian Legal Amazon. First, we take into account the non-random distribution of protected areas, using an instrumental variable method. More precisely, we follow Cropper et al. (2001), who uses a bivariate probit and Sims (2010) who uses the method of instrumental variables. Our identification strategy relies on the assumption that the creation of a protected object is not only for the purpose of reducing deforestation but also to preserve biodiversity. Consequently, an originality of this paper is the use of indicators of biodiversity, which could encourage Brazilian municipalities to establish protected areas, as instrumental variables. Second, we focus on the issue of leakages i.e. whether protected areas induce shifts in deforestation, as a result of spatial dependence in decisions regarding the establishment of protected areas, as well as land clearing decisions.
6
Figure 1. Evolution of protected areas and deforestation in the Brazilian Legal Amazon, square kilometers
Source : INPE, authors’ calculations. Note that protected areas are from federal and state entities but indigenous lands are not included.
2
Literature review
Existing empirical studies have mainly focused on the determinants of deforestation. The main determinants discussed are the expansion of agricultural crops, roads, socioeconomic characteristics, spatial interactions, and protected areas (Andersen et al. 2002; Andrade de Sá et al. 2013; Araujo et al. 2009; Barona et al. 2010; Mertens et al. 2002; Chomitz & Thomas 2003; Pfaff 1999; Walker et al. 2000; Pfaff et al., 2009; Mendonça et al. 2012).
2.1 The determinants of deforestation
Agricultural expansion is the main driver of deforestation in the Amazon (Chomitz & Thomas 2003). According to these authors, deforestation is favored by the high agricultural potential of the area. Thus, if the opportunity cost of agricultural activities is higher than other land uses, the propensity to clearing the forest will be important. This phenomenon may be enhanced by breeding. Indeed, intensive livestock operations require a large area for
0 10 000 20 000 30 000 40 000 50 000 60 000 0 200 000 400 000 600 000 800 000 1 000 000 1 200 000 1 400 000 2001 2002 2003 2004 2005 2006 2007 2008 2009 2010 2011 protected areas (left) deforested areas (right)
7
the production of animal feed. Road construction, in turn, reduces the opportunity costs of agricultural production by bringing forest areas suitable for agriculture closer to the nearest market (Walker et al. 2000; Andrade de Sá et al. 2013). However, the overestimation of the impact of roads is possible, since some political leaders have constructed them in areas not suitable for agricultural activities. One way to minimize this bias is then to control for the effect of roads by soil fertility.
Socioeconomic characteristics, especially income and consumption, are the main explanatory factors of deforestation. They positively influence it when it falls below a certain threshold. According to the environmental Kuznets curve hypothesis, during the takeoff phase of accelerated growth, they increase very quickly with, in addition, high environmental degradation; however, once a certain threshold is reached, the preferences of populations become favorable to environmentally friendly goods and services, which leads to a reduction in environmental degradation. Thus, after a certain level of development income will have a negative effect on deforestation. There is thought to be, therefore, a non-linear, inverted U-shaped relationship between deforestation and long-term income. This hypothesis was tested in several studies, but the results are contradictory (Barbier & Burgess 1997; Dinda 2004; Culas 2012; and Choumert et al. 2013).
Finally, several econometric studies (Aguiar et al. 2007; Corrêa de Oliveira & Simões de Almeida 2010; and Igliori 2006) have addressed the issue of spatial interactions in the Legal Amazon. These studies highlight the presence of a positive correlation between deforestation within a locality, and that which takes place in its vicinity. In Costa Rica and Sumatra, other studies tested the displacement of deforestation caused by the application of protection rules. Their results do not confirm the presence of such an effect in any location on nearby locations (Andam et al. 2008; Gaveau et al. 2009).
2.2 The impact of protected areas on deforestation
Policy makers often establish protected areas to preserve environmentally sensitive areas because deforestation has negative effects on the environment. In the Amazon, for example, to reduce deforestation, 487 000 km² of protected areas were created between 2003 and 2006. These areas now occupy 42% of the land area. Empirical studies that have examined
8
their impact on deforestation have shown that their ecological characteristics (level of rainfall, slope, and surface temperature) and status (belonging to indigenous populations) have an influence on deforestation (Deininger & Minten 2002; Mertens et al. 2002; and Mertens et al. 2004).
However, identifying the impact of protected areas on deforestation faces the problem of endogeneity bias related to the localization of protected areas. Indeed, deforestation and protected areas have in common the same explanatory factors (presence of roads, fertility, socioeconomic characteristics, agricultural expansion, etc.) and are not randomly distributed within the regions where they are assigned. To account for this problem, the authors usually build control groups using matching techniques in order to not overestimate or underestimate the impact of protected areas (Joppa & Pfaff 2009). The matching is based on the observable characteristics of protected areas or surfaces to identify control groups (without protected areas) with characteristics similar to those of the treated groups (with protected areas). The underlying idea is that deforestation would have evolved similarly in both groups if there were no protected areas. The difference between deforestation rates observed in these two groups can then be attributed to the presence of protected areas.
Cropper et al. (2001) studied the impact of the probability that an area is protected on the probability of being deforested. To do this, they consider these two decisions simultaneously using a bivariate Probit model to consider the localization bias. This method allows for identifying the localization bias using as control variables characteristics of the location of the surfaces (gradient, altitude, fertility, the distance to roads, etc.). According to their results, the probability that an area is protected does not have a significant effect on the probability that this area is deforested. In the same sense, Chomitz & Gray (1996) and Deininger & Minten (2002) study the probability that surfaces in protected areas are subject to deforestation. They proceed by comparing deforested surfaces predicted by the model to deforested areas outside protected areas. They show that protection has a more or less favorable impact on the reduction of land surfaces.
Another method to control for the localization bias of protected areas is to instrument this variable in the econometric regressions. This is the method used by Sims (2010). Her study focuses on the impact of protected areas on socio-economic characteristics of
9
populations in Thailand and Costa Rica. According to this author, the reduction of deforestation is not the only positive effect assigned to the creation of protected areas in the region. Improving certain socioeconomic characteristics within localities could partly be explained by the additional activities that develop around protected areas (infrastructure maintenance around the protected area, tourism, employment, etc.). However, the localization characteristics of protected areas (the distance to cities, the historical forest cover, etc.) that are conducive to the conservation of the ecosystem are not necessarily those that promote the development of economic activity. By instrumenting the surface of protected areas, Sims (2010) shows that protected areas improve the socioeconomic characteristics of certain localities.
Ferraro et al. (2011) identify conditions or physical characteristics that protected areas should meet to achieve both goals of reducing deforestation and improving socio-economic characteristics in a locality. Retaining the slope and distance to the nearest potential market as physical characteristics affecting the designation of land as protected in Thailand and Costa Rica, they show that the protected areas located between 40 and 80 km to the nearest potential market, and in which soil fertility is average, achieve both goals of reducing deforestation and improving socioeconomic characteristics. As for the cons, the areas with high agricultural potential, and where the designation of protected areas can significantly reduce deforestation, are problematic surfaces. Indeed, if people were initially poor, then the restrictions on access to protected areas encourage the stagnation of their level of poverty. The authors recommend taking these characteristics into account in the location of protected areas to reduce deforestation areas and improve the living conditions of households.
Taking into account the spatial aspect in the analysis of the impact of deforestation on protected areas remains marginal. The literature that considers this dimension focuses mainly on the spillover effects that protected areas can have on deforestation in forested areas that are in its vicinity. Gaveau et al. (2009), for example, test the hypothesis of a displacement of deforestation to neighboring surfaces by comparing the observed deforestation in protected areas with that observed in closest non-protected areas. They show that deforestation observed around protected areas within a 10 km radius in Sumatra and Indonesia is very low. They do not show displacement of deforestation. The results of
10
Andam et al. (2008) also point in the same direction. In this study, the authors compare deforestation in protected areas to that which takes place in a control group (located in a distant perimeter), using the method of matching. Their results show an absence of displacement effects of deforestation.
Several empirical studies have examined the impact of protected areas on deforestation. But they did not take into account the interdependence between deforestation and protected areas. Indeed, the need to protect forests, especially in the Amazon, usually appears with increased deforestation. As shown in previous studies, protected areas can curb deforestation and reduce its negative effects. These two decisions are interdependent and their determinants should be analyzed simultaneously. In addition, as with deforestation, taking into account spatial interactions in the establishment of protected areas should be explicit and effective, as ignoring them could bias econometric estimates.
3
Empirical Analysis
The main question addressed in this paper is whether the creation of protected areas in the Legal Amazon has reduced deforestation taking into account spatial interactions and the effects of leakage. To answer this question we use two empirical strategies. First, a spatial model with instrumental variables is used to control endogeneity bias related to the location of protected areas. Second, since the decisions of deforestation and creating protected areas may be interdependent, we use a spatial simultaneous equations model. The latter model also allows taking into account the effects of leakages related to the creation of protected areas.
3.1 Data and sources
The data used in this study come from several sources and were calculated as an arithmetic average over the period 2001-2011. We therefore have cross-sectional data over the period 2001-2011. Similar to Corrêa de Oliveira & Simões de Almeida (2010), we analyze the impact of explanatory variables on the average deforestation during the observation period. The description and sources of data used are summarized in Table 1.
11
3.2 Instrumental variables model
The first objective of this paper is to study the impact of protected areas on deforestation in the Legal Amazon area in Brazil. As discussed in the previous section, location of protected areas is endogenous (Cropper et al. 2001; Sims 2010). To correct this bias we use an instrumental variables model. To do this, we need variables that are correlated with protected areas but do not directly affect the level of deforestation in the municipality. In this study we assume that biological diversity (number of species of mammals and amphibians) is a good instrument. Indeed, one of the objectives of the creation of protected areas is the conservation of biodiversity (Palmer & Di Falco 2012; Dietz & Adger 2003). Thus, we should have more protected areas in municipalities with a high level of biodiversity. In addition, biodiversity should not have a direct impact on deforestation. But protected areas can compete with farming on the fertile land (Palmer & Di Falco 2012). We control this bias using variables of soil fertility, slope, length of roads (paved and non-paved), and the historical deforestation in 2000 (the first year of the study).
The administrative structure of Brazil (federal, state, and municipality) provides independent powers to municipalities. So, there could be strategic spatial interactions between municipalities. The Moran's I test and Robust Lagrange Multiplier test (see Table 2) confirm the presence of spatial interdependences (both spatial error and spatial lag models) between the decisions of deforestation in Legal Amazon municipalities. Therefore, the model to estimate is an instrumental model with both a spatial error and a spatial lag.
= + + +
= + (1)
= + + (2)
where is vector of the average deforestation observed during the 2001-2011 period in the municipality, is a spatial autocorrelation parameter. is a contiguity matrix. In this matrix, each element = 1 if two municipalities are neighboring and 0 otherwise. We normalize this matrix by dividing each element , by the sum of the line. is the vector of the spatially lagged endogenous variable which represents deforestation observed in neighboring municipalities, is a vector with observations on surface of protected areas,
12
and is the matrix of control variables. assumed to be a vector of error terms of the model; it includes a spatially correlated part ( ) and an independently and identically distributed part ( ). Among the control variables, we have the forested area in 2000 (start date of the study), GDP per capita, percentage of agricultural GDP, density of the total population, slope of the municipality, length of paved and unpaved roads, rainfall, soil fertility, and dummy variables that capture the state fixed effects. represents the vector of instrumental variables excluded from the model.
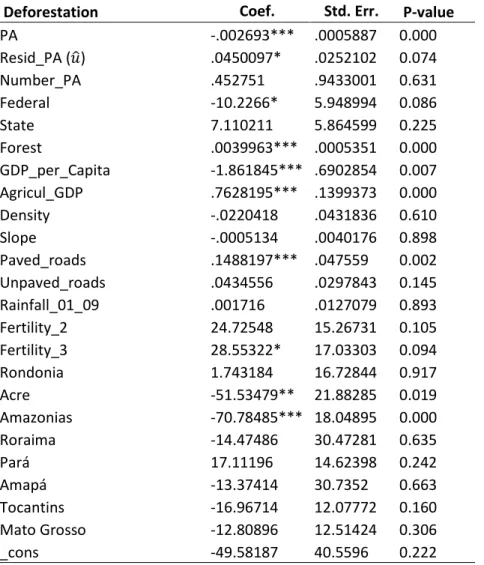
Before estimating the system of equations (1) and (2) we check, empirically, the hypothesis of endogeneity of protected areas using the orthogonality test of Nakamura Nakamura (see Table 3). This test is to estimate the equation (2) by introducing the estimated error term ( of equation (1) obtained by OLS as an additional explanatory variable. This test validates the endogeneity hypothesis of the protected area because the parameter associated with ( is significantly different from zero.
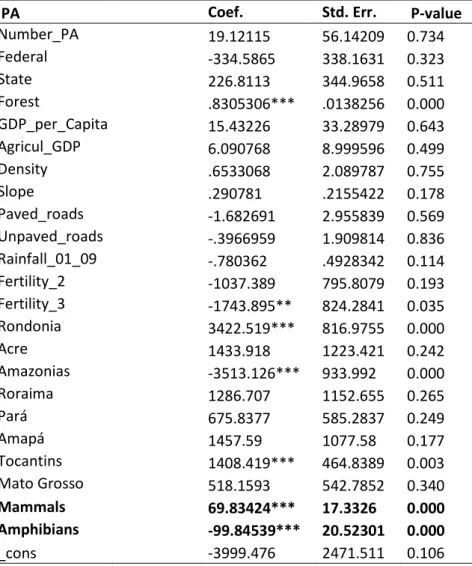
To estimate this equation system, we used a Stata command of Drukker et al. (2011) for estimating spatial-autoregressive models with spatial-autoregressive disturbances and additional endogenous variables. But this command does not provide the estimates of equation (2). We, therefore, estimate the equation (2) by the method of OLS to ensure that our instruments explain the surface of protected areas in the municipality. The coefficients associated with our two instrumental variables are all significantly different from zero (see Table 4). We then perform a test of over-identification by regressing the error terms of the estimated model (equation 1) on the exogenous variables and instruments (see Table 5). The probability associated with the Wald test is equal to 1, thus, we can accept the null hypothesis of the coefficients associated with the explanatory variables in this model. These tests validate our instruments.
The results of a spatial lag model are not directly interpretable, due to spillover effects generated by the decisions of neighboring municipalities. To interpret the coefficients of this model, we must calculate the total marginal effects (direct effect plus indirect effect). To do this, we can rewrite equation (1) as follows:
13
" − = + +
= " − # + " − # + 1 − #
Following Kim et al. (2003),
" − # = 1
1 −
The total marginal effect can be obtained by multiplying the estimated coefficients by the spatial multiplier
#$%. As argued by Kim et al. (2003), these results only hold for
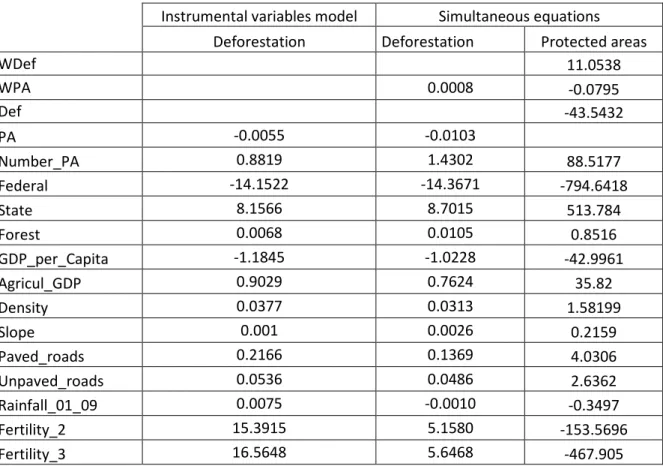
row-standardized spatial weights matrices and for in the proper parameter space, i.e., < 1. The estimation results are presented in Table 6 and the marginal effects in Table 7. These results show that protected areas have a significant negative impact on deforestation. This impact is low. Indeed, an increase in protected areas of 1 km2 in a municipality reduces deforestation to 0.0055 km2. In addition, this study highlights the presence of spatial interactions between decisions regarding deforestation by municipalities and error terms of the model.
3.3 Simultaneous equations analysis
Instrumental variable regression only estimates the impact of protected areas on deforestation. However, interdependence between deforestation and protected areas exists, as the establishment of protected areas is dependent on extensive deforestation. What is more, the spatial autocorrelation test (Table 2) shows evidence of a relationship among surfaces of protected areas between municipalities that come from their spatial location. Spatial autocorrelation among units must then be taken into account in equation (2). Given the evidence of spatial autocorrelation, we can assume that the surface of protected areas and of deforestation in neighboring municipalities can affect decisions of deforestation and of the creation of protected areas in a given municipality. The estimated model becomes:
= + ( + + + (3)
14
In equation (3), is dependent variable, which represents deforested surfaces of land observed in municipality ; is the vector of lagged dependent variable that measures the effect of deforestation in neighboring municipalities, is the vector of lagged explanatory variable that is exogenous and measures the effect of the creation of protected areas in neighboring municipalities, is the vector of surface of protected areas in municipality, and is the vector of exogenous explanatory variables.
In equation (4), is the vector of dependent variable, which represents the surface of protected area in municipality, is the vector of lagged dependent variable that measures the effect of creation of protected areas in neighboring, is the vector of lagged explanatory variable that is exogenous and measures the effect of deforestation in neighboring, is the vector of surface of land deforested in municipality that measures the effect of deforestation on the surface of protected areas, is the same vector of exogenous explanatory variables of equation (3), and is the vector of exclusion variables that identity the model (numbers of mammals and amphibians).
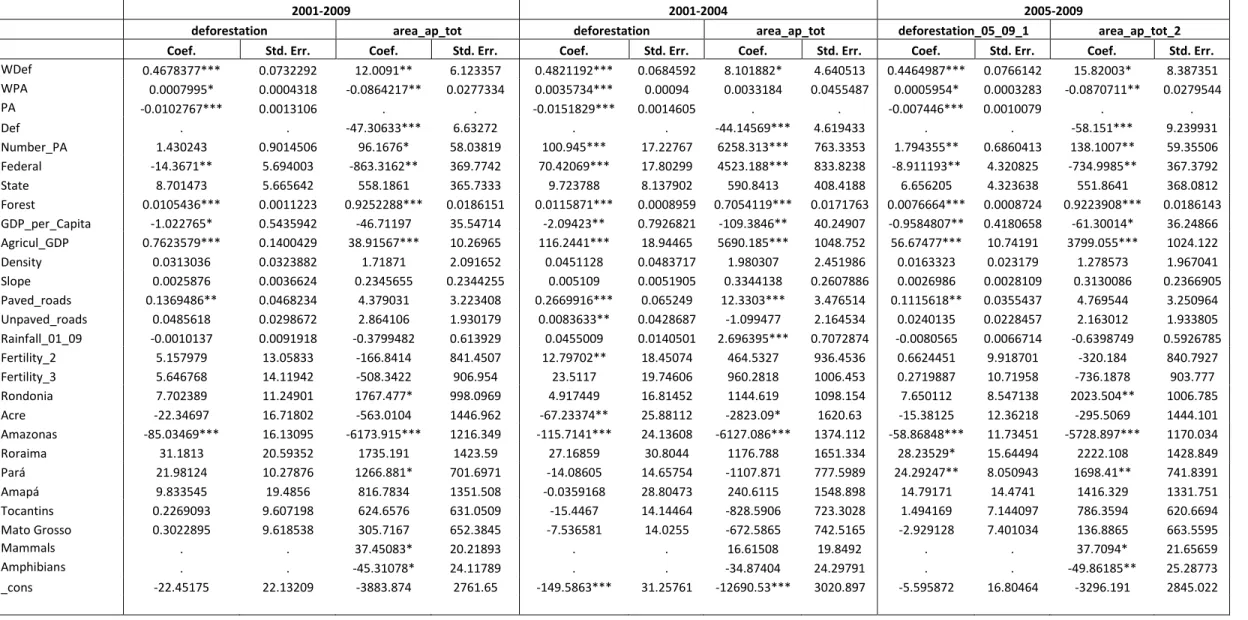
To estimate this model, we used the method of Kelejian and Prucha (2004) for estimating simultaneous systems of spatially interrelated cross sectional equations. Table 8 presents the estimation results of simultaneous equations. The coefficient of the lagged variable in equation (3) is positive and significant. That provides evidence for complementary strategic interactions. This result is in line with the findings of the instrumental variable model. The more important the surface of protected areas in neighboring municipalities ( ), the more important is the surface of land deforested in municipality i. However the more important the surface of protected areas in municipality i, the less important is the surface of land in municipality i. In other words, the importance of protected areas in neighboring municipalities acts as an incentive for deforestation. Indeed, an increase in protected areas of 1km2 in a municipality reduces deforestation to 0.01030 km2 (The marginal effects are presented in Table 7). Protected areas in the vicinity of a municipality have a positive influence on its deforestation. This means that the increase in protected areas in a municipality will result in an increase in deforestation in neighboring municipalities. This result lends support to the idea that, due to leakage effects, protected areas simply shift deforestation (Gaveau et al. 2009; Fearnside 2009; Soares-Filho et al. 2010). However, the total marginal effect of protected areas (effect of and ) is negative. This suggests
15
that, despite the existence of leakage effects, the creation of protected areas significantly reduces deforestation.
The results of equation (4) give evidence of substitutable strategic interactions. The coefficient of the dependent lagged variable (protected area) is negative and significant. The greater the creation of protected areas in neighboring municipalities, the less important is the surface of protected areas in a given municipality. Further deforestation has a negative and significant impact on the surface of protected areas in the municipality. From the marginal effects, we can say that an increase in deforestation of 1km2 in a municipality reduces the surface of protected areas in this municipality to 43.5432 km2 (the marginal effects are presented in Table 7). The results suggest, also, that the deforestation in neighboring municipalities ( positively affects the surface of protected areas in a given municipality. However deforestation in a given municipality has a negative impact on the surface of protected areas. In others words, extensive deforestation in a neighboring municipality is an incentive for the establishment of protected areas in a given municipality while deforestation in the municipality is a disincentive.
3.4 Robustness check
As for robustness, the estimation of a simultaneous equations model has been done on two sub-periods (2001-2004) and (2005-2009). The choice for these two sub-periods is explained by the fact that the first sub-period is marked by a very high level of deforestation, while the second is marked by a considerable decrease of the phenomenon, due to an amplification of protective measures for forests. In fact, according to data from the National Institute for Space Research, between 2001 and 2004 the average annual rate of deforestation was greater than 20,000 km2, while between 2005 and 2011, it is still less than 6,000 km2. Over the same period, there has been an amplification of protective measures and the creation of protected areas. This can be visualized in Figure 1 of protected areas and deforestation presented above. The results of these two estimates of sub-periods are similar to those of the whole period, and can confirm not only the stability of the effects, but also the existence of interdependence between protected areas and deforestation in Brazil.
16
4
Concluding remarks
The creation of protected areas in the context of the Legal Amazon area addresses two major objectives: to help reduce deforestation and protect environmentally sensitive areas. During the last decade we have seen a significant reduction in the average annual rate of deforestation and a significant increase in surface area of protected areas in the Legal Amazon (2,000,000 km2 today). That is why, in this study, we set the goal to analyse: (1) the impact of protected areas on deforestation; (2) the interdependence between surfaces of protected areas and deforestation, and (3) the existence of spatial interactions between deforestation and surfaces of protected areas created.
According to our results, the surface of protected areas and the level of deforestation adversely affect each other. We also show that there are complementary strategic spatial interactions (positive and a significant coefficient of spatial autocorrelation) in the decisions of deforestation and substitutable strategic interactions (a significant and negative coefficient of spatial autocorrelation) in the decisions to create protected areas.
In terms of public policy, these results suggest that the increase in protected areas in recent years in the Legal Amazon areas actually helped to reduce deforestation. This policy is thus effective and should be encouraged. In addition, the existence of spatial interactions in the equation of deforestation, as well as in the equation of protected areas, suggests a coordination of municipalities in the establishment of protected areas to make them more effective in terms of reducing deforestation and protecting and preserving ecosystems. Indeed, coordination may slow complementary interactions in deforestation decisions and could promote the establishment of ecological corridors that promote particular migratory species.
Despite the importance of these results, this study can be improved by exploiting the temporal dimension of our data using simultaneous equations panel models, taking into account the spatial aspect. This will allow us to take into account the temporal and individual effects.
17
5
References
Aguiar, A.P.D., Câmara, G. & Escada, M.I.S., 2007. Spatial statistical analysis of land-use determinants in the Brazilian Amazonia: Exploring intra-regional heterogeneity. Ecological Modelling, 209(2–4), p.169-188.
Albers, H.J. & Ferraro, P.J., 2006. The Economics of Terrestrial Biodiversity Conservation in Developing Nations. In R. López & M. A. Toman, ed. Economic Development and
Environmental Sustainability: New Policy Options. Oxford University Press, USA, p. 382-411.
Andam, K.S. et al., 2008. Measuring the effectiveness of protected area networks in reducing deforestation. Proceedings of the National Academy of Sciences, 105(42), p.16089-16094. Andersen, L.E. et al., 2002. The dynamics of deforestation and economic growth in the Brazilian
Amazon, Cambridge: Cambridge University Press.
Andrade de Sá, S., Palmer, C. & Di Falco, S., 2013. Dynamics of indirect land-use change: Empirical evidence from Brazil. Journal of Environmental Economics and Management, 65(3), p.377-393.
Angelsen, A. & Kaimowitz, D., 1999. Rethinking the Causes of Deforestation: Lessons from Economic Models. The World Bank Research Observer, 14(1), p.73-98.
Araujo, C. et al., 2009. Property rights and deforestation in the Brazilian Amazon. Ecological
Economics, 68(8-9), p.2461-2468.
Barbier, E.B., 2004. Explaining agricultural land expansion and deforestation in developing countries.
American Journal of Agricultural Economics, 86(5), p.1347–1353.
Barbier, E.B. & Burgess, J.C., 1997. The Economics of Tropical Forest Land Use Options. Land
Economics, 73(2), p.174-195.
Barona, E. et al., 2010. The role of pasture and soybean in deforestation of the Brazilian Amazon.
Environmental Research Letters, 5(2), p.024002.
Binswanger, H.P., 1991. Brazilian policies that encourage deforestation in the Amazon. World
Development, 19(7), p.821-829.
Cattaneo, A. & San, N.N., 2005. The Forest for the Trees. The Effects of Macroeconomic Factors on Deforestation in Brazil and Indonesia. In C. A. Palm et al., ed. Slash-and-burn agriculture: the
search for alternatives. Columbia University Press, p. 171-196.
Chomitz, K.M. & Gray, D.A., 1996. Roads, Land Use, and Deforestation: A Spatial Model Applied to Belize. The World Bank Economic Review, 10(3), p.487 -512.
Chomitz, K.M. & Thomas, T.S., 2003. Determinants of land use in Amazonia: a fine-scale spatial analysis. American Journal of Agricultural Economics, 85(4), p.1016–1028.
Choumert, J., Combes Motel, P. & Dakpo, H.K., 2013. Is the Environmental Kuznets Curve for deforestation a threatened theory? A meta-analysis of the literature. Ecological Economics, 90, p.19-28.
18 Corrêa de Oliveira, R. & Simões de Almeida, E., 2010. Deforestation in the Brazilian Amazonia and
spatial heterogeneity: a local environmental Kuznets curve approach. In 57th Annual North
American Meetings of the Regional Science Association International. Available at:
http://www.poseconomia.ufv.br/docs/Seminario08-10-2010ProfEduardo.pdf.
Cropper, M., Puri, J. & Griffiths, C., 2001. Predicting the Location of Deforestation: The Role of Roads and Protected Areas in North Thailand. Land Economics, 77(2), p.172-186.
Culas, R.J., 2012. REDD and forest transition: Tunneling through the environmental Kuznets curve.
Ecological Economics, 79, p.44-51.
Deininger, K. & Minten, B., 2002. Determinants of Deforestation and the Economics of Protection: An Application to Mexico. American Journal of Agricultural Economics, 84(4), p.943-960.
Dietz, S. & Adger, W.N., 2003. Economic growth, biodiversity loss and conservation effort. Journal of
Environmental Management, 68(1), p.23-35.
Dinda, S., 2004. Environmental Kuznets Curve Hypothesis: A Survey. Ecological Economics, 49(4), p.431-455.
Drukker, D.M., Prucha, I.R. & Raciborski, R., 2011. A command for estimating spatial-autoregressive models with spatial-autoregressive disturbances and additional endogenous variables. The
Stata Journal, 1(1), p.1–13.
Ewers, R.M. & Rodrigues, A.S.L., 2008. Estimates of reserve effectiveness are confounded by leakage.
Trends in Ecology & Evolution, 23(3), p.113-116.
Fearnside, P.M., 2009. Carbon benefits from Amazonian forest reserves: leakage accounting and the value of time. Mitigation and Adaptation Strategies for Global Change, 14(6), p.557-567. Ferraro, P.J., Hanauer, M.M. & Sims, K.R.E., 2011. Conditions associated with protected area success
in conservation and poverty reduction. Proceedings of the National Academy of Sciences, 108(34), p.13913-13918.
Gaston, K.J. et al., 2008. The Ecological Performance of Protected Areas. Annual Review of Ecology,
Evolution, and Systematics, 39(1), p.93-113.
Gaveau, D.L.A. et al., 2009. Evaluating whether protected areas reduce tropical deforestation in Sumatra. Journal of Biogeography, 36(11), p.2165–2175.
Geist, H.J. & Lambin, E.F., 2002. Proximate causes and underlying driving forces of tropical deforestation. BioScience, 52(2), p.143–150.
Igliori, D.C., 2006. Deforestation, Growth and Agglomeration Effects: Evidence from Agriculture in the Brazilian Amazon. Available at:
http://www.anpec.org.br/encontro2006/artigos/A06A102.pdf.
IPCC, 2007. Climate Change 2007: the physical science basis. Contribution of Working Group I to the
Fourth Assessment Report of the Intergovernmental Panel on Climate Change S. Solomon et
al., ed., Cambridge UK: Cambridge University Press.
Joppa, L.N. & Pfaff, A.S.P., 2009. High and Far: Biases in the Location of Protected Areas. PLoS ONE, 4(12), p.e8273.
19 Harry H. Kelejian and Ingmar R. Prucha. Estimation of Simultaneous Systems of Spatially Interrelated Cross Sectional Equations. Journal of Econometrics, 118, 2004, 27-50.
Kim, C.W., Phipps, T.T. & Anselin, L., 2003. Measuring the benefits of air quality improvement: a spatial hedonic approach. Journal of Environmental Economics and Management, 45(1), p.24-39.
Laurance, W.F. et al., 2012. Averting biodiversity collapse in tropical forest protected areas. Nature, 489(7415), p.290-294.
Mendonça, M.J., Loureiro, P.R.A. & Sachsida, A., 2012. The dynamics of land-use in Brazilian Amazon.
Ecological Economics, 84, p.23-36.
Mertens, B. et al., 2002. Crossing spatial analyses and livestock economics to understand deforestation processes in the Brazilian Amazon: The case of São Félix do Xingú in South Pará. Agricultural economics, 27(3), p.269–294.
Mertens, B. et al., 2004. Modeling Deforestation at Distinct Geographic Scales and Time Periods in Santa Cruz, Bolivia. International Regional Science Review, 27(3), p.271-296.
Nepstad, D. et al., 2006. Inhibition of Amazon Deforestation and Fire by Parks and Indigenous Lands.
Conservation Biology, 20(1), p.65–73.
Nepstad, D. et al., 2009. The End of Deforestation in the Brazilian Amazon. Science, 326(5958), p.1350-1351.
Palmer, C. & Di Falco, S., 2012. Biodiversity, poverty, and development. Oxford Review of Economic
Policy, 28(1), p.48-68.
Pfaff, A.S.P. et al., 2014. Governance, Location and Avoided Deforestation from Protected Areas: Greater Restrictions Can Have Lower Impact, Due to Differences in Location. Land Tenure and
Forest Carbon Management, 55(0), p.7-20.
Pfaff, A.S.P. et al., 2009. Park Location Affects Forest Protection: Land Characteristics Cause
Differences in Park Impacts across Costa Rica. The B.E. Journal of Economic Analysis & Policy, 9(2). Available at:
http://www.degruyter.com/dg/viewarticle/j$002fbejeap.2009.9.2$002fbejeap.2009.9.2.199 0$002fbejeap.2009.9.2.1990.xml.
Pfaff, A.S.P., 1999. What Drives Deforestation in the Brazilian Amazon?: Evidence from Satellite and Socioeconomic Data. Journal of Environmental Economics and Management, 37(1), p.26-43. Sánchez-Azofeifa, G.A. et al., 2003. Integrity and isolation of Costa Rica’s national parks and biological
reserves: examining the dynamics of land-cover change. Biological Conservation, 109(1), p.123-135.
Sims, K.R.E., 2010. Conservation and development: Evidence from Thai protected areas. Journal of
Environmental Economics and Management, 60(2), p.94-114.
Soares-Filho, B.S. et al., 2010. Role of Brazilian Amazon protected areas in climate change mitigation.
20 Walker, R., Moran, E. & Anselin, L., 2000. Deforestation and Cattle Ranching in the Brazilian Amazon:
External Capital and Household Processes. World Development, 28(4), p.683-699.
21
Appendix
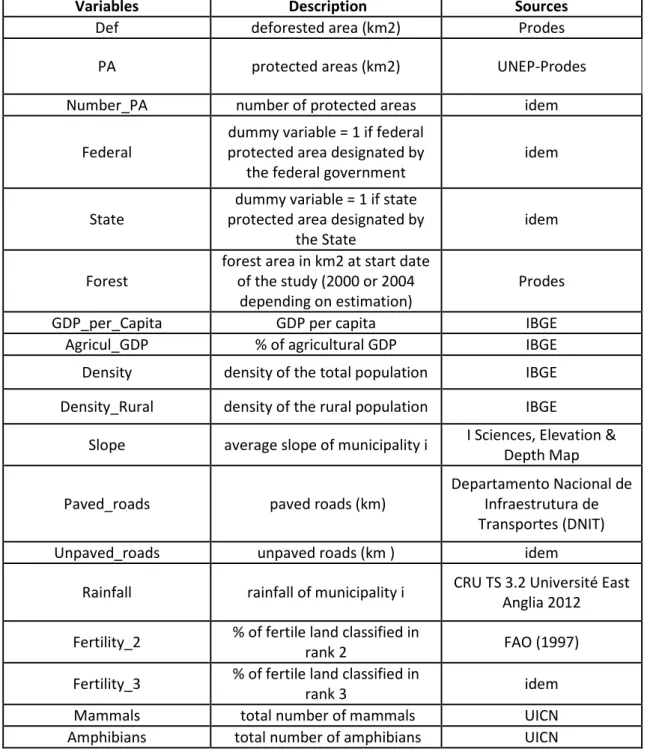
Table 1. Variables, definitions, and descriptive statistics
Variables Description Sources
Def deforested area (km2) Prodes
PA protected areas (km2) UNEP-Prodes
Number_PA number of protected areas idem
Federal
dummy variable = 1 if federal protected area designated by
the federal government
idem
State
dummy variable = 1 if state protected area designated by
the State
idem
Forest
forest area in km2 at start date of the study (2000 or 2004
depending on estimation)
Prodes
GDP_per_Capita GDP per capita IBGE
Agricul_GDP % of agricultural GDP IBGE
Density density of the total population IBGE Density_Rural density of the rural population IBGE
Slope average slope of municipality i I Sciences, Elevation & Depth Map
Paved_roads paved roads (km)
Departamento Nacional de Infraestrutura de Transportes (DNIT)
Unpaved_roads unpaved roads (km ) idem
Rainfall rainfall of municipality i CRU TS 3.2 Université East Anglia 2012 Fertility_2 % of fertile land classified in
rank 2 FAO (1997)
Fertility_3 % of fertile land classified in
rank 3 idem
Mammals total number of mammals UICN
22
Table 2. Spatial autocorrelation tests
Deforestation Protected areas
Test Test statistic P-value Test statistic P-value
Morans' I test 2.479** 0.013 2.847*** 0.004
Robust LMLag 23.848*** 0.000 7.275*** 0.007
Robust LMError 3.057* 0.080 9.087*** 0.003
Table 3. Orthogonality test of Nakamura Nakamura
Deforestation Coef. Std. Err. P-value
PA -.002693*** .0005887 0.000 Resid_PA ( ) .0450097* .0252102 0.074 Number_PA .452751 .9433001 0.631 Federal -10.2266* 5.948994 0.086 State 7.110211 5.864599 0.225 Forest .0039963*** .0005351 0.000 GDP_per_Capita -1.861845*** .6902854 0.007 Agricul_GDP .7628195*** .1399373 0.000 Density -.0220418 .0431836 0.610 Slope -.0005134 .0040176 0.898 Paved_roads .1488197*** .047559 0.002 Unpaved_roads .0434556 .0297843 0.145 Rainfall_01_09 .001716 .0127079 0.893 Fertility_2 24.72548 15.26731 0.105 Fertility_3 28.55322* 17.03303 0.094 Rondonia 1.743184 16.72844 0.917 Acre -51.53479** 21.88285 0.019 Amazonias -70.78485*** 18.04895 0.000 Roraima -14.47486 30.47281 0.635 Pará 17.11196 14.62398 0.242 Amapá -13.37414 30.7352 0.663 Tocantins -16.96714 12.07772 0.160 Mato Grosso -12.80896 12.51424 0.306 _cons -49.58187 40.5596 0.222
23
Table 4. OLS estimation of protected areas (equation 2)
PA Coef. Std. Err. P-value
Number_PA 19.12115 56.14209 0.734 Federal -334.5865 338.1631 0.323 State 226.8113 344.9658 0.511 Forest .8305306*** .0138256 0.000 GDP_per_Capita 15.43226 33.28979 0.643 Agricul_GDP 6.090768 8.999596 0.499 Density .6533068 2.089787 0.755 Slope .290781 .2155422 0.178 Paved_roads -1.682691 2.955839 0.569 Unpaved_roads -.3966959 1.909814 0.836 Rainfall_01_09 -.780362 .4928342 0.114 Fertility_2 -1037.389 795.8079 0.193 Fertility_3 -1743.895** 824.2841 0.035 Rondonia 3422.519*** 816.9755 0.000 Acre 1433.918 1223.421 0.242 Amazonias -3513.126*** 933.992 0.000 Roraima 1286.707 1152.655 0.265 Pará 675.8377 585.2837 0.249 Amapá 1457.59 1077.58 0.177 Tocantins 1408.419*** 464.8389 0.003 Mato Grosso 518.1593 542.7852 0.340 Mammals 69.83424*** 17.3326 0.000 Amphibians -99.84539*** 20.52301 0.000 _cons -3999.476 2471.511 0.106
24
Table 5. Over-identification test
Error terms of
equation (1) Coef. Std. Err. P-value
Number_PA -.1498476 .838229 0.858 Federal -.6288167 4.96473 0.899 State .0048021 5.111749 0.999 Forest -.0000784 .0002107 0.710 GDP_per_Capita .0445277 .4926936 0.928 Agricul_GDP -.0230511 .1368087 0.866 Density -.0017245 .0314405 0.956 Slope -.0003073 .0031378 0.922 Paved_roads .0042017 .0443491 0.925 Unpaved_roads -.0020489 .0286409 0.943 Rainfall_01_09 .0009319 .0069517 0.893 Fertility_2 -1.109804 11.73294 0.925 Fertility_3 -.4788844 12.0874 0.968 Rondonia -12.4827 11.75768 0.288 Acre -8.858439 17.6488 0.616 Amazonias -5.020676 13.54445 0.711 Roraima 3.690782 16.07516 0.818 Pará -2.642356 8.246869 0.749 Amapá -14.50282 15.40922 0.347 Tocantins -6.536191 6.726069 0.331 Mato Grosso -1.487643 7.706027 0.847 Mammals -.2204412 .2461729 0.371 Amphibians .4086206 .3053852 0.181 _cons -8.193359 35.86386 0.819 lambda .3732115 .1981999 0.060 rho -.1214484 .2555532 0.635 sigma2 2287.849 152.9582 0.000 Wald chi2(23) 4.8257 - 1.000
25
Table 6. Estimation results of instrumental variables model
Deforestation Coef. Std. Err. P-value
PA -0.0040717** 0.0015064 0.007 Number_PA 0.6246317 0.8981904 0.487 Federal -12.55995** 5.744213 0.029 State 6.889649 5.718099 0.228 Forest 0.0053399*** 0.0012788 0.000 GDP_per_Capita -0.9896033* 0.5484028 0.071 Agricul_GDP 0.7602452*** 0.1414736 0.000 Density 0.0332056 0.0327784 0.311 Slope 0.000702 0.0036837 0.849 Paved_roads 0.1739771*** 0.0473072 0.000 Unpaved_roads 0.0453117 0.0302461 0.134 Rainfall_01_09 0.0076153 0.0090567 0.4 Fertility_2 15.25102 13.17911 0.247 Fertility_3 21.37597 14.22859 0.133 Rondonia 2.088952 11.19014 0.852 Acre -36.18523** 16.24966 0.026 Amazonias -78.84084*** 15.19282 0.000 Roraima -8.079565 18.92332 0.669 Pará 10.15148 10.02642 0.311 Amapá -11.41063 18.59311 0.539 Tocantins -10.70559 9.327439 0.251 Mato Grosso -6.716296 9.562614 0.482 _cons -44.76779 28.09276 0.111 lambda 0.2460787*** 0.0673936 0.000 Rho 0.2705836*** 0.0756645 0.000
26
Table 7. Marginal effects of instrumental variables model and simultaneous equations (2001 - 2009)
Instrumental variables model Simultaneous equations Deforestation Deforestation Protected areas
WDef 11.0538 WPA 0.0008 -0.0795 Def -43.5432 PA -0.0055 -0.0103 Number_PA 0.8819 1.4302 88.5177 Federal -14.1522 -14.3671 -794.6418 State 8.1566 8.7015 513.784 Forest 0.0068 0.0105 0.8516 GDP_per_Capita -1.1845 -1.0228 -42.9961 Agricul_GDP 0.9029 0.7624 35.82 Density 0.0377 0.0313 1.58199 Slope 0.001 0.0026 0.2159 Paved_roads 0.2166 0.1369 4.0306 Unpaved_roads 0.0536 0.0486 2.6362 Rainfall_01_09 0.0075 -0.0010 -0.3497 Fertility_2 15.3915 5.1580 -153.5696 Fertility_3 16.5648 5.6468 -467.905
27
Table 8. Simultaneous equations results and robustness
2001-2009 2001-2004 2005-2009
deforestation area_ap_tot deforestation area_ap_tot deforestation_05_09_1 area_ap_tot_2
Coef. Std. Err. Coef. Std. Err. Coef. Std. Err. Coef. Std. Err. Coef. Std. Err. Coef. Std. Err.
WDef 0.4678377*** 0.0732292 12.0091** 6.123357 0.4821192*** 0.0684592 8.101882* 4.640513 0.4464987*** 0.0766142 15.82003* 8.387351 WPA 0.0007995* 0.0004318 -0.0864217** 0.0277334 0.0035734*** 0.00094 0.0033184 0.0455487 0.0005954* 0.0003283 -0.0870711** 0.0279544 PA -0.0102767*** 0.0013106 . . -0.0151829*** 0.0014605 . . -0.007446*** 0.0010079 . . Def . . -47.30633*** 6.63272 . . -44.14569*** 4.619433 . . -58.151*** 9.239931 Number_PA 1.430243 0.9014506 96.1676* 58.03819 100.945*** 17.22767 6258.313*** 763.3353 1.794355** 0.6860413 138.1007** 59.35506 Federal -14.3671** 5.694003 -863.3162** 369.7742 70.42069*** 17.80299 4523.188*** 833.8238 -8.911193** 4.320825 -734.9985** 367.3792 State 8.701473 5.665642 558.1861 365.7333 9.723788 8.137902 590.8413 408.4188 6.656205 4.323638 551.8641 368.0812 Forest 0.0105436*** 0.0011223 0.9252288*** 0.0186151 0.0115871*** 0.0008959 0.7054119*** 0.0171763 0.0076664*** 0.0008724 0.9223908*** 0.0186143 GDP_per_Capita -1.022765* 0.5435942 -46.71197 35.54714 -2.09423** 0.7926821 -109.3846** 40.24907 -0.9584807** 0.4180658 -61.30014* 36.24866 Agricul_GDP 0.7623579*** 0.1400429 38.91567*** 10.26965 116.2441*** 18.94465 5690.185*** 1048.752 56.67477*** 10.74191 3799.055*** 1024.122 Density 0.0313036 0.0323882 1.71871 2.091652 0.0451128 0.0483717 1.980307 2.451986 0.0163323 0.023179 1.278573 1.967041 Slope 0.0025876 0.0036624 0.2345655 0.2344255 0.005109 0.0051905 0.3344138 0.2607886 0.0026986 0.0028109 0.3130086 0.2366905 Paved_roads 0.1369486** 0.0468234 4.379031 3.223408 0.2669916*** 0.065249 12.3303*** 3.476514 0.1115618** 0.0355437 4.769544 3.250964 Unpaved_roads 0.0485618 0.0298672 2.864106 1.930179 0.0083633** 0.0428687 -1.099477 2.164534 0.0240135 0.0228457 2.163012 1.933805 Rainfall_01_09 -0.0010137 0.0091918 -0.3799482 0.613929 0.0455009 0.0140501 2.696395*** 0.7072874 -0.0080565 0.0066714 -0.6398749 0.5926785 Fertility_2 5.157979 13.05833 -166.8414 841.4507 12.79702** 18.45074 464.5327 936.4536 0.6624451 9.918701 -320.184 840.7927 Fertility_3 5.646768 14.11942 -508.3422 906.954 23.5117 19.74606 960.2818 1006.453 0.2719887 10.71958 -736.1878 903.777 Rondonia 7.702389 11.24901 1767.477* 998.0969 4.917449 16.81452 1144.619 1098.154 7.650112 8.547138 2023.504** 1006.785 Acre -22.34697 16.71802 -563.0104 1446.962 -67.23374** 25.88112 -2823.09* 1620.63 -15.38125 12.36218 -295.5069 1444.101 Amazonas -85.03469*** 16.13095 -6173.915*** 1216.349 -115.7141*** 24.13608 -6127.086*** 1374.112 -58.86848*** 11.73451 -5728.897*** 1170.034 Roraima 31.1813 20.59352 1735.191 1423.59 27.16859 30.8044 1176.788 1651.334 28.23529* 15.64494 2222.108 1428.849 Pará 21.98124 10.27876 1266.881* 701.6971 -14.08605 14.65754 -1107.871 777.5989 24.29247** 8.050943 1698.41** 741.8391 Amapá 9.833545 19.4856 816.7834 1351.508 -0.0359168 28.80473 240.6115 1548.898 14.79171 14.4741 1416.329 1331.751 Tocantins 0.2269093 9.607198 624.6576 631.0509 -15.4467 14.14464 -828.5906 723.3028 1.494169 7.144097 786.3594 620.6694 Mato Grosso 0.3022895 9.618538 305.7167 652.3845 -7.536581 14.0255 -672.5865 742.5165 -2.929128 7.401034 136.8865 663.5595 Mammals . . 37.45083* 20.21893 . . 16.61508 19.8492 . . 37.7094* 21.65659 Amphibians . . -45.31078* 24.11789 . . -34.87404 24.29791 . . -49.86185** 25.28773 _cons -22.45175 22.13209 -3883.874 2761.65 -149.5863*** 31.25761 -12690.53*** 3020.897 -5.595872 16.80464 -3296.191 2845.022