HAL Id: halshs-00597521
https://halshs.archives-ouvertes.fr/halshs-00597521
Preprint submitted on 1 Jun 2011HAL is a multi-disciplinary open access
archive for the deposit and dissemination of sci-entific research documents, whether they are pub-lished or not. The documents may come from teaching and research institutions in France or abroad, or from public or private research centers.
L’archive ouverte pluridisciplinaire HAL, est destinée au dépôt et à la diffusion de documents scientifiques de niveau recherche, publiés ou non, émanant des établissements d’enseignement et de recherche français ou étrangers, des laboratoires publics ou privés.
Christian Hubert Ebeke, Mireille S. Ntsama Etoundi
To cite this version:
Christian Hubert Ebeke, Mireille S. Ntsama Etoundi. Presidential elections and the manipulation of exam success rate in Sub-Saharan Africa. 2011. �halshs-00597521�
CERDI, Etudes et Documents, E 2011.14
C E N T R E D'E T U D E S E T D E R E C H E R C H E S S U R L E D É V E L O P P E M E N T I N T E R N A T I O N A L
Document de travail de la série
Etudes et Documents
E 2011.14
Presidential elections and the manipulation of exam success rate
in Sub-Saharan Africa
Christian Ebeke
and
Mireille Ntsama Etoundi
May, 2011
CERDI
65 BD.F. MITTERRAND
63000 CLERMONT FERRAND – FRANCE TEL.0473717420
FAX 0473177428
Les auteurs
Christian EBEKE
PhD student, Clermont Université, Université d’Auvergne, CNRS, UMR 6587, Centre d’Etudes et de Recherches sur le Développement International (CERDI), F-63009 Clermont-Ferrand, France E-mail : Christian_Hubert.Ebeke@u-clermont1.fr
Mireille NTSAMA ETOUNDI
PhhD Student, Université de Yaoundé 2-Soa (Cameroon) and Centre d’Etudes et de Recherches sur le Développement International (Cerdi), BP 10448, F-63000 Clermont-Ferrand. CNRS, UMR 6587, CERDI, F-63009 Clermont-Ferrand – France
E-mail : Mireille.Ntsama_Etoundi@u-clermont1.fr
La série des Etudes et Documents du CERDI est consultable sur le site :
http://www.cerdi.org/ed
Directeur de la publication : Patrick Plane
Directeur de la rédaction : Catherine Araujo Bonjean Responsable d’édition : Annie Cohade
ISSN : 2114-7957
Avertissement :
Les commentaires et analyses développés n’engagent que leurs auteurs qui restent seuls responsables des erreurs et insuffisances.
CERDI, Etudes et Documents, E 2011.14
Abstract
This paper investigates whether the exam success rate in Africa increases significantly in the months prior to the occurrence of the presidential elections. It hypothesizes that the incumbent is tempted to increase the exam success rate to retain a form of social cohesion and to ‘buy’ votes. A sample of 15 francophone African countries observed from 1990 to 2009 yields three findings. First, post-exam presidential elections significantly increase the exam success rate by six percentage points. Second, the manipulation of the exam success rate is positively correlated with the re-election of the incumbent. Third, these results do not hold when elections occur before the exam dates or when the incumbent or a member of his/her party do not run for the presidential seat.
JEL codes: D72 I25 O15
Keywords: Presidential elections, Exam success rate, Sub-Saharan Africa
Acknowledgements
We sincerely thank Jean-Louis Combes and Simon Ebeke à Riwou for their insightful comments on an earlier draft of this paper.
1. Introduction
For most African countries, the democratization process started in the early 1990s and this has launched competitive elections. There are many strategies to which the incumbent resorts when running for re-election. Collier and Vicente (2010) identified three of the principal ones: vote buying, violence/intimidation and ballot frauds. In this paper, we explore vote-buying strategy in more depth using a sample of Sub-Saharan African countries.
Many papers have tested the existence of political economic cycles in developing countries. In other words, they have tested whether the incumbent party decides at its own discretion to modify the levels of public spending or the amount of monetary aggregates in the months before the presidential election (Fouda, 1997; Brender and Drazen, 2005; Shi and Svensson, 2006). Although these papers have contributed to the debate on the existence of political business cycles in least developed regions, a principal limitation is that they have only replicated the tests of political business cycles performed in advanced countries by testing the behaviour of monetary and fiscal aggregates. They have not explored other variables that are under the control of public authorities in developing countries and can provide political gain.
This paper tests the existence of a political cycle in the education sector in Africa. It provides an empirical test of the hypothesis that exam success rates are abnormally high in the year of presidential elections. The paper therefore defends the hypothesis that the incumbent temporarily modifies the rules governing exam reviews in order to increase the number of students obtaining their diploma, a strategy designed to secure the votes of parents and to maintain a form of social cohesion and peace just before the elections.
Three steps are required to provide the empirical test of these conjectures. (i) It is necessary to use a group of countries comparable in a number of aspects, so the paper focuses analysis on a group of countries sharing the common official language in Africa (French), the same education system and a similar national exam calendar. In these francophone countries, exam dates generally occur during June or July of each year. (ii) The existence of a political education cycle requires that elections (notably the presidential ones) on average occur after the exam calendar. In this context, the incumbent chooses ex ante the exam success rate that can maximize his/her chances of being re-elected. One should therefore check whether
5
presidential elections in the sample often occur in the last quarter of the year. (iii) The effect of the election dummy on the exam success rate must identify the marginal increase of the exam success rate solely owed to the presidential election, which means that we need to reduce any confounding bias. To achieve this objective, a large set of control variables needs to be included in the model (the strategy is called selection on observables). Bias could remain, however, owing to unobservable characteristics which could be simultaneously correlated with the occurrence of an election and with the exam success rate. This paper thus provides an instrumental variable strategy to identify the impact of the occurrence of a presidential election on the exam success rate. (iv) Finally, the paper examines whether such a strategy consisting in the manipulation of the education outcomes before the elections really has a political payoff. The task is conducted by quantifying the effect of the exam success rate on the probability that the incumbent will be re-elected after controlling for the extent of fraud and political competition during the election.
A sample of 15 francophone countries (observed over the period 1990 to 2009) gave the following results: (i) the post-exam presidential elections significantly increase the exam success rate, (ii) the manipulation of the exam success rate ensures the re-election of the incumbent and (iii) these results do not hold when elections occur before the exam dates or when the incumbent or a member of his/her party does not run for the presidential seat.
The remainder of the paper is as follows. Section 2 presents the empirical models of the relationship between the presidential elections and the exam success rate and discusses the results obtained. Section 3 provides some robustness checks. Section 4 examines whether the manipulation of the exam success rate before the election really has a political payoff. Section 5 concludes.
2. Presidential elections and education outcomes in Africa: empirical design
This section examines whether (i) the exam success rates are higher in the year of presidential elections, and (ii) a higher exam success rate in the months prior to the elections helps to increase the incumbent’s (or his/her chosen successor) chances of re-election. Before we turn to the econometric specifications, a closer look at the election data in the sample is crucial in order to highlight some stylized facts.
2.1. Stylized facts
Figure 1 shows the distribution of the number of elections over the quarters. The figure shows that presidential elections are more likely to occur in the last quarter of the year. The number of elections is higher between October and December.
Figure 1: Number of elections over the quarters
13 11 10 18 0 5 1 0 1 5 2 0 Q1 Q2 Q3 Q4
Data source: Database on Political Institutions
The fact that elections in the francophone African countries generally occur at the end of the year is crucial in supporting our econometric investigations. Indeed, the test of the political education cycle using annual data requires that the presidential election appears late in the year so that it can sufficiently influence the outcome variable observed earlier.1
Another requirement associated with the empirical validation of the political education cycle is the temporary nature of the manipulation of the education outcomes by the incumbent. One should therefore observe similar exam success rates for the years before and after the election year and a deviation in the education variable during the election year. In other words, outside the election year but mostly after the observed exam success rates exhibit their regular (or structural) pattern. In contrast, the observed exam success rates in the election year are
1 For our purpose, the exogenous fixation of exam dates in the middle of the year (owing to the French colonial heritage)
7
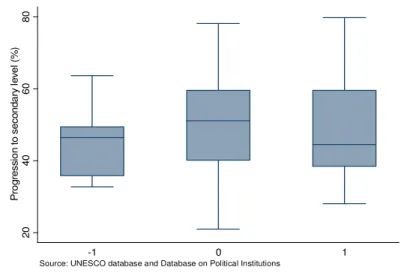
affected by a transitory positive shock. Figure 2 shows the statistics (median and percentiles) of the exam success rates for the year just before the election, the year of election and the immediate year after the election. The figure does not reject the hypothesis that the exam success rate returns to a lower value the year after the election. More interestingly, the median value of the exam success rate in the year of the presidential election exceeds the ones before and after the election. This provides preliminary evidence that education outcomes can be manipulated by the incumbents for electoral purposes.
Figure 2: Exam success rate in the month before, during and after the presidential election
2 0 4 0 6 0 8 0 P ro g re s s io n t o s e c o n d a ry l e v e l (% ) -1 0 1
Source: UNESCO database and Database on Political Institutions
Note: In box plots, the lower and upper hinges of each box show the 25th and 75th percentiles of the samples, the line in the
box indicates the respective medians, and the end-points of whiskers mark next adjacent values.
The next sub-section provides the econometric analysis of the effect of the presidential election on exam success rates.
2.2. Testing the existence of a political education cycle
The following model allows the quantification of the effect of the presidential elections on education outcomes (measured by the exam success rate). It takes the following form:
t c t c t c t c t c X e r, = ′,β +θ1 , +γ +η +ε , (1)
where r is the exam success rate in each country c at year t. e represents the presidential election dummy (a variable taking 1 if there is a presidential election after the period from June to July and 0 otherwise). X is the matrix of control variables likely to affect the education outcomes: per capita income, inflation, rural population and the education sector inputs such as public education spending, education aid and the pupil-teacher ratio.
γ
c andη
t are the country fixed effect and the year dummies.θ
1 identifies the effect of the presidential election on the exam success rate and is expected to be positive.The dependent variable is measured as the annual progression rate to the secondary level. It measures the proportion of students enrolled in the final primary level who have obtained in that year their First School Leaving Certificate (FSLC). Data are drawn from the UNESCO statistical division.
Given that there are no publicly available data on exam success rate for other grades such as progression to the tertiary levels (the GCE advanced level) in this database, we only focus our attention on the measure which is available. Moreover, we think that this lack of data is not a great drawback for our study because it is not clear that the political manipulation of the exam success rates holds only for one type of exam and not for others. Indeed, one could even argue that if the political education cycle really exists such will be the case for all the national exams in the country since it appears sensible for the incumbent to manipulate the outcomes at all levels to maximize the political payoff and also to ensure the equilibrium of the distribution of the school enrolment rates at all grades. Hence, using the progression rate to the secondary level as a proxy for the overall exam success rate seems relevant.
The variable of interest is the election dummy. This variable takes 1 if a presidential election occurs in a country c after July of year t and 0 otherwise. Original data on presidential elections are drawn from the World Bank Database on Political Institutions (DPI, various editions).
All the control variables in model 1 are drawn from the World Development Indicators dataset except public education spending and education aid, which are drawn from the IMF-WEO dataset and OECD-CRS dataset, respectively. The analysis is based on a sample of 15 francophone African countries observed over the period 1990 to 2009. The table of descriptive statistics and the list of countries are presented in the appendix.
9
Table 1 presents the results of the econometric estimations of model 1. Whatever the specifications the effect of the post-exam presidential elections on the progression rate to the secondary level is significant and positive. This result does not reject the hypothesis that a political education cycle exists in the francophone African countries. In terms of magnitude, the coefficient associated with the presidential election stands between 3 and 4%. Therefore, on average, the exam success rate is abnormally high in the year of presidential elections.
Table 1: Impact of presidential elections on the country exam success rate
Dependent variable:
Exam success rate (1) (2) (3) (4) (5)
Election dummy 3.096** 4.177*** 4.177*** 2.910* 3.181**
(2.878) (4.364) (4.364) (2.033) (2.845)
log GDP per capita -4.960 -9.262 -9.262 2.847 -4.945
(-0.704) (-1.447) (-1.447) (0.803) (-0.700)
Inflation rate -0.0598*** 29.13 29.13 8.646 -0.0594***
(-3.356) (1.575) (1.575) (0.508) (-3.311)
Rural population (%) 0.409 0.944 0.944 1.929 0.436
(0.492) (0.626) (0.626) (1.602) (0.519) Pupil-teacher ratio in the primary -0.437* -0.437*
(-2.068) (-2.068)
Public education spending-to-GDP 0.241
(0.410) Education aid-to-GDP -0.186 (-0.248) Intercept 34.75 77.12 77.12 -126.0 32.74 (0.421) (0.781) (0.781) (-1.268) (0.400) Observations 130 99 99 105 130 R-squared 0.717 0.554 0.554 0.737 0.717 Countries 15 15 15 14 15
Notes: Robust t-statistics in parentheses. All the equations include a full set of country and year fixed effects. *** p<0.01, ** p<0.05, * p<0.1
3. Robustness checks
a) Are the post-exam elections the only ones that really matter?
We begin by examining whether we obtain the same results if the exam success rates also significantly increase when the presidential elections occur before the school exams. A new election dummy variable is therefore created and takes one for the presidential elections taking place in the first semester (January to June) of the year. Indeed, the validation of the political education cycle is based on the requirement that ‘only’ the post-exam presidential elections would have a significant effect on exam outcomes. To implement this test, the model 1 is re-estimated by replacement of the former election dummy with a new election dummy. The results of the estimations are presented in column 1 of Table 2. The results do not reject the null hypothesis that only the post-exam presidential elections could positively and significantly affect the exam success rate whereas the other presidential elections occurring before the end of the school year have no effect.
b) What happens if the incumbent (or a member of his/her party) does not run?
The second sensitivity analysis investigates whether the existence of the political education cycle depends upon the participation of the incumbent (or a chosen successor) in the electoral contest. In other words, the hypothesis that the political education cycle is more likely to occur if the incumbent is running for re-election is tested. This is justified by the fact that the manipulation of the exam success rate could only be controlled and achieved by the incumbent. To achieve this objective, the dummy variable for the post-exam presidential election is replaced by a dummy variable taking 1 if the incumbent or a member of his/her party, are not running for presidential election and 0 otherwise. We expect a non-significant effect of this dummy on the exam success rate.
Results are presented in column 2 of Table 2. The results suggest that the exam success rate is not significantly affected when the incumbent or a member of his/her party are not running for presidential election. Moreover, the coefficient exhibits a negative sign. In other words, the exam success rates are lower in the election year in which the incumbent (or a chosen successor) is not running. This can be explained by the fact that the absence of the incumbent (or a chosen successor) from the presidential contest in these African countries is often the
11
result of a coup d’état or socio-political disruptions which badly affect education outcomes in that year.
Table 2: Robustness checks and sensitivity analyses
Dependent variable: Exam success rate (1) (2) (3)
Incumbent or a chosen successor doesn't run -7.018** (-2.385)
First semester elections 0.737
(0.463)
Predetermined election 6.471**
(2.911)
Endogenous election -2.315
(-0.612)
log GDP per capita -6.596 -8.178 -9.616
(-0.855) (-1.094) (1.634)
Inflation rate 29.54 28.63 32.31
(1.308) (1.426) (1.690)
Rural population (%) -0.452* -0.448* 0.600
(-2.059) (-1.980) (0.401) Pupil-teacher ratio in the primary 0.605 0.962 -0.428* (0.390) (0.637) (1.99)
Observations 98 99 99
R-squared 0.540 0.536 0.570
Countries 15 15 15
Notes: Robust t-statistics in parentheses. All the equations include a full set of country and year fixed effects. *** p<0.01, ** p<0.05, * p<0.1
c) Dealing with the endogeneity of the presidential election variable
So far we have ignored the question of the endogeneity of the election timing in the sample. Indeed, one could argue that the effect of the presidential election dummy is biased because the occurrence of the election and its timing are not random and the occurrence of presidential elections and education outcomes could be influenced by a number of unobserved variables. One way to mitigate the potentially omitted variable bias is to focus on presidential elections whose timing is predetermined relative to current socio-economic outcomes. To achieve this, we follow Brender and Drazen (2005) and Shi and Svensson (2006) by distinguishing whether the presidential election is predetermined (i.e. the election is held on the date (year) specified
by the national constitution, or the election occurs in the last year of a constitutionally fixed term for the legislature or the election is announced at least a year in advance) or endogenous (i.e. an election that was not predetermined took place).2
Model 1 is re-estimated with the post-exam presidential election dummy being replaced by two dummy variables indicating whether the election is predetermined or endogenous. The results are presented in Table 2, column 3. The coefficient of predetermined presidential elections enters the regression negatively and significantly whereas the coefficient of the endogenous presidential elections is not statistically different from zero. The coefficient associated with the predetermined post-exam presidential election dummy implies that, on average, the national exam success rate is six percentage points higher in years when predetermined elections take place. Compared with the OLS results presented in Table 1, this estimate is higher.
4. Does the political education cycle really have a payoff?
The next task is to quantify the political payoff of the ex ante manipulation of the exam results by the incumbent.
We begin by plotting the statistics of the exam success rate amongst the sub-sample of countries in which the incumbent ran but lost and in countries in which the incumbent ran for and won the post-exam election (Figure 3). The figure shows a difference in the median values of the education outcomes between the two sub-samples. The median exam success rate seems higher in the case of the re-election of the incumbent (or a member of his/her former party) than in the other case.
A mean-difference test on the exam success rate is also performed among the sample of countries in which the incumbent or a member of his/her former party won the election and a sample of countries in which the incumbent or his/her party ran but lost. The result of the mean difference test indicates a significant difference between the average values of the
2 Of the 37 presidential elections (occurring in both the first and the second semester) in the sample, 65% are classified as
13
progression rate to the secondary level between the two sub-samples.3 More precisely, the average progression rate is higher in the sample of countries where the incumbent ran for and won the presidential elections occurring after the third quarter of the year. This is primary evidence in support of the hypothesis that education outcomes are manipulated before the elections for electoral purposes and this strategy works by helping the incumbent to stay in office.
Figure 3: Exam success rate before the incumbent or a chosen successor won or lost the election
3 0 4 0 5 0 6 0 7 0 P ro g re s s io n t o s e c o n d a ry l e v e l (% ) Lost Won
Source: UNESCO database and NELDA database
Note: In box plots, the lower and upper hinges of each box show the 25th and 75th percentiles of the samples, the line in the
box indicates the respective medians, and the end-points of whiskers mark next adjacent values.
The second exercise consists in measuring the effect of the exam success rate on the probability that the incumbent or a member of his/her party won the post-exam election. The dependent variable is a dummy taking 1 if the incumbent or a member of his/her party ran for and won the election and 0 if s/he ran for and lost the election.4 Despite the small number of
3 Results are available from the authors upon request. 4
We are interested in the correlation between the exam success rate and the probability of re-election. The reader may wonder if there is a selection bias in this sample since we only observe the outcomes for the incumbents or their ‘chosen successors’ who choose to run. A strategy for solving this problem is a Heckman procedure in two steps in which a selection model is estimated first (the model explains the decision of the incumbent or a member of his/her party to run for the election or not) and a second model explaining the results of the incumbent (s/he won or lost) is estimated by adding an inverse of the Mills ratio computed in the first stage to solve the selection bias. We are limited, however, to the number of observations provided by the National Elections across Democracy and Autocracy (NELDA) dataset which gives information aboutthe post-electoral status of the incumbent or his/her chosen successor. We only obtain 11 observations and we recognize that performing a Heckman two-step approach with this small sample can be misleading.
observations that we obtain for the results of presidential post-exam elections (only 11 observations), we estimate a linear probability model for the election results and a set of control variables including the exam success rate. The control variables intended to explain the probability that the incumbent stays in office are measures of the extent of fraud and electoral competition. These data were drawn from the Database on Political Institutions.
Table 3 presents the results of the linear probability model. The results indicate that a higher exam success rate is significantly associated with higher probability that the incumbent will win the election and this result holds even after controlling for the extent of vote fraud and electoral competition.
Table 3: The political payoff of controlling the national exam success rates:
Linear probability model Dependent variable:
The incumbent or a chosen successor is re(e)lected
Exam success rate 0.0332***
(5.993) Vote fraud 0.397** (2.645) Electoral competition -0.0988** (-2.634) log Population 0.245 (0.992) Intercept -4.663 (-1.209) Observations 11 Countries 7 R-squared 0.567
Notes: Robust t-statistics in parentheses. All the equations include a full set of country and year fixed effects. *** p<0.01, ** p<0.05, * p<0.1
15
5. Concluding remarks
This paper tested the existence of a political education cycle using a sample of Sub-Saharan African francophone countries. The econometric investigations did not reject the existence of such a cycle and highlighted four points: (i) presidential elections are more likely to occur after the exam results are known (after July) than before, (ii) post-exam presidential elections significantly increase the national exam success rate and finally (iii) the manipulation of the exam results ensures the re-election of the incumbent.
The paper has clear policy implications. First, governments should be aware of the politically-motivated manipulation of the exam success rate because this has an important effect on the quality of human capital. Such a political education cycle therefore helps to introduce into the labour market a mix of good and poor graduate students from the same cohort.
Second, the use of progression rates to next levels as indicators of the performance of educational systems in developing countries should be taken with a pinch of salt given the possibility of manipulation of exam success rates for political considerations. Other indicators such as knowledge test scores seem more appropriate for assessing the performance of the educational system.
References
Collier, P. and Vicente, P. (2011) Violence, bribery, and fraud: the political economy of elections in Sub-Saharan Africa. Public Choice forthcoming. DOI: 10.1007/s11127-011-9777-z
Brender, A. and Drazen, A. (2005) Political budget cycles in new versus established democracies. Journal of Monetary Economics 52, 1271 – 1295.
Fouda, S. M. (1997) Political Monetary Cycles and Independence of the Central Bank in a Monetary Union: an Empirical Test for a BEAC Franc Zone Member Country. Journal of African Economies, 6(1), 112 – 131.
Shi, M. and Svensson, J. (2006) Political budget cycles: Do they differ across countries and why? Journal of Public Economics, 90(8-9), 1367 – 1389.
17
Appendix
Table A1: Descriptive statistics
Variable Obs Mean Std. Dev. Min Max
Exam success rate 146 47.10 14.36 9.26 79.78
Election dummy 323 0.09 0.29 0 1
log GDP per capita 305 7.01 0.85 5.49 9.65
Pupil-teacher ratio 176 50.12 12.25 26.02 100.24
Inflation rate 250 1.35 15.30 -0.10 237.73
Rural population (%) 289 65.04 16.61 14.96 93.34 Public education spending (% GDP) 216 3.23 1.23 1.14 7.03
Education aid (% GDP) 305 0.83 0.89 0 5.51
Incumbent won the election 29 0.66 0.48 0 1
Vote fraud index 297 0.40 0.49 0 1
Electoral competition index 323 5.72 1.92 1 7
log total population 289 15.79 1.03 13.03 17.98
Table A2: List of countries (15) Benin
Burkina Faso Burundi Cameroon Central African Republic
Chad Congo, Dem. Rep.
Congo, Rep. Cote d'Ivoire Gabon Madagascar Mali Niger Senegal Togo