HAL Id: hal-01656172
https://hal.archives-ouvertes.fr/hal-01656172
Submitted on 21 Dec 2018
HAL is a multi-disciplinary open access
archive for the deposit and dissemination of
sci-entific research documents, whether they are
pub-lished or not. The documents may come from
teaching and research institutions in France or
abroad, or from public or private research centers.
L’archive ouverte pluridisciplinaire HAL, est
destinée au dépôt et à la diffusion de documents
scientifiques de niveau recherche, publiés ou non,
émanant des établissements d’enseignement et de
recherche français ou étrangers, des laboratoires
publics ou privés.
Distributed under a Creative Commons Attribution - NonCommercial| 4.0 International
License
ECG Pattern in Heart Failure Patients
Nicolas Derval, Josselin Duchateau, Saagar Mahida, Romain Eschalier,
Frédéric Sacher, Joost Lumens, Hubert Cochet, Arnaud Denis, Xavier Pillois,
Seigo Yamashita, et al.
To cite this version:
Nicolas Derval, Josselin Duchateau, Saagar Mahida, Romain Eschalier, Frédéric Sacher, et al..
Distinc-tive Left Ventricular Activations Associated With ECG Pattern in Heart Failure Patients. Circulation:
Arrhythmia and Electrophysiology, 2017, 10 (6), �10.1161/CIRCEP.117.005073�. �hal-01656172�
1
T
he deleterious impact of abnormal left ventricular (LV)activation in heart failure (HF) is well established.1 Cardiac
resynchronization therapy (CRT) represents a highly effec-tive intervention in selected patients with HF and abnormal LV activation. The QRS pattern emerged as a more specific selection criterion in the latest American Heart Association (AHA)/European Heart Rhythm Association guidelines. These recommendations are based on multiple subgroup analyses demonstrating a clear benefit to CRT depending on the
preim-plantation QRS pattern.2–4 Therefore, patients with baseline left
bundle branch block (LBBB) have a class I indication for CRT implantation and represent the best responders to CRT.
Patients with narrow QRS currently have a class III indication for CRT as a result of large trial, demonstrating that CRT has a neutral or deleterious effect in this group of
patients.5–8 In patients with nonspecific intraventricular
con-duction delay (NICD), the guidelines are less clear, with a class IIa or IIb indication depending on the QRS duration. These patients represent a more heterogeneous group that is not clearly characterized. Its definition wide QRS without the appearance of left or right bundle block corresponds to a definition by default. Results obtained after CRT include only small numbers of patients, with no dedicated randomized
studies.9–11 The electrophysiological mechanisms of lack of
response in narrow QRS and NICD are not well understood. The use of a more detailed electric activation map rather than QRS analysis could significantly enhance our understanding of the electric activation sequence in HF patients, especially in narrow QRS and NICD patients and, therefore, refine selection criteria for CRT.
© 2017 American Heart Association, Inc.
Circ Arrhythm Electrophysiol is available at http://circep.ahajournals.org DOI: 10.1161/CIRCEP.117.005073
Original Article
Background—In contrast to patients with left bundle branch block (LBBB), heart failure patients with narrow QRS and nonspecific intraventricular conduction delay (NICD) display a relatively limited response to cardiac resynchronization therapy. We sought to compare left ventricular (LV) activation patterns in heart failure patients with narrow QRS and NICD to patients with LBBB using high-density electroanatomic activation maps.
Methods and Results—Fifty-two heart failure patients (narrow QRS [n=18], LBBB [n=11], NICD [n=23]) underwent 3-dimensional electroanatomic mapping with a high density of mapping points (387±349 LV). Adjunctive scar imaging was available in 37 (71%) patients and was analyzed in relation to activation maps. LBBB patients typically demonstrated (1) a single LV breakthrough at the septum (38±15 ms post-QRS onset); (2) prolonged right-to-left transseptal activation with absence of direct LV Purkinje activity; (3) homogeneous propagation within the LV cavity; and (4) latest activation at the basal lateral LV. In comparison, both NICD and narrow QRS patients demonstrated (1) multiple LV breakthroughs along the posterior or anterior fascicles: narrow QRS versus LBBB, 5±2 versus 1±1; P=0.0004; NICD versus LBBB, 4±2 versus 1±1; P=0.001); (2) evidence of early/pre-QRS LV electrograms with Purkinje potentials; (3) rapid propagation in narrow QRS patients and more heterogeneous propagation in NICD patients; and (4) presence of limited areas of late activation associated with LV scar with high interindividual heterogeneity.
Conclusions—In contrast to LBBB patients, narrow QRS and NICD patients are characterized by distinct mechanisms of LV activation, which may predict poor response to cardiac resynchronization therapy. (Circ Arrhythm Electrophysiol.
2017;10:e005073. DOI: 10.1161/CIRCEP.117.005073.)
Key Words: cardiac resynchronization therapy ◼ heart failure ◼ left bundle branch block ◼ mapping ◼ resynchronization
Received January 23, 2017; accepted April 18, 2017.
From the Hôpital Cardiologique du Haut-Lévêque, CHU Bordeaux, LIRYC, L’Institut de rythmologie et modélisation cardiaque, Université de Bordeaux, France (N.D., J.D., F.S., J.L., H.C., A.D., X.P., S.Y., Y.K., S.P., S.A., A.Z., P.R., M. Hocini, M. Haissaguerre, P.J., P.B.); Liverpool Heart and Chest Hospital, Liverpool, United Kingdom (S.M.); CHU Clermont-Ferrand, Clermont-Ferrand, France (R.E.); and Maastricht University Medical Center, The Netherlands (J.L.).
Correspondence to Nicolas Derval, MD, Hopital cardiologique du Haut-Lévêque, CHU Bordeaux, Université Victor Segalen Bordeaux II, 1, Ave Magellan, 33600 Pessac, France. E-mail [email protected]
Distinctive Left Ventricular Activations Associated
With ECG Pattern in Heart Failure Patients
Nicolas Derval, MD; Josselin Duchateau, MD; Saagar Mahida, MD; Romain Eschalier, MD, PhD;
Frederic Sacher, MD, PhD; Joost Lumens PhD; Hubert Cochet, MD, PhD; Arnaud Denis, MD;
Xavier Pillois, PhD; Seigo Yamashita, MD; Yuki Komatsu, MD; Sylvain Ploux, MD, PhD;
Sana Amraoui, MD; Adlane Zemmoura, MD; Philippe Ritter, MD; Mélèze Hocini, MD;
Michel Haissaguerre, MD; Pierre Jaïs, MD; Pierre Bordachar, MD, PhD
In the present study, we sought to use invasive electroana-tomic mapping to (1) define specific characteristics of acti-vation sequence of patients with narrow QRS, LBBB, and NICD; (2) understand how the electrophysiological perturba-tions may explain the different response to CRT observed in the 3 subgroups; (3) analyze the link between electric activa-tion and anatomic substrate.
Methods
Patients
Consecutive HF patients fulfilling the following criteria were enrolled in the study: (1) cardiomyopathy of any pathogenesis with LV ejec-tion fracejec-tion of <35%; (2) LV endocardial map acquired during sinus rhythm with the use of an electroanatomic mapping system (CARTO XP and CARTO 3, Diamond Bar, CA); and (3) complete LV geom-etry with homogeneously distributed activation points. The protocol was approved by the CHU Bordeaux ethics committee (CARTO-CRT trial; clinicaltrials, NCT01270646), and all patients gave written con-sent. Patients referred for LV tachycardia (n=43) had ablation per-formed after completion of the mapping study.
HF patients were included regardless of the QRS duration. Based on the 12-lead EKG, patients were divided into 3 subgroups: (1) narrow QRS (QRS duration [QRSd] <120 ms); (2) complete LBBB (QRSd>120 ms); (3) NICD (QRSd>120 ms). LBBB and intraventric-ular conduction disturbances were defined according to the American Heart Association/American College of Cardiology Foundation/ Heart Rhythm Society criteria.12
Mapping Procedure
Endocardial contact electroanatomic mapping was performed during sinus rhythm. An irrigated catheter (3.5-mm-tip, NaviStar ThermoCool; Biosense Webster, Diamond Bar, CA) or a multipo-lar high-density mapping catheter (PentaRay; Biosense Webster) were used for mapping (n=6 and n=46, respectively). After cre-ation of 3-dimensional LV geometry, a detailed activcre-ation map was
conducted. Each point was reviewed manually to ensure the qual-ity of the activation map. The location of the LV septum, anterior wall, lateral wall, posterior wall, the mitral annulus, and the apex were defined on the CARTO anatomic mesh. The AHA segmenta-tion was then used to accurately localize each of the endocardial activation points.13
Quantitative and qualitative analysis of each map was performed systematically following each step of LV activation. The following parameters were analyzed:
• QRSd was measured manually from the beginning to the end of the QRS complex, with simultaneous 12-lead ECG signals acquired on the digital electrophysiology recording system (Labsystem pro; Boston Scientific, MA).
• Initiation of LV activation.
– Purkinje potentials were recorded and annotated.
– Early LV activation time was measured from the onset of the QRS complex to the earliest LV endocardial activation point. – LV endocardial breakthrough was measured as the number
of individual LV areas activated simultaneously during the first 10 ms of LV activation.
• LV cavity activation
– Areas of slow conduction were identified based on the iso-chronal map. Regions with crowded isochrones with an ac-tivation time difference at its opposite sides of >50 ms were defined as areas of slow conduction.
– LV total activation time was measured from the earliest to the latest LV endocardial activation point.
• Termination of LV activation
– After 120 ms, LV surface area was measured as the area of the LV activated 120 ms after the onset of the QRS complex.
– After 150 ms, LV surface area was measured as the area of the LV activated 150 ms after the onset of the QRS complex.
– Post QRS LV activation time was measured from the end of the latest QRS complex to the latest endocardial activation point.
Epicardial Mapping
In a subset of patients, an epicardial mapping was also performed during the procedure. The methodology of epicardial mapping was similar to that of endocardial mapping described earlier (with the ex-ception of Purkinje mapping data).
Surface Activation Slope Construction
Surface ECG, LV geometries, local activation times, and positions of corresponding data points obtained via the CARTO 3 electroanatomic mapping system were analyzed offline using a custom software cre-ated in MATLAB (The Mathworks, Inc., Natick, MA). Geometry was smoothed (pillars/trabeculae were excluded) using Poisson surface reconstruction to ensure that surface activation was more representa-tive of myocardial mass activation. Dense activation maps were cre-ated by interpolation from data points (mean 387±349 points). The onset of the QRS complex was determined manually from the 12-lead ECG and taken as time reference. Activated surface as a function of time was calculated with a temporal resolution of 1 ms and normal-ized to the total endocardial surface.
To quantify the LV activation spread, we analyzed the following parameters:
• T50 was determined as the time point for which 50% of the en-docardial surface was depolarized.
• T20-T80 was determined as the time difference between time points corresponding to 20% and 80% depolarization.
Scar Imaging
A proportion of patients underwent adjunctive preprocedural imaging of scar with real-time integration of noninvasive imaging data during the procedure. The adjunctive imaging modality was chosen based on the presence of an implantable device. Delayed enhancement
WHAT IS KNOWN
•
Abnormal left ventricular (LV) activation has adel-eterious impact on heart function in patients with cardiomyopathies. Compared with patients with left bundle branch block (LBBB), patients with a narrow QRS or a NICD have a poor response to resynchronization therapy. The underlying mecha-nisms are not fully understood.
WHAT THE STUDY ADDS
•
LV activation in patients with a narrow QRS,nonspecific intraventricular conduction delay, or LBBB are fundamentally different, with QRS-specific differences in activation characteristics.
•
Patients with LBBB have a unique pattern of LVacti-vation characterized by the absence of direct Purkinje activation; late, unifocal, septal activation; homoge-neous spread of LV activation; and late activation of the LV related to conduction system disease.
•
Patients with narrow QRS or nonspecificintraven-tricular conduction delay share several activation characteristics, including early, Purkinje-mediated, multifocal septal activation and heterogeneously distributed areas of slow conduction related to myocardial disease.
3 Derval et al Left Ventricular Activation in Heart Failure
magnetic resonance imaging was preferred in absence of an implant-able device, while a high-resolution computed tomography imaging was performed in patients with a device. The magnetic resonance imaging study was conducted on a 1.5 Tesla scanner (Magnetom Avanto; Siemens Medical Systems, Erlangen, Germany) equipped with a 32-channel cardiac coil. Late gadolinium enhancement im-aging was performed at high spatial resolution (1.25×1.25×2.5 mm) using a respiratory-navigated method initially dedicated to atrial fibrosis imaging. CT was performed on a 64-detector scan-ner (Somatom Definition; Siemens Medical Systems, Forchheim, Germany). Images were acquired during the arterial phase after io-dine contrast administration and reconstructed at mid-diastole. The complete methodology of our image acquisition and processing, as implemented in MUSIC Software (IHU LIRYC–Université de Bordeaux/Inria–Sophia Antipolis), has been described previously.14 Briefly, myocardial structural substrate was automatically mapped from CT as areas of wall thinning <5 mm or myocardial hypoattenu-ation <0 HU and from magnetic resonance imaging as areas of late gadolinium enhancement. Segmented images were used to compute patient-specific 3-dimensional meshes, which were imported into 3-dimensional mapping systems.
Statistical Analysis
Categorical variables were expressed as absolute numbers (percent-ages) and compared using the Fisher exact test. Continuous variables were expressed as mean±SD. Differences between the 3 groups were tested using the nonparametric Kruskal–Wallis test. If a difference was observed, pairwise nonparametric Mann–Whitney test with Bonferroni correction was performed. For paired continuous vari-ables, Wilcoxon signed-rank test was performed. Values of P<0.05 were considered significant.
Results
Patient Characteristics
A total of 52 consecutive patients were enrolled in the study (49 males, mean age 62±12 years, left ventricular ejection fraction=29±6%). Baseline characteristics are summarized in Table 1. Eleven patients (21%) had LBBB, 23 (44%) had NICD, and 18 (35%) had a narrow QRS complex. Epicardial mapping was conducted in 12 (23%) patients (5 narrow QRS and 7 NICD).
LV Activation Pattern
Results from LV activation pattern studies are summarized in Table 2 and Figure 1.
Narrow QRS
In this group, multiple endocardial LV breakthrough points were identified. The breakthrough points were clustered along the left posterior fascicle in 10/18 (56%) patients and the ante-rior fascicle (in absence of left anteante-rior hemibranch block) in 8/18 patients (44%). Purkinje potentials were recorded at the sites of LV breakthrough in 17 (94%) patients (Figure 2). LV breakthroughs were widely distributed on the LV septum and involved a mean of 2.7 AHA segments per patient, ensuring rapid, multifocal activation of the septum.
Areas of slow conduction were identified in 17 of 18 (94%) patients and were defined by an abrupt localized crowding of temporal isochronal lines. These areas of slow conduction were limited in size and distribution and did not have a signifi-cant impact on overall LV activation.
The end of the LV activation location was homogenous involving only 1 AHA segment per patient and was mainly
localized at the basal or midlateral part of the LV in 13 (72%) patients. In the remaining patients, LV activation ended at a more apical region because of scar-related slow conduction areas.
Nonspecific Intraventricular Conduction Delay
Multiple endocardial LV breakthroughs were identified in patients with NICD. Breakthrough points were distributed along the left posterior fascicle in 12/23 (52%) patients and along the anterior fascicle in 11/23 (48%) patients. Purkinje potentials were recorded at the sites of LV breakthrough in all NICD patients (Figure 2). LV breakthroughs were also widely distributed on the LV septum, as observed in patients with nar-row QRS (mean of 2.4 AHA segments).
After onset, the spread of LV activation was more het-erogeneous in NICD patients when compared with patients with narrow QRS (Figure 1). Areas of localized heteroge-neous activation were observed in 87% of NICD patients. Importantly, when scar imaging was available, the areas of heterogeneous activation were observed to colocalize with transmural scar (Figure 3). LV scar localized across activa-tion wavefront created pockets of slow conducactiva-tion that could be buried in the QRS duration or activated after the end of the QRS complex.
The end of LV activation occurred at the typical basal or mid lateral part of the LV in 15 of 23 (74%) patients. In the remaining patients, LV activation ended at a more apical region because of scar-related slow conduction areas.
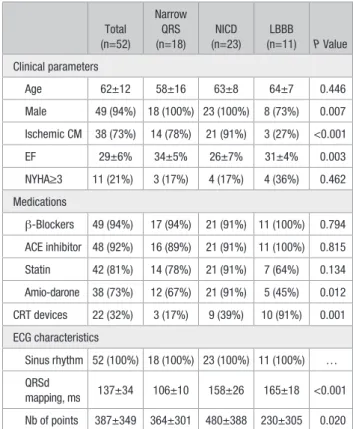
Table 1. Patients Characteristics
Total (n=52) Narrow QRS (n=18) NICD (n=23) LBBB (n=11) P Value Clinical parameters Age 62±12 58±16 63±8 64±7 0.446 Male 49 (94%) 18 (100%) 23 (100%) 8 (73%) 0.007 Ischemic CM 38 (73%) 14 (78%) 21 (91%) 3 (27%) <0.001 EF 29±6% 34±5% 26±7% 31±4% 0.003 NYHA≥3 11 (21%) 3 (17%) 4 (17%) 4 (36%) 0.462 Medications β-Blockers 49 (94%) 17 (94%) 21 (91%) 11 (100%) 0.794 ACE inhibitor 48 (92%) 16 (89%) 21 (91%) 11 (100%) 0.815 Statin 42 (81%) 14 (78%) 21 (91%) 7 (64%) 0.134 Amio-darone 38 (73%) 12 (67%) 21 (91%) 5 (45%) 0.012 CRT devices 22 (32%) 3 (17%) 9 (39%) 10 (91%) 0.001 ECG characteristics Sinus rhythm 52 (100%) 18 (100%) 23 (100%) 11 (100%) … QRSd mapping, ms 137±34 106±10 158±26 165±18 <0.001 Nb of points 387±349 364±301 480±388 230±305 0.020 CRT indicates cardiac resynchronization therapy; CM, cardiomyopathy; EF, left ventricular ejection fraction; LBBB, left bundle branch block; NICD, nonspecific intraventricular conduction delay; NYHA, New York Heart Association; and QRSd, QRS duration.
Left Bundle Branch Block
All LBBB patients demonstrated a single LV endocardial breakthrough, located at the mid (8 patients, 73%) or apical part (3 patients, 27%) of the LV septum. The beginning of the LV activation was consistently recorded after the onset of the QRS complex. Purkinje potentials were not identified at the sites of LV breakthrough. Endocardial activation was observed to spread centrifugally in a homogenous manner from the single breakthrough sites (Figure 1). The basal lateral aspect of the LV was the last region to be activated in every patient.
Areas of slow conduction were present in 5 patients (45%). These areas were limited in size and only had a mini-mal impact on overall LV wavefront propagation.
Epicardial Mapping
Twelve patients underwent epicardial mapping (11 ischemic cardiomyopathy and 1 nonischemic cardiomyopathy; five of the 12 (42%) patients had a narrow QRS, while 7 (58%) had
a NICD). The earliest epicardial activation was consistently later (+23±14 ms) than that observed endocardially (−5±8 ms versus 18±14 ms; P=0.002; narrow QRS, 24±13 ms; NICD, 25±17 ms; P=0.876), with fewer anteroseptal epicardial breakthroughs compared with endocardium (1.4±0.7 versus 3.2±1.5; P=0.007). The total LV activation time was not sig-nificantly different between the endocardium (134±42 ms) and the epicardium (137±37 ms; P=0.937).
Overall, epicardial LV propagation was fast, with areas of more heterogeneous propagation characterized by areas of crowded isochrones on activation maps. Most of these areas were transmural with a large overlap between endocardial and epicardial distribution (Figure 4). The latest sites of LV activation were consistent between the epicardial and endo-cardial maps in all patients. In 6 patients, we found limited epicardial areas activated after the end of endocardial acti-vation (mean, 17±22 ms; surface, 5±11 cm; 2 0.9±2.2% of total LV).
Table 2. Activation Characteristics
Narrow QRS NICD LBBB P Value P Value Narrow QRS vs NICD P Value Narrow QRS vs LBBB P Value NICD vs LBBB
QRSd 105±9 ms 149±26 ms 165±18 ms <0.001 <0.001 <0.001 0.214 eLVAT −6±12 ms −3±6 ms 38±15 ms <0.001 0.534 <0.001 <0.001 LV breakthrough 5±2 4±2 1±0 <0.001 0.558 <0.001 <0.001 LVTAT 106±34 ms 159±35 ms 117±28 <0.001 <0.001 0.550 0.006 pLVAT 6±35 ms 13±44 ms −2±23 ms 0.019 0.063 0.642 0.057 Post120 ms 0.8±3.4 cm2 18±25 cm2 45±42 cm2 <0.001 <0.001 <0.001 0.231 LV surface 0.3±1.5% 7±8% 17±13% <0.001 <0.001 <0.001 0.195 Post150 0.5±2.0 cm2 3±5 cm2 7±14 cm2 0.015 0.012 0.084 0.828 LV surface 0.2±0.8% 0.9±1.8% 2±5% 0.016 0.015 0.084 0.913 T50% 34±14 ms 55±15 ms 92±20 ms <0.001 <0.001 <0.001 <0.001 eLVAT indicates early LV activation time; LBBB, left bundle branch block; LV, left ventricle; LVTAT, LV total activation time; NICD, nonspecific intraventricular conduction delay; pLVAT, post QRS LV activation time; and QRSd, QRS duration.
Figure 1. Left ventricular activation map in patients with narrow QRS, nonspecific intraventricular conduction delay (NICD) and left bun-dle branch block (LBBB). T=0 represents the beginning of the ventricular activation recorded by the onset of the QRS on surface EKG. In patients with narrow QRS and NICD, most of the septum is fully activated within 40 ms, while in LBBB, LV activation start only after 40 to 60 ms. Three representative individuals were selected for the figure. The dashed line represents the limit of 120 ms and border between narrow and wide QRS complex. All measurements are in milliseconds (ms). AP indicates anteroposterior view.
5 Derval et al Left Ventricular Activation in Heart Failure
Subgroups Analysis
Ischemic Versus Nonischemic Patients
The results are summarized in Table 3. Briefly, 38 patients (73%) had ischemic cardiomyopathy; these patients were mainly narrow QRS and NICD patients. Despite similar QRSd, ischemic patients had a significantly longer LV total activation time (142±36 ms versus 106±41 ms) with earlier onset (early LV activation time, 1±16 ms versus 20±23 ms;
P=0.001) and later end of activation (post QRS LV activation
time, 13±39 versus −8±24 ms; P=0,001). QRS≥150 ms versus QRS<150 ms The results are summarized in Table 3. LV Activation Spread
The surface activation slopes demonstrated different activa-tion spread among the LBBB, NICD, and narrow QRS com-plex groups. Onset of LV activation was significantly earlier in the narrow QRS and NICD groups relative to the LBBB group (Table 2). The time taken to activate 50% of the LV surface
(T50) was shortest in the narrow QRS group (narrow QRS
ver-sus NICD; 34±14 ms verver-sus 55±15 ms; P<0.01; narrow QRS versus LBBB, 34±14 ms versus 92±20 ms; P<0.01; Table 2). LV activation spread was significantly faster in the narrow QRS patients as compared with NICD and LBBB patients (P<0.05
for both; Figure 5). However, the T20–T80 activation slope was
not significantly different between NICD and LBBB. The sur-face activation slopes of NICD patient were relatively fast and homogeneous during the first half of LV activation; however, activation was slower and more heterogeneous during the sec-ond half of LV activation. The slower activation spread was a consequence of multiple areas of scar and slow conduction. In contrast, narrow QRS and LBBB patients differed mainly in terms of onset of activation.
Scar Imaging
Among the 38 ischemic patients, prior myocardial infarc-tion was anterior (22, 58%), inferior (7, 18%), Infero-lat-eral (6, 16%), latInfero-lat-eral (2, 5%), and inferior+anterior (1, 3%). Scar imaging was available in 37 (71%, 30 ischemic [79%]) patients and identified localized areas of LV scar in 30 (81%) patients. More extensive areas of scarring were observed in the narrow QRS and NICD cohort (mean of 6 AHA segments with scar in both groups) as compared with the LBBB cohort (mean of 3 AHA segments; P<0.05). In all cases, we observed that the location of LV scar was closely associated with areas of crowded isochrones (Figure 3). In most cases, the scar was perpendicular to the direction of the activation wavefront and was responsible for activation slowing. However, areas of LV scar could also be observed without significant conduction Figure 2. Examples of patients with narrow QRS, nonspecific intraventricular conduction delay (NICD), and left bundle branch block (LBBB). For each patient, the surface EKG (only 5 leads) is presented at 25 mm/s speed (top). Lower, Endocardial EGMs recorded and the left ventricular (LV) activation map. The site of EGMs recording is annotated, on the map, by a corresponding number. For patients with narrow QRS and NICD, the activation starts from multiple breakthroughs, each of these breakthroughs is associated with a sharp Purkinje potential. In patients with LBBB, activation starts later, from a single breakthrough with no Purkinje potential. LV activation maps were merged with the high-resolution computed tomography (CT) scan allowing for anatomic landmark identification. LV scar (<5 mm wall thinning on CT scan) is represented by the gray areas. EGMs are recorded at 100 mm/s speed. Ao indicates aorta; AP, anteroposterior view; CS, coronary sinus; EGM, electrogram; LA, left atrium; RIPV, right inferior pulmonary vein; and RSPV, right superior pulmonary vein.
slowing, especially when the scar was parallel to the activation direction (11 patients [39%]).
Discussion
The present study demonstrates that (1) LV activation in patients with narrow QRS, NICD, and LBBB are fundamen-tally different, with QRS-specific differences in activation characteristics. (2) Heart failure patients with narrow QRS and NICD share several activation characteristics, including early, Purkinje-mediated, multifocal septal activation and heteroge-neously distributed areas of slow conduction. Narrow QRS and NICD patients seem to have conduction abnormalities predominantly related to myocardial disease. (3) Patients with LBBB have a unique pattern of LV activation characterized by the absence of direct Purkinje activation, late, unifocal, sep-tal activation, homogeneous spread of LV activation and late activation of the LV. In contrast to narrow QRS and NICD patients, LBBB patients seem to have conduction abnormali-ties predominantly related to conduction system disease. Characteristics of LBBB Activation
In our cohort of LBBB patients, we observed a unique LV acti-vation pattern, which differed markedly from that observed in patients with NICD and narrow QRS. Specifically, LBBB patients displayed a late onset of LV activation, initiated entirely from a single breakthrough located in the midseptal area, which
were not preceded by Purkinje potentials. Therefore, activation of the entire LV was dependent on myocardial conduction prop-erties, resulting in a relatively simple activation pattern. In addi-tion, LV activation spread was homogenous, without significant areas of slow conduction, and activation consistently ended at the basal lateral LV. In contrast with previous studies, we could not find area of conduction block that would impact the spread
of the activation wavefront.15,16
Multiple previous studies have performed detailed charac-terization of LV activation in patients with LBBB. Several char-acteristics of LBBB activation identified in the present study, including LV activation resulting from right-to-left transseptal activation and prolonged transseptal activation time, have also
been described in these studies.17–20 In contrast to our
find-ings, however, these studies reported that typical LBBB on the surface ECG is a poor predictor of LV activation identified during invasive mapping. Furthermore, while we consistently identified homogenous LV activation in our LBBB cohort, previous studies have reported complex and heterogeneous
activation patterns in the context of LBBB.15,17,21 The reasons
for these apparently discordant findings are presently unclear. It is important to note, however, that while several previous studies have used noncontact technology to characterize LV activation, we performed contact mapping with a high density of endocardial points. It could be speculated that the inherent limitations of noncontact technology may have contributed to the inconsistent results.
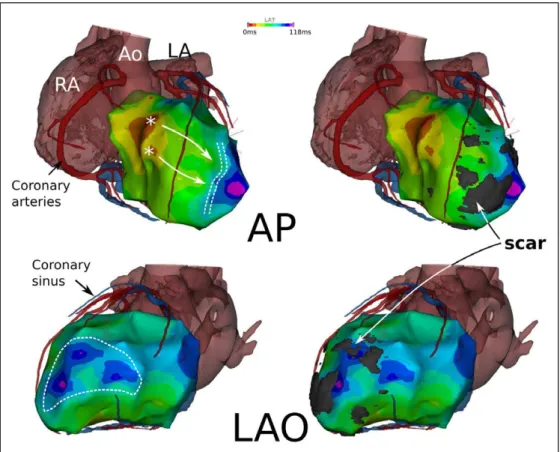
Figure 3. Relationship between left ventricular (LV) scar and activation map in a patient with narrow QRS. LV activation maps are merged with high-resolution computed tomography (CT) scan. The dashed line represents a line of slow conduction with >50 ms delay between both sides of the line (light green area to purple). Left, The same geometry is presented with the addition of 5 mm wall thinning data (LV scar). Note that the scar is located across the propagation wavefront and create a pocket of apical late activated LV tissue. Ao indicates aorta; AP, anteroposterior view; LA, left atrium; LAO, left anterior oblique view; and RA, right atrium.
7 Derval et al Left Ventricular Activation in Heart Failure
Activation Characteristics in Narrow QRS and NICD
Interestingly, we observed a continuum of activation charac-teristics between narrow QRS and NICD patients where the onset of LV activation was early and mediated by Purkinje fibers. As a result, in both patient groups, LV activation had a rapid and multifocal onset. The LV septum and the ventricular
tissue immediately adjacent to the multiple LV breakthroughs were activated significantly earlier than that observed in LBBB patients. Furthermore, most of the myocardium was activated in <120 ms in both the narrow QRS and NICD cohorts. Among NICD patients, only 7±8% of LV surface was activated after 120 ms. The late components of the ventricular activation were largely attributable to slow conduction in areas of LV scar.
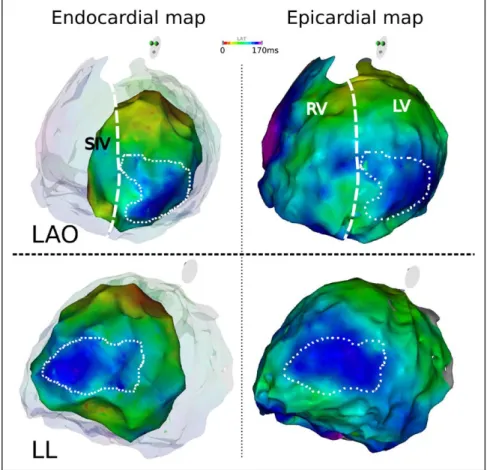
Figure 4. Endocardial and epicardial acti-vation map in nonspecific intraventricular conduction delay (NICD) patient. Example of correspondence between endocardial and epicardial map in a NICD patient with nonischemic cardiomyopathy. The patient had an apico-lateral area of delayed activation (dashed line) that is present on both maps with similar timing of activa-tion. LAO indicates left anterior oblique view; LL, left lateral view; LV: left ven-tricle; RV, right venven-tricle; and SIV, septum interventricular.
Table 3: Subgroups Analysis
Ischemic (n=38) Nonischemic (n=14) P Value QRS<150 ms (n=31) QRS≥150 ms (n=21) P Value Groupes narrowQRS 14 (37%) 4 (29%) 18 (58%) 0 (0%) NICD 21 (55%) 2 (14%) 10 (32%) 13 (62%) LBBB 3 (8%) 8 (57%) 3 (10%) 8 (38%) QRSd 137±32 ms 139±30 ms 0.374 121±19 ms 174±19 ms <0.001 eLVAT −1±16 ms 20±23 ms 0.001 −4±16 ms 15±24 ms 0.003 LV breakthrough 4±2 3±2 0.020 5±2 ms 3±2 0.108 LVTAT 142±36 ms 106±41 ms 0.003 121±34 ms 146±38 ms 0.032 pLVAT 13±39 ms −8±24 ms 0.001 9±30 ms 28±43 ms 0.164 Post-120 ms 18±33 cm2 18±21 cm2 0.383 3±6 cm2 40±37 cm2 <0.001 LV surface 6±10% 7±9% 0.372 1±2% 14±11% <0.001 Post-150 3±8 cm2 1±3 cm2 0.846 0.4±2 cm2 6±11 cm2 <0.001 LV surface 1±3% 0.4±1% 0.790 0.2±0,8% 2±4% <0.001 eLVAT indicates early LV activation time; LBBB, left bundle branch block; LV, left ventricle; LVTAT, LV total activation time; NICD, nonspecific intraventricular conduction delay; pLVAT, post QRS LV activation time; and QRSd, QRS duration.
Importantly, epicardial mapping demonstrated a high degree of consistency with endocardial mapping. In the majority of narrow QRS and NICD patients, terminal activa-tion sites were concordant between the endocardium and the epicardium. In the subset of patients where differences in acti-vation were observed, only small areas of discordant activa-tion were observed (5±11 cm, 20.9±2.2%).
Activation Spread
The analysis of the slope of the surface activation spread in LBBB patients was not significantly different from that
observed in narrow QRS patients, especially when comparing the subset of LBBB patients with no LV scar. In these patients, we demonstrated that once a critical mass of LV tissue is acti-vated, the spread of activation is comparable, regardless of the onset of activation. Only the presence of LV scar and inhomo-geneous myocardial conduction properties would be predicted to interfere with and eventually delay the spread of activation. Most of the observed differences between NICD and narrow QRS activation relate to the amount of delayed activation because of localized slow conduction in areas of scar. Impor-tantly, based on our findings, NICD is a manifestation of Figure 5. Surface activation slopes of patients with narrow QRS, nonspecific intraventricular conduction delay (NICD), and left bundle branch block (LBBB). Top, Surface activation of the left ventricle of all patients (narrow QRS in green, NICD in blue, and LBBB in red). Endocardial surface activation is represented in percentage of the total LV surface. Low left, Box plot presenting the mean T50 in each group of patients. T50 was determined as the time point for which 50% of the endocardial surface was depolarized. ** for P value<0.005. Low right, Bow plot presenting the mean value of the activation slope in each group of patients. T80-T20 was determined as the time dif-ference between time points corresponding to 80% and 20% depolarization. * for P value<0.05.
9 Derval et al Left Ventricular Activation in Heart Failure alterations at the end of LV activation but is otherwise closely
related to narrow QRS. Implications for CRT
Multiple subgroups analyses of large CRT trials have clearly demonstrated that a typical LBBB pattern is associated with a
greater benefit from CRT.3,4,7,10 Our results provide strong
evi-dence in support of these clinical observations because they demonstrate that LBBB in HF patients arises as a consequence of an absence of activation through the Purkinje system. As a consequence, the LV is passively activated from a single break-through, and the most delayed activation occurs at the most remote locations. Therefore, preexcitation of these remote areas without changing the mode of propagation (ie, myocardial) would be sufficient to result in true resynchronization of the LV.
In patients with NICD or narrow QRS, the baseline elec-tric abnormality is fundamentally different. The LV is activated through the Purkinje network with fast, multifocal activation of the septum, but this is followed by a heterogeneous and slow activation in scarred regions of the LV. In narrow QRS, areas of delayed activation are limited in size and number. The result of preactivating these areas by LV pacing seems to be far less
predictable, which fits with clinical trial data.5,6,8 Altogether,
the value of activation data to select/guide CRT in this group is likely to be limited. NICD patients represent more of a dilemma. In these patients, despite a wide QRS, LV activation is mediated by the Purkinje network, and areas of slow con-duction may or may not be associated with scar. In a previous study combining activation mapping, scar imaging, and
hemo-dynamic measurement during CRT, Ginks et al22 demonstrated
that the hemodynamic benefit of pacing these localized late activated areas with scar was limited. The present study also identified areas of late activation that were not directly associ-ated with scar, but seems to be the result of upstream slowing of the activation wavefront by a scar (Figure 4). Preactivation of such areas may offer an optimal location for pacing and may explain some successful outcomes previously reported in patients with NICD. This strategy has not been yet investigated but could be of major importance.
The limitations of using invasive mapping to guide patient selection for CRT are obvious. The use of body-surface nonin-vasive mapping has recently demonstrated promising results.
Consistent with our findings, Ploux et al19,23 reported a specific
and uniform LV activation pattern in LBBB patients. In NICD patients, on the other hand, they were able to identify localized areas of slow conduction. Future studies combining noninvasive activation data and scar imaging would likely help to improve patient selection and lead positioning in NICD patients.
Noteworthy, the present study was only focused on refin-ing the description of the underlyrefin-ing electric substrate of CRT candidates. Concomitant evaluation of the electromechani-cal coupling would be interesting because previous reports have suggested that despite similar electric substrate, clinical response to CRT was also modulated by the
electromechani-cal coupling.24,25
Study Limitations
This study is subject to several limitations. First, our popu-lation of patients with LBBB had a relatively low LV scar
burden (4 patients either without scar or a relatively limited extent of scar [mean of 3 AHA segments]) and, therefore, may not be fully representative of the population of HF with LBBB who are candidates for CRT. Of note, however,
con-sistent with the observations in our cohort, Strauss et al26
recently reported that HF with true LBBB had significantly less LV scar compared with groups of patients with narrow, NICD, or right bundle branch block. In most patients, we used LV wall thinning measurement by high-resolution CT imaging as a surrogate of LV scar because cardiac magnetic resonance imaging was not possible owing to prior device implantation. A previous study from our group has demon-strated that <5 mm wall thinning could be used as a surrogate of delayed enhancement cardiac magnetic resonance scar
imaging.27 However, some scars are not associated with wall
thinning and could have been missed in the present study. Patients from the LBBB groups have significantly less map-ping points acquired. Most patients included in that group (6 of 8 patients) had the protocol without concomitant VT ablation. Therefore, all mapping points were acquired only to define LV activation and were homogeneously distributed, while in patients with concomitant VT ablation, a proportion of these points were more clustered and also acquired to bet-ter define the VT substrate.
Finally, the study population was relatively small, and the results require further validation. Nevertheless, the results obtained in the 3 groups are consistent.
Conclusion
A high degree of homogeneity is present in the electric activation of patients with LBBB, which would favor a positive predict-able response to CRT. In contrast, patients with narrow QRS and NICD demonstrated more heterogeneity and variability prob-ably accounting for poorer response to CRT. This could possibly be improved by using individualized mapping and therapy.
Source of Funding
This work was supported by the French Government: l’Agence National de la Recherche au titre du programme Investissements d’Avenir (ANR-10-IAHU-04) and received a hospital grant: Appel d’Offre Interne, CHU Bordeaux.
Disclosures
Drs Nicolas Derval, Frederic Sacher, and Pierre Jaïs received mod-est speaking honorarium from Biosense Webster. Drs Meleze Hocini, Michel Haissaguerre, and Pierre Jaïs own stock in CardioInsight Technologies Inc. The other authors report no conflicts.
References
1. Prinzen FW, Vernooy K, Auricchio A. Cardiac resynchronization therapy: state-of-the-art of current applications, guidelines, ongoing trials, and areas of controversy. Circulation. 2013;128:2407–2418. doi: 10.1161/ CIRCULATIONAHA.112.000112.
2. Moss AJ, Hall WJ, Cannom DS, Klein H, Brown MW, Daubert JP, Estes NA 3rd, Foster E, Greenberg H, Higgins SL, Pfeffer MA, Solomon SD, Wilber D, Zareba W; MADIT-CRT Trial Investigators. Cardiac-resynchronization therapy for the prevention of heart-failure events.
N Engl J Med. 2009;361:1329–1338. doi: 10.1056/NEJMoa0906431. 3. Gold MR, Thébault C, Linde C, Abraham WT, Gerritse B, Ghio S, St John
Sutton M, Daubert JC. Effect of QRS duration and morphology on cardiac resynchronization therapy outcomes in mild heart failure: results from the Resynchronization Reverses Remodeling in Systolic Left Ventricular
Dysfunction (REVERSE) study. Circulation. 2012;126:822–829. doi: 10.1161/CIRCULATIONAHA.112.097709.
4. Sipahi I, Chou JC, Hyden M, Rowland DY, Simon DI, Fang JC. Effect of QRS morphology on clinical event reduction with cardiac resynchroniza-tion therapy: meta-analysis of randomized controlled trials. Am Heart J. 2012;163:260–267.e3. doi: 10.1016/j.ahj.2011.11.014.
5. Thibault B, Harel F, Ducharme A, White M, Ellenbogen KA, Frasure-Smith N, Roy D, Philippon F, Dorian P, Talajic M, Dubuc M, Guerra PG, Macle L, Rivard L, Andrade J, Khairy P; LESSER-EARTH Investigators. Cardiac resynchronization therapy in patients with heart failure and a QRS complex <120 milliseconds: the Evaluation of Resynchronization Therapy for Heart Failure (LESSER-EARTH) trial. Circulation. 2013;127:873– 881. doi: 10.1161/CIRCULATIONAHA.112.001239.
6. Ruschitzka F, Abraham WT, Singh JP, Bax JJ, Borer JS, Brugada J, Dickstein K, Ford I, Gorcsan J 3rd, Gras D, Krum H, Sogaard P, Holzmeister J; EchoCRT Study Group. Cardiac-resynchronization therapy in heart failure with a narrow QRS complex. N Engl J Med. 2013;369:1395–1405. doi: 10.1056/NEJMoa1306687.
7. Brignole M, Auricchio A, Baron-Esquivias G, Bordachar P, Boriani G, Breithardt OA, Cleland J, Deharo JC, Delgado V, Elliott PM, Gorenek B, Israel CW, Leclercq C, Linde C, Mont L, Padeletti L, Sutton R, Vardas PE, Zamorano JL, Achenbach S, Baumgartner H, Bax JJ, Bueno H, Dean V, Deaton C, Erol C, Fagard R, Ferrari R, Hasdai D, Hoes AW, Kirchhof P, Knuuti J, Kolh P, Lancellotti P, Linhart A, Nihoyannopoulos P, Piepoli MF, Ponikowski P, Sirnes PA, Tamargo JL, Tendera M, Torbicki A, Wijns W, Windecker S, Kirchhof P, Blomstrom-Lundqvist C, Badano LP, Aliyev F, Bänsch D, Baumgartner H, Bsata W, Buser P, Charron P, Daubert JC, Dobreanu D, Faerestrand S, Hasdai D, Hoes AW, Le Heuzey JY, Mavrakis H, McDonagh T, Merino JL, Nawar MM, Nielsen JC, Pieske B, Poposka L, Ruschitzka F, Tendera M, Van Gelder IC, Wilson CM; ESC Committee for Practice Guidelines (CPG); Document Reviewers. 2013 ESC Guidelines on cardiac pacing and cardiac resynchronization therapy: the Task Force on cardiac pacing and resynchronization therapy of the European Society of Cardiology (ESC). Developed in collaboration with the European Heart Rhythm Association (EHRA). Eur Heart J. 2013;34:2281–2329. doi: 10.1093/eurheartj/eht150.
8. Beshai JF, Grimm RA, Nagueh SF, Baker JH 2nd, Beau SL, Greenberg SM, Pires LA, Tchou PJ; RethinQ Study Investigators. Cardiac-resynchronization therapy in heart failure with narrow QRS complexes. N
Engl J Med. 2007;357:2461–2471. doi: 10.1056/NEJMoa0706695. 9. Birnie DH, Ha A, Higginson L, Sidhu K, Green M, Philippon F, Thibault
B, Wells G, Tang A. Impact of QRS morphology and duration on outcomes after cardiac resynchronization therapy: Results from the Resynchronization-Defibrillation for Ambulatory Heart Failure Trial (RAFT). Circ Heart Fail. 2013;6:1190–1198. doi: 10.1161/CIRCHEARTFAILURE.113.000380. 10. Zareba W, Klein H, Cygankiewicz I, Hall WJ, McNitt S, Brown M,
Cannom D, Daubert JP, Eldar M, Gold MR, Goldberger JJ, Goldenberg I, Lichstein E, Pitschner H, Rashtian M, Solomon S, Viskin S, Wang P, Moss AJ; MADIT-CRT Investigators. Effectiveness of Cardiac Resynchronization Therapy by QRS Morphology in the Multicenter Automatic Defibrillator Implantation Trial-Cardiac Resynchronization Therapy (MADIT-CRT). Circulation. 2011;123:1061–1072. doi: 10.1161/ CIRCULATIONAHA.110.960898.
11. Eschalier R, Ploux S, Ritter P, Haïssaguerre M, Ellenbogen KA, Bordachar P. Nonspecific intraventricular conduction delay: Definitions, prognosis, and implications for cardiac resynchronization therapy. Heart Rhythm. 2015;12:1071–1079. doi: 10.1016/j.hrthm.2015.01.023.
12. Surawicz B, Childers R, Deal BJ, Gettes LS, Bailey JJ, Gorgels A, Hancock EW, Josephson M, Kligfield P, Kors JA, Macfarlane P, Mason JW, Mirvis DM, Okin P, Pahlm O, Rautaharju PM, van Herpen G, Wagner GS, Wellens H; American Heart Association Electrocardiography and Arrhythmias Committee, Council on Clinical Cardiology; American College of Cardiology Foundation; Heart Rhythm Society. AHA/ ACCF/HRS recommendations for the standardization and interpreta-tion of the electrocardiogram: part III: intraventricular conducinterpreta-tion dis-turbances: a scientific statement from the American Heart Association Electrocardiography and Arrhythmias Committee, Council on Clinical Cardiology; the American College of Cardiology Foundation; and the Heart Rhythm Society. Endorsed by the International Society for Computerized Electrocardiology. J Am Coll Cardiol. 2009;53:976–981. doi: 10.1016/j.jacc.2008.12.013.
13. Cerqueira MD, Weissman NJ, Dilsizian V, Jacobs AK, Kaul S, Laskey WK, Pennell DJ, Rumberger JA, Ryan T, Verani MS; American Heart
Association Writing Group on Myocardial Segmentation and Registration for Cardiac Imaging. Standardized myocardial segmentation and nomen-clature for tomographic imaging of the heart. A statement for health-care professionals from the Cardiac Imaging Committee of the Council on Clinical Cardiology of the American Heart Association. Circulation. 2002;105:539–542.
14. Cochet H, Komatsu Y, Sacher F, Jadidi AS, Scherr D, Riffaud M, Derval N, Shah A, Roten L, Pascale P, Relan J, Sermesant M, Ayache N, Montaudon M, Laurent F, Hocini M, Haïssaguerre M, Jaïs P. Integration of merged delayed-enhanced magnetic resonance imaging and multidetector com-puted tomography for the guidance of ventricular tachycardia ablation: a pilot study. J Cardiovasc Electrophysiol. 2013;24:419–426. doi: 10.1111/ jce.12052.
15. Jia P, Ramanathan C, Ghanem RN, Ryu K, Varma N, Rudy Y. Electrocardiographic imaging of cardiac resynchronization therapy in heart failure: observation of variable electrophysiologic responses. Heart
Rhythm. 2006;3:296–310. doi: 10.1016/j.hrthm.2005.11.025.
16. Auricchio A, Abraham WT. Cardiac resynchronization therapy: current state of the art: cost versus benefit. Circulation. 2004;109:300–307. doi: 10.1161/01.CIR.0000115583.20268.E1.
17. Auricchio A, Fantoni C, Regoli F, Carbucicchio C, Goette A, Geller C, Kloss M, Klein H. Characterization of left ventricular activation in pa-tients with heart failure and left bundle-branch block. Circulation. 2004;109:1133–1139. doi: 10.1161/01.CIR.0000118502.91105.F6. 18. Vassallo JA, Cassidy DM, Marchlinski FE, Buxton AE, Waxman HL,
Doherty JU, Josephson ME. Endocardial activation of left bundle branch block. Circulation. 1984;69:914–923.
19. Ploux S, Lumens J, Whinnett Z, Montaudon M, Strom M, Ramanathan C, Derval N, Zemmoura A, Denis A, De Guillebon M, Shah A, Hocini M, Jaïs P, Ritter P, Haïssaguerre M, Wilkoff BL, Bordachar P. Noninvasive electrocardiographic mapping to improve patient selection for car-diac resynchronization therapy: beyond QRS duration and left bundle branch block morphology. J Am Coll Cardiol. 2013;61:2435–2443. doi: 10.1016/j.jacc.2013.01.093.
20. Lambiase PD, Rinaldi A, Hauck J, Mobb M, Elliott D, Mohammad S, Gill JS, Bucknall CA. Non-contact left ventricular endocardial mapping in cardiac resynchronisation therapy. Heart. 2004;90:44–51.
21. Fung JW, Yu CM, Yip G, Zhang Y, Chan H, Kum CC, Sanderson JE. Variable left ventricular activation pattern in patients with heart failure and left bundle branch block. Heart. 2004;90:17–19.
22. Ginks MR, Lambiase PD, Duckett SG, Bostock J, Chinchapatnam P, Rhode K, McPhail MJ, Simon M, Bucknall C, Carr-White G, Razavi R, Rinaldi CA. A simultaneous X-Ray/MRI and noncontact mapping study of the acute hemodynamic effect of left ventricular endocardial and epi-cardial cardiac resynchronization therapy in humans. Circ Heart Fail. 2011;4:170–179. doi: 10.1161/CIRCHEARTFAILURE.110.958124. 23. Ploux S, Eschalier R, Whinnett ZI, Lumens J, Derval N, Sacher F, Hocini
M, Jaïs P, Dubois R, Ritter P, Haïssaguerre M, Wilkoff BL, Francis DP, Bordachar P. Electrical dyssynchrony induced by biventricular pacing: im-plications for patient selection and therapy improvement. Heart Rhythm. 2015;12:782–791. doi: 10.1016/j.hrthm.2014.12.031.
24. Kroon W, Lumens J, Potse M, Suerder D, Klersy C, Regoli F, Murzilli R, Moccetti T, Delhaas T, Krause R, Prinzen FW, Auricchio A. In vivo electro-mechanical assessment of heart failure patients with prolonged QRS dura-tion. Heart Rhythm. 2015;12:1259–1267. doi: 10.1016/j.hrthm.2015.03.006. 25. Lumens J, Tayal B, Walmsley J, Delgado-Montero A, Huntjens PR,
Schwartzman D, Althouse AD, Delhaas T, Prinzen FW, Gorcsan J 3rd. Differentiating electromechanical from non-electrical substrates of me-chanical discoordination to identify responders to cardiac resynchroniza-tion therapy. Circ Cardiovasc Imaging. 2015;8:e003744. doi: 10.1161/ CIRCIMAGING.115.003744.
26. Strauss DG, Loring Z, Selvester RH, Gerstenblith G, Tomaselli G, Weiss RG, Wagner GS, Wu KC. Right, but not left, bundle branch block is asso-ciated with large anteroseptal scar. J Am Coll Cardiol. 2013;62:959–967. doi: 10.1016/j.jacc.2013.04.060.
27. Komatsu Y, Cochet H, Jadidi A, Sacher F, Shah A, Derval N, Scherr D, Pascale P, Roten L, Denis A, Ramoul K, Miyazaki S, Daly M, Riffaud M, Sermesant M, Relan J, Ayache N, Kim S, Montaudon M, Laurent F, Hocini M, Haïssaguerre M, Jaïs P. Regional myocardial wall thinning at multidetector computed tomography correlates to arrhythmogenic sub-strate in postinfarction ventricular tachycardia: assessment of structural and electrical substrate. Circ Arrhythm Electrophysiol. 2013;6:342–350. doi: 10.1161/CIRCEP.112.000191.