Publisher’s version / Version de l'éditeur:
Vous avez des questions? Nous pouvons vous aider. Pour communiquer directement avec un auteur, consultez la première page de la revue dans laquelle son article a été publié afin de trouver ses coordonnées. Si vous n’arrivez pas à les repérer, communiquez avec nous à [email protected].
Questions? Contact the NRC Publications Archive team at
[email protected]. If you wish to email the authors directly, please see the first page of the publication for their contact information.
https://publications-cnrc.canada.ca/fra/droits
L’accès à ce site Web et l’utilisation de son contenu sont assujettis aux conditions présentées dans le site LISEZ CES CONDITIONS ATTENTIVEMENT AVANT D’UTILISER CE SITE WEB.
Recent Development of Offshore Engineering in Cold Regions, 2, pp. 673-682, 2007
READ THESE TERMS AND CONDITIONS CAREFULLY BEFORE USING THIS WEBSITE. https://nrc-publications.canada.ca/eng/copyright
NRC Publications Archive Record / Notice des Archives des publications du CNRC :
https://nrc-publications.canada.ca/eng/view/object/?id=238ed20b-f273-47ad-885a-49b9f9e94a43 https://publications-cnrc.canada.ca/fra/voir/objet/?id=238ed20b-f273-47ad-885a-49b9f9e94a43
NRC Publications Archive
Archives des publications du CNRC
This publication could be one of several versions: author’s original, accepted manuscript or the publisher’s version. / La version de cette publication peut être l’une des suivantes : la version prépublication de l’auteur, la version acceptée du manuscrit ou la version de l’éditeur.
Access and use of this website and the material on it are subject to the Terms and Conditions set forth at
Flow of Ice through Long Converging Channels
673
Recent Development of Offshore Engineering in Cold Regions, Yue (ed.) POAC-07, Dalian, China, June 27-30, 2007.
@ 2007 Dalian University of Technology Press, Dalian, ISBN 978-7-5611-3631-7
FLOW OF ICE THROUGH LONG CONVERGING CHANNELS
Ivana Kubat1, Mohamed Sayed1, Stuart B. Savage2 and Tom Carrieres3
(1.Canadian Hydraulics Centre, NRC, Ottawa, ON, Canada; 2.McGill University, Montreal, Quebec, Canada;
3.Canadian Ice Service, Environment Canada, Ottawa, ON, Canada)
ABSTRACT
This paper examines some issues of the flow of ice in long and converging channels which may affect navigation. The emphasis is on pressure distributions and the role of ice properties and tidal currents. The present work employs an ice dynamics model that is based on a viscous plastic constitutive model with an elliptical yield envelope, the thickness redistribution model of Savage (2007), and a Particle-In-Cell (PIC) advection approach. Pressure distributions are obtained for an idealized geometry and uniform wind forcing. The results indicate that zones of relatively low pressures develop along the centre of the channel. Increasing the shear strength of the ice cover leads to somewhat lower pressures within such zones along the centre of the channel. That reduction of pressure is caused by the increased transfer of wind forces to land boundaries. Tides are shown to generally decrease pressures. The tidal currents also increase the overall drift, although drift slows and even reverses direction during parts of the tidal cycle.
INTRODUCTION
Ice flow through long and converging channels gives rise to several deformation processes that may impact potential navigation through the Canadian Archipelago. In particular, small-scale pressures, ridging, lead opening, and arch formation can directly influence safety and efficiency of navigation. Similarities between ice and granular flows have long been recognized. Sodhi (1977) used such an analogy to analyze deformation patterns and arching across the Bering Strait and Amundsen Gulf. In another study of converging channels, Pritchard et al, (1979) examined ice arching in the Bering Strait using a number of rigid-plastic yield conditions. Hibler
674
and Hutchings (2002) also addressed the ice flow through narrow passages. They used a dynamic thermodynamic model to predict equilibrium values of ice thickness over long durations (multidecades).
A recent class of investigations examined ice transport through the channels of the Archipelago. For example, Kwok (2005) used RADARSAT imagery to estimate ice movements and flux through Nares Strait. Samelson et al, (2005) also investigated ice flow through Nares Strait, and developed correlations between the atmospheric pressure and ice flux. Moreover, they noted that the coincidence of low tide with low wind stress and high freezing rates can create land fast ice across the Strait.
The present paper examines ice flow in long converging channels, with focus on pressure distributions. In addition to uniform wind forcing, tidal effects are also considered. Thermodynamic growth and melt are not included in the present study, which is aimed at examining the ice flow behaviour for short durations of a few days. Naturally, temperature can change ice strength, which may be a critical factor in many situations. In spite of their importance, there is no reliable information to quantify such temperature effects.
MODEL
The governing equations account for the balance of mass and momentum, stress-strain rate relations, and thickness redistribution. The momentum equations include the forces due to wind and water drag, Coriolis force, and water surface tilt. The expressions for these forces and the momentum and continuity equations are familiar and will not be listed here. For the stress-strain rate relation, the viscous plastic approach and elliptical yield envelope of Hibler are used.
Advection is introduced through a Particle-In-Cell (PIC) method, which employs an ensemble of particles to represent the ice cover. Each particle carries the properties and variables associated with the ice including: position, velocities, thickness of level and ridged ice, as well as concentration of level and ridged ice. In the present PIC implementation, the momentum and continuity equations are solved over an Eulerian grid. A staggered B-grid is used, with scalar variables defined over the cells and velocities at the nodes. The semi-implicit solution of Zhang-Hibler (1997) is used to solve the momentum equations. At each time step, the resulting velocities are mapped to the particles using a bi-linear interpolation function. The particles are then advected to their new positions. Next, the concentration and thickness values are mapped from the particles to the grid. Sayed et al, (2002) provide details of the model formulation, implementation, and testing.
The thickness redistribution model of Savage (2007) is used. That model considers the ice cover to consist of level and ridged (or deformed) parts. Starting from the
675
continuity and energy balance equations, Savage (2007) derived equations that determine the evolution of the thickness and concentration of both level and ridged ice. Those equations take into account the effects of both convergence and shear deformation on the evolution of thickness and concentration. In the present implementation, each particle carries values of a thickness and a concentration for both level and ridged ice. The strain rates are mapped from the grid to the particles, and in turn are used to update the thickness distribution. Kubat et al (2006) gave details of the implementation and testing of this thickness redistribution model.
TEST CASES
An idealized test case of a long channel with parallel boundaries is used to examine the pressure distributions that may be encountered in long and converging channels. We consider ice flow through a channel of 850 km length. The downstream exit is 30 km. In the reference case, a steady wind of 5 m/s acts on an ice cover of uniform 1 m thickness and 0.7 concentration. Water current is set to zero. A sketch of the initial conditions and boundaries is shown in Fig. 1. The extent of the initial ice cover is sufficiently large to maintain ice flow through the converging downstream part of the channel. Therefore, no additional ice is supplied upstream during the tests.
This idealized case is similar to the flow of granular materials in bins under gravity. Those flows usually show an increase of stresses with depth below the surface of within a relatively small depth (e.g. Nedderman, 1992). Friction along the boundaries reduces stresses below the hydrostatic stress distribution that may be expected in case of fluids (e.g. in the case of a liquid in a container). The maximum pressure value is reached at some distance upstream of the exit. The present problem differs from the flow of granular materials in two ways. The first is that the thickness of the ice can increase. The second difference is that the flow is driven by the drag forces on ice due to wind and water current instead of a constant gravity force in the case of granular flows through bins.
The present reference case corresponds to the following parameter values:
Strength parameter in Hibler’s (1979) pressure formula,
p* = 10 kPa; Ratio between the principal axes of the
elliptical yield envelope, e = 2; Initial ice thickness = 1 m; Initial ice concentration = 0.7; Water drag coefficient = 0.005; Wind drag coefficient
Fig. 1 Geometry of the test case
Centreline 200 km 30 km 115 km 30° 650 km 115 km
676
= 0.002; Grid cell size = 5 km; Time step = 5 minutes.
To simplify the test and maintain symmetrical deformation, the Coriolis force is not taken into account. The test covered a duration of 10 days.
The resulting deformation patterns are illustrated by showing typical plots of the velocity, thickness, concentration and pressure. Fig. 2 shows velocity vectors after 6 days from the start. The velocities appear nearly uniform within the straight part of the channel. In the converging section of the channel, the velocities are appreciably higher near the centre. Fig.3 and Fig.4 show the corresponding contour plots of the thickness and concentration. Most of the increase in the thickness and concentration takes place near the land boundaries in the converging section.
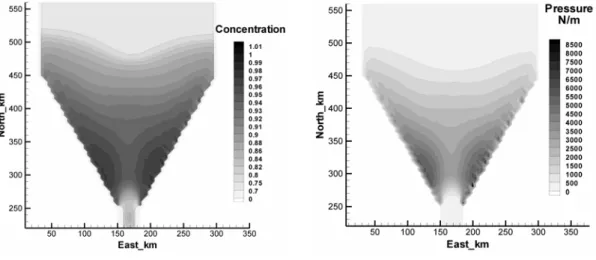
Contours of the pressure (mean normal stress) distribution are shown in Fig. 5. The maximum pressures occur along the land boundaries of the converging section of the channel.
677
Fig. 4 Ice concentration after 6 days Fig. 5 Pressure (mean normal stress) after 6 day
0 1000 2000 3000 4000 5000 6000 7000 200 250 300 350 400 450 500 550 600 650 700 Distance (km) P ressure (N/m) 1 day 2 days 3 days 4 days 5 days 6 days 7 days 8 days 9 days 10 days long channel converging channel
converging channel exit
wind direction 5 m/s
Fig. 6 Profiles of the pressure along the centre of the channel
Profiles of the pressure along the centerline of the channel are plotted in Fig. 6. The profiles indicate that the pressures continued to increase albeit at a decreasing rate through the duration of the test.
The preceding resulting may have some implications for navigation in long and converging channels. The zones of lowest pressures, which present the least hindrance to shipping, develop near the centre of the channel. The velocities, however, are highest in those zones, which can adversely affect navigation. The pressures can also continue to build-up over several days. The latter observation indicates that a sustained wind (acting over a sufficient fetch) can increase the threat to shipping due
678
to pressure build-up.
It should be noted that the present values of the pressures correspond to length scales of the order of several kilometers. The pressures experienced by ships correspond to smaller length scales of tens of meters. Consequently, the magnitude of pressures acting on ships would be larger than the present values. Therefore, the present results should be used to determine expected distribution of pressures rather than values of pressures on ships. Croasdale et al, (1992) discussed in detail the effect of length scale on the magnitude of ice pressure.
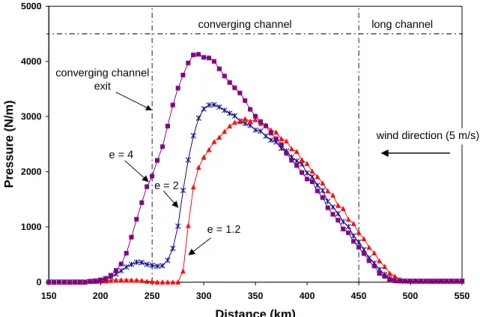
The role of the shear strength of the ice is examined by changing the width of the yield envelope. A smaller ratio between the major and minor principal axes, e=1.2, is used to represent an ice cover with higher shear strength than that used in the above test. Another test was done using e=4 to represent a case of an ice cover with smaller shear strength. The resulting profiles of the pressure are shown in Fig. 7. The larger shear strength (e=1.2) obviously corresponds to the lowest maximum pressures. This result might appear counter-intuitive, but can be explained as follows. In a manner reminiscent of the behavior of granular materials in bins, the increase in shear strength transfers more of the wind stresses to land boundaries. It should be noted that the above comparison between different values of shear strength was done while keeping the compressive strength (represented by the parameter p*) constant. A test done using a higher values of p*= 25 kPa, increased the maximum pressure to 3.8 kN/m for e=2. Tidal currents can have a significant influence on ice flow through channels, which include converging sections. For example, Samelson et al. (2005) observed that tidal current and freezing rates contribute to creating landfast ice in Nares Strait. The tidal effects are examined by introducing a semi-diurnal tidal current. The yield ellipse axes ratio e=1.2, while keeping other test variables similar to the reference case. The tidal velocity acts in a direction along the length of the channel and has a maximum value of 0.4 m/s. Fig. 8 shows the resulting pressure distributions at two phases of the tidal cycle starting from day 6. The tidal current was applied from the beginning of the run (i.e. for the whole duration of the run). The first plot in Fig. 8(a) corresponds to zero tidal current. The next plot [Fig. 8(b)] corresponds to the maximum current opposite the wind direction, and shows a decrease in pressures. The pressures, however, did not increase again as the tidal current turns and acts along the direction of the wind [the pressure distribution is almost identical to Fig. 8(b)]. The pressure then increased afterwards as the tidal current reached zero. More testing is needed to explain the reasons for that time lag.
679 0 1000 2000 3000 4000 5000 150 200 250 300 350 400 450 500 550 Distance (km) Pressure (N/m) e = 2 e = 4 e = 1.2
converging channel long channel
converging channel exit
wind direction (5 m/s)
Fig. 7 Profiles of the pressure for different values of ice shear strength (smaller values of the parameter e correspond to higher values of shear strength)
(a) zero tidal current (b) maximum tidal current Fig.8 Pressure distributions at two phases of the tidal cycle
The pressure distributions (Fig. 8) show some asymmetry. The initial positions of the PIC particles, which represent the ice cover, always include some asymmetry. This eventually show some asymmetry in the results (e.g. concentrations and pressures). Moreover, the land boundaries of the converging section are introduced through a no-slip condition at the appropriate nodes of the square grid. Those boundary conditions cause what appears as steps (and dark points) along the boundaries in Fig.8.
680
Profiles of the pressure along the centerline of the channels for case with tidal current applied from the beginning of a run are shown in Fig. 9. The profiles show the changes in pressure during a 12-hour cycle. In addition, profiles of pressure along the centerline for a test run done without the tidal current are plotted. The comparison in Fig. 9 shows that the tide reduces the pressures.
0 500 1000 1500 2000 2500 3000 3500 250 300 350 400 450 500 550 Distance (km) Pressure (N /m ) 6 days + 3 hrs + 6 hrs + 9 hrs + 12 hrs 6 days + 12 hrs
without tidal current
with tidal current
long channel converging channel
exit
wind direction 5 m/s
Fig. 9 Profiles of the pressure along the centre of the channel at different phases of the tidal cycle after 6 days, and profiles for the same case without tidal current are shown after
6 days and 12 hours later
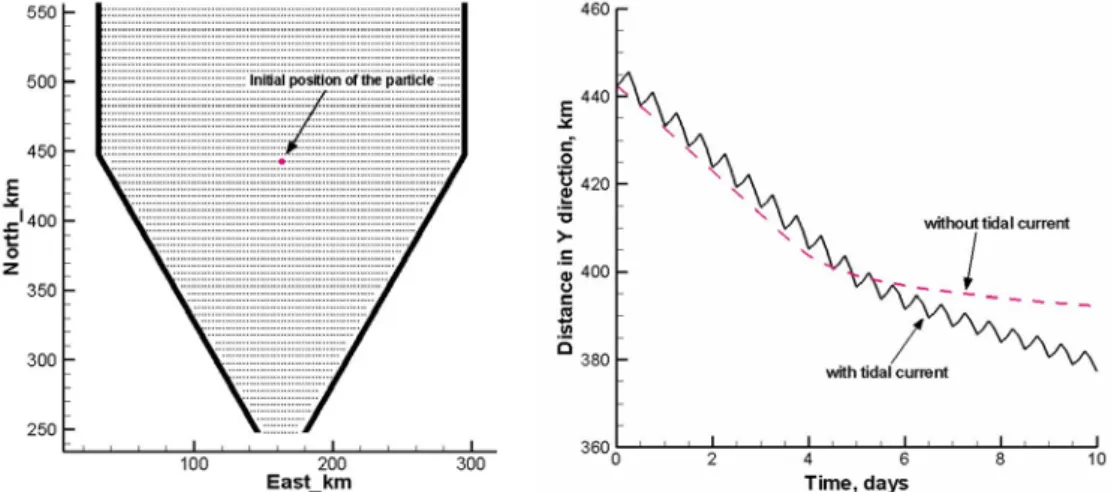
Fig. 10 Drift of a particle representing the indicated initial ice condition for a test case of that includes a tidal current and a test case without a tidal current
681
the channel is shown in Fig. 10. The drift was entirely along the y-direction. The drift without the tidal current is also shown. The comparison in Fig. 10 indicates that the tidal current has a minor influence on the drift over the initial 4 days. The influence of tide on drift within shorter durations (e.g. a day) is significant. After 4 days, the tidal currents appear to enhance the drift. The increase in drift may be due to the reduced pressures and concentration.
CONCLUSIONS
The present paper has explored aspects of the flow of ice in long converging channels, which may affect navigation. An idealized geometry and forcing were used in order to examine pressure distributions and the role of ice properties and tidal currents. The ice dynamics model used in the present paper employs Hibler’s (1979) elliptical yield envelope, and the thickness redistribution model of Savage (2007). The model also includes a Particle-In-Cell (PIC) advection approach.
The resulting pressure distributions indicate that higher pressures occur near the land boundaries of the converging section of the channel. A zone along the centre of the channel corresponds to the lowest pressures. Such areas of low pressures may correspond to lower risks to shipping. The highest ice velocities also occur in the same zones along the centre of the channel, which may adversely affects navigation. Increasing the shear strength of the ice cover caused a decrease of the maximum pressures along the centre of the channel. The higher shear strength apparently causes more of the wind stress to be transferred to the land boundaries, thereby reducing the peak pressures within the channel. This behaviour has some similarities with that of granular flows through bin.
Tests showed that including a semi-diurnal tidal current can influence the pressure distribution and drift of ice. Pressures fluctuated during the tidal cycles, and were lower than those obtained without including the tidal current. The tide affected the drift of the ice cover. The overall drift increased when tidal currents were introduced. As expected, drift slowed during parts of the tidal cycle when current velocity was opposite the wind direction. If cold temperatures coincide with such periods of slow drift, freezing may increase the likelihood of landfast ice or arch formation. That issue is beyond the scope of the present work. To date, the role of thermal freezing has not been included in forecast models.
ACKNOWLEDGEMENTS
The support of the Program on Energy Research and Development (PERD) is gratefully acknowledged.
682
REFERENCES
Croasdale K. R., Frederking R., Wright B., Comfort G. (1992). Size Effect on Pack Ice Driving Force. Proc, IAHR Ice Symposium, Banff, Alberta
Hibler III W.D. (1979). A dynamic thermodynamic sea ice model. J Phys Ocean, 9( 4): 815-846
Hibler W.D., Hutchings J.K. (2002). Multiple equilibrium Arctic ice cover states induced by ice mechanics. Proc 16th Int Association of Hydraulic Engineering and Research (IAHR) Symposium on Ice, Dunedin, New Zealand
Kubat I., Sayed M., Savage S. , Carrieres T. (2006). Flow of ice through converging channels. Proc 16th Int Offshore and Polar Engineering Conf, ISOPE, San Francisco, CA, USA
Kwok R. (2005). “Nares Strait ice flux. Geophysical Research Letters, 32, L24502, doi:10.1029/2005GL024768.
Nedderman R. M. (1992). Statics and kinematics of granular materials. Cambridge University Press
Pritchard R.S., Reimer R.W., Coon M.D. (1979). Ice flow through straits. Proc 5th Int Conf on Ports and Ocean Engineering Under Arctic Conditions (POAC), Trondheim, Norway
Samelson R.M, Agnew T, Melling H, Munchov A. (2005). Evidence for atmospheric control of sea-ice motion through Nares Strait. Geophysical Research Letters , 33, LXXX , doi:10.1029/2005GL025016
Savage S.B. (2007). Two component sea-ice thickness redistribution model. Submitted to Cold Regions Science and Technology
Sayed M., Carrieres T., Tran H. , Savage S.B. (2002). Development of an operational ice dynamics model for the Canadian Ice Service. Proc 12th Int Offshore and Polar Engineering Conf, ISOPE, Kitakyushu, Japan
Sodhi D.S. (1977). Ice arching and the drift of pack ice through restricted channels. CRREL Report 77-18, Hanover, New Hampshire
Zhang J. , Hibler III W.D. (1997). On an efficient numerical method for modelling sea ice dynamics. J Geophysical Research, 102(C4) :8691-8702