Publisher’s version / Version de l'éditeur:
Vous avez des questions? Nous pouvons vous aider. Pour communiquer directement avec un auteur, consultez la première page de la revue dans laquelle son article a été publié afin de trouver ses coordonnées. Si vous n’arrivez pas à les repérer, communiquez avec nous à PublicationsArchive-ArchivesPublications@nrc-cnrc.gc.ca.
Questions? Contact the NRC Publications Archive team at
PublicationsArchive-ArchivesPublications@nrc-cnrc.gc.ca. If you wish to email the authors directly, please see the first page of the publication for their contact information.
https://publications-cnrc.canada.ca/fra/droits
L’accès à ce site Web et l’utilisation de son contenu sont assujettis aux conditions présentées dans le site LISEZ CES CONDITIONS ATTENTIVEMENT AVANT D’UTILISER CE SITE WEB.
AWWA 2007 Water Technology Conference [Proceedings], pp. 1-11, 2007-11-04
READ THESE TERMS AND CONDITIONS CAREFULLY BEFORE USING THIS WEBSITE.
https://nrc-publications.canada.ca/eng/copyright
NRC Publications Archive Record / Notice des Archives des publications du CNRC :
https://nrc-publications.canada.ca/eng/view/object/?id=23cfcea2-ba81-48c8-bbdd-b1432d032673 https://publications-cnrc.canada.ca/fra/voir/objet/?id=23cfcea2-ba81-48c8-bbdd-b1432d032673
NRC Publications Archive
Archives des publications du CNRC
This publication could be one of several versions: author’s original, accepted manuscript or the publisher’s version. / La version de cette publication peut être l’une des suivantes : la version prépublication de l’auteur, la version acceptée du manuscrit ou la version de l’éditeur.
Access and use of this website and the material on it are subject to the Terms and Conditions set forth at
Modeling of heterotrophic bacteria in a water distribution system
http://irc.nrc-cnrc.gc.ca
M o d e l i n g o f h e t e r o t r o p h i c b a c t e r i a i n a w a t e r
d i s t r i b u t i o n s y s t e m
N R C C - 5 0 0 6 2
F r a n c i s q u e , A . ; R o d r i g u e z , M . ; M i r a n d a , L . ;
S a d i q , R .
A version of this document is published in / Une version de ce document se trouve dans: AWWA 2007 Water Technology Conference, Charlotte, N.C., Nov. 4-8, 2007, pp. 1-11
The material in this document is covered by the provisions of the Copyright Act, by Canadian laws, policies, regulations and international agreements. Such provisions serve to identify the information source and, in specific instances, to prohibit reproduction of materials without written permission. For more information visit http://laws.justice.gc.ca/en/showtdm/cs/C-42
Les renseignements dans ce document sont protégés par la Loi sur le droit d'auteur, par les lois, les politiques et les règlements du Canada et des accords internationaux. Ces dispositions permettent d'identifier la source de l'information et, dans certains cas, d'interdire la copie de documents sans permission écrite. Pour obtenir de plus amples renseignements : http://lois.justice.gc.ca/fr/showtdm/cs/C-42
Modeling of heterotrophic bacteria in a water distribution system
Alex Francisque*, Manuel Rodriguez*, Luis Miranda* and Rehan Sadiq**
For routine microbiological monitoring of water quality in distribution systems (DS), heterotrophic plate count (HPC) constitutes a standard indicator that’s widely used. (Grabow 1996; Edberg and Allen 2004; Pavlov et al. 2004). HPC are, generally, non-pathogenic bacteria that can appear in DS in particular when pipes are dirty or when levels of residual disinfectant are insufficient (Edberg 1997; Russin et al. 1997; Zhang and Digiano 2002; Berry et al. 2006). The growth of bacteria in the DS depends on a number of physical, chemical and operational conditions (Zhang and DiGiano 2001), as well as on seasonal fluctuations (Berry et al., 2006). The main influential factors are residual free chlorine, the presence of assimilable organic carbon (AOC), water temperature, pH, the nature of pipes, the presence of corrosion and the shear in the biofilm-liquid interface (LeChevalier et al. 1990, 1993; Ollos 1998; Zhang and DiGiano 2001; Ndiongue et al. 2005). Some authors also mention the distance with regard to the water treatment plant (WTP), thus, the residence time of the water within the DS, conductivity and turbidity (Carter et al. 2000; Momba et al. 2004).
High HPC may indicate some failure in the treatment process, especially disinfection, and contamination events within the DS (Allen et al. 2002; Leclerc 2003; Sartoty 2004). The spatial and temporal variability of HPC can indicate a non-specific contaminant intrusion in DS. HPC can then used as an early indicator of the deterioration of water quality (Sartory 2004). In some DS, HPC may reach values greater than 10 000 cfu/ml (Allen et al. 2002). In conditions of high HPC in water, the detection of coliform in culture media with lactose may be inhibited (Geldreich et al. 1972; Chevalier 1985; Allen et al. 2002; Reasoner 2004). Largely for this reason, a threshold of 500 cfu/ml is frequently used as an operational criterion when monitoring HPC in North America (USEPA 1989; GSE 2003; Health Canada 2004). In other countries (e.g. Japan and Germany), a count below 100 cfu/ml for HPC is considered a guarantee of the hygienic security of the consumers (Pavlov 2004; Hambsch et al. 2004).
Regular monitoring of HPC in DS thus provides useful data for assessing microbiological quality of drinking water. However, surveillance of HPC at high frequency in several locations of the DS, as is common for other parameters, is expensive and time-consuming. In addition, to insure the control of water quality in the DS, it is necessary to have an adequate understanding of operational and water quality parameters associated with HPC.
The objectives of this paper are: i) to identify the factors explaining the spatiotemporal distribution of HPC in the DS; ii) and to develop models which permit the prediction of HPC.
*
CRAD, Université LAVAL, Québec, Canada ** CRAD/National Research Council, Ottawa, Canada E-mail address: alex.francisque.1@ulaval.ca (A. Francisque)
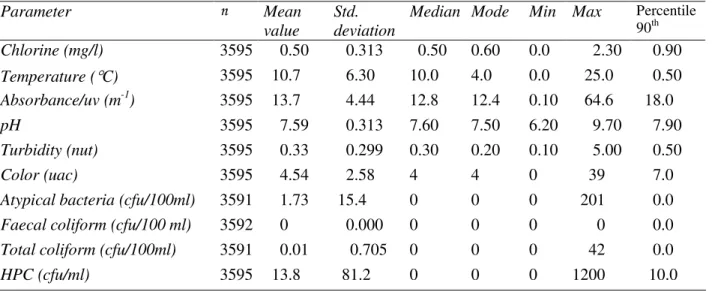
The case under study is the main DS of Quebec City, Canada, which serves around 240,000 people. For the routine surveillance of water quality, the utility managers monitor about 50 sampling points (daily, twice a week and weekly, according to the location). Table 1 presents the main characteristics of the monitoring data collected from 2003 to 2005.
Table 1. Distribution of main water quality parameters monitored in the DS (2003-2005)
Parameter Mean
value
Std. deviation
Median Mode Min Max Percentile 90th Chlorine (mg/l) 3595 0.50 0.313 0.50 0.60 0.0 2.30 0.90 Temperature (°C) 3595 10.7 6.30 10.0 4.0 0.0 25.0 0.50 Absorbance/uv (m-1) 3595 13.7 4.44 12.8 12.4 0.10 64.6 18.0 pH 3595 7.59 0.313 7.60 7.50 6.20 9.70 7.90 Turbidity (nut) 3595 0.33 0.299 0.30 0.20 0.10 5.00 0.50 Color (uac) 3595 4.54 2.58 4 4 0 39 7.0
Atypical bacteria (cfu/100ml) 3591 1.73 15.4 0 0 0 201 0.0
Faecal coliform (cfu/100 ml) 3592 0 0.000 0 0 0 0 0.0
Total coliform (cfu/100ml) 3591 0.01 0.705 0 0 0 42 0.0
HPC (cfu/ml) 3595 13.8 81.2 0 0 0 1200 10.0
For this study, a robust database built using results from the routine monitoring of water quality is used (about 3600 measurements of HPC and other parameters). The database contains information about various physical and chemical parameters, such as residual free and total chlorine, temperature, absorbance, pH, turbidity, true and visible color, conductivity, hardness, fluorides, metals, organic compounds among which haloacetic acids and trihalomethanes. It contains information about the following microbiological parameters: coliforms, atypical bacteria and HPC.
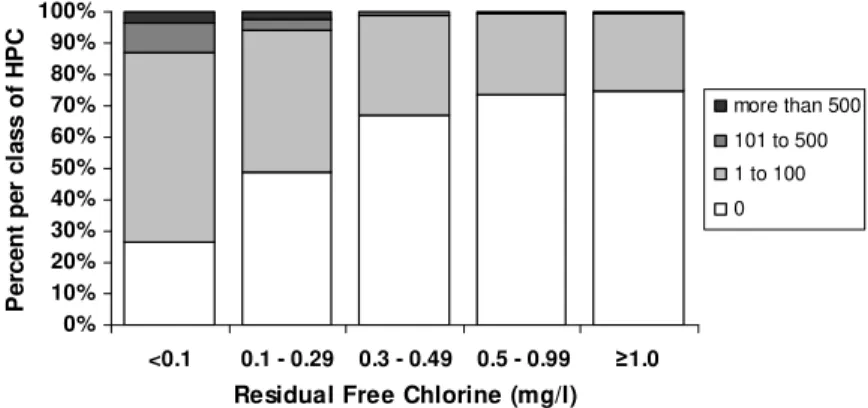
For analysis purposes, the distribution of HPC was grouped into 4 categories: (HPC = 0, HPC from 1 to 100; from 101 to 500, and HPC higher than 500 cfu/ml). Figure 1 illustrates the impact of free residual chlorine levels on HPC in the DS. It is interesting to note that when the levels of free residual chlorine are below 0.3 mg/l - which is an usual threshold at the exit of the water treatment plant (USEPA 1989) - HPC sometimes exceed the threshold of 500 cfu/ml. These results confirm the observations made by other authors concerning the importance of maintaining minimum levels of residual disinfectant (Zhang and DiGiano 2002; Huck and Gagnon 2004; Ndiongue et al. 2005).
0% 10% 20% 30% 40% 50% 60% 70% 80% 90% 100% <0.1 0.1 - 0.29 0.3 - 0.49 0.5 - 0.99 ≥1.0
Residual Free Chlorine (mg/l)
P e rc e n t p e r c la s s o f H P C more than 500 101 to 500 1 to 100 0 0% 10% 20% 30% 40% 50% 60% 70% 80% 90% 100% ≤4 4.1 - 11 11.1 - 18 > 18 Temperature (oC) P e rc e n t p e r c la s s o f H P C more than 500 101 to 500 1 to 100 0
Figure 1. Effect of free chlorine residual on HPC levels in the DS under study
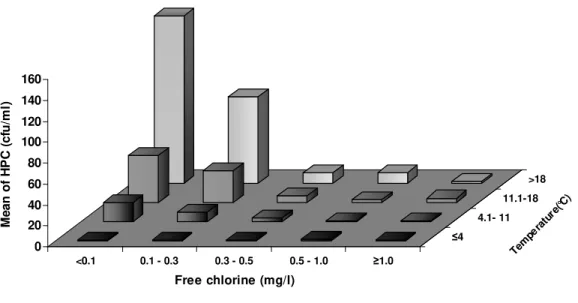
Figure 2 highlights the impact of water temperature on HPC. In conditions of water temperature lower than 4C, no levels of HPC higher than 100 cfu/ml were observed. Most cases of HPC higher than this threshold were observed when temperature of water was higher than 11C. It is also noteworthy that the majority of samples exceeding 500 cfu/ml were collected when water temperature exceeded 18°C. Figure 3 demonstrates that in cold water conditions, the level of free residual chlorine is not a critical parameter to ensure very low HPC in the DS. Under these conditions, water temperature is too low to favor the presence of microorganisms in the DS. Figure 3 also demonstrates that to ensure very low HPC in warm water conditions (water temperature higher than 18°C), a free residual chlorine concentration higher than 0.3 mg/l must be favored. The figure also suggests that to avoid high levels of HPC in warm water conditions, a minimum concentration of free residual chlorine of 0.1 mg/l must be favored.
0 20 40 60 80 100 120 140 160 M e a n o f H P C ( c fu /m l) <0.1 0.1 - 0.3 0.3 - 0.5 0.5 - 1.0 ≥1.0 ≤4 4.1- 11 11.1-18 >18 Free chlorine (mg/l) Tem pera ture (°C)
Figure 3. Relationship between free chlorine, temperature and HPC levels in the DS
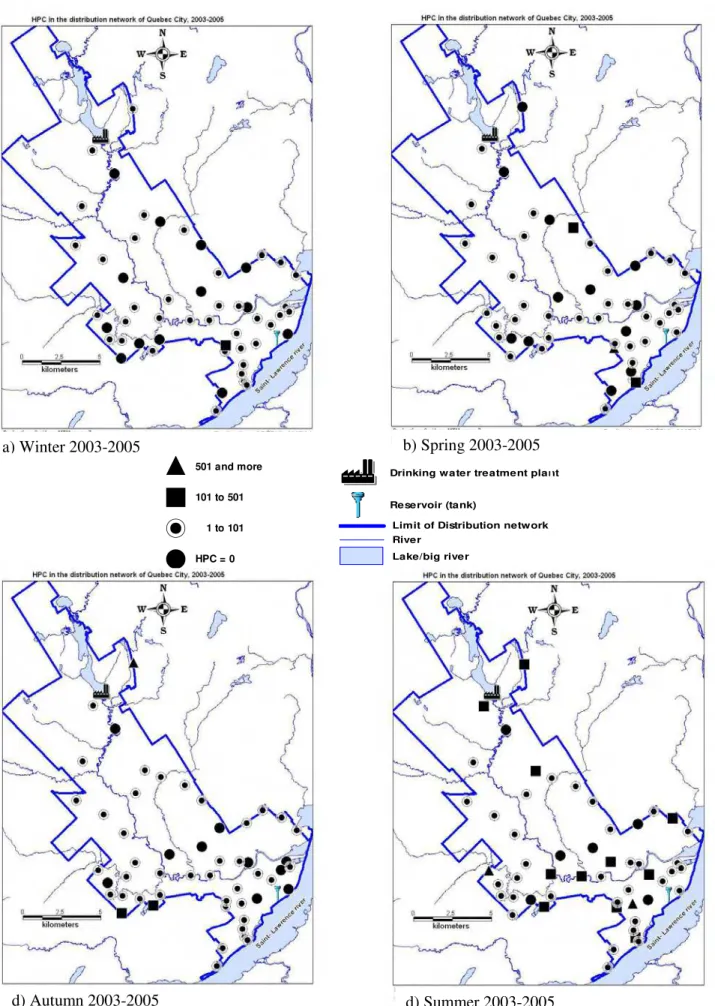
The difficulty of maintaining very low levels of HPC in warm water conditions is illustrated in Figure 4. In fact, in summer, a relatively high number of sampling points had high levels of HPC. In addition to temperature conditions, this result is also associated with the fact that in summer high chlorine demand makes the maintenance of adequate levels of free residual chlorine throughout the DS difficult, in particular at the extremities. In fact, as illustrated in Figure 5, the impact of the residence time of water on HPC appeared to be much higher in summer than during the other seasons. That is, in warm water conditions, the development of biofilm within the DS is more likely, which, in turn, favors the occurrence of heterotrophic bacteria, in particular at DS extremities where the levels of free residual chlorine are the lowest.
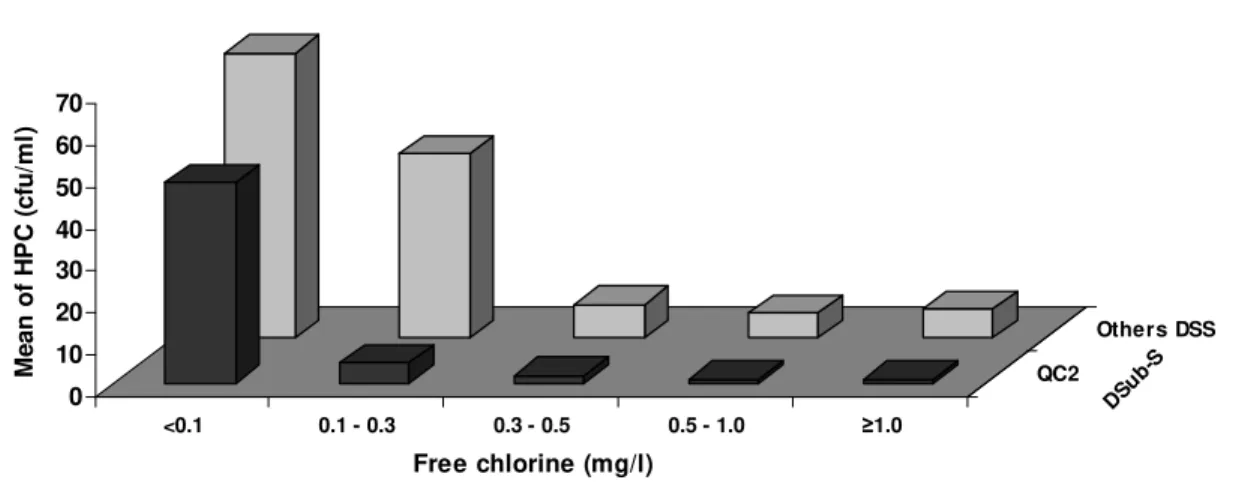
The distribution system under study is composed of four sub-systems (DSS) which have different hydraulic characteristics (type and age of the pipes, pressure, flow rates, etc.). The analysis of the data showed that the HPC count was much lower in one specific sub-system in comparison with the others (Figure 6). In addition, the effect of free residual chlorine level on HPC appeared to be different according to the subsystems.
According to the analysis of the data, other water quality parameters also apparently influenced the occurrence of heterotrophic bacteria in the DS under study: UV-absorbance, turbidity and pH (results not reported in this paper).
a) Winter 2003-2005 b) Spring 2003-2005
d) Autumn 2003-2005 d) Summer 2003-2005
Figure 4. Locations for which the percentile 90th of HPC in samples collected in 2003, 2004 and 2005 belong to range of HPC
501 and more 101 to 501
1 to 101 HPC = 0
Drinking water treatment plant
Reservoir (tank)
Limit of Distribution network
Lake/big river River
0 10 20 30 40 50 60 70 M e a n o f H P C ( c fu /m l) <0.1 0.1 - 0.3 0.3 - 0.5 0.5 - 1.0 ≥1.0 QC2 Others DSS Free chlorine (mg/l) DSu b-S 0 100 200 300 400 500 600 700 0 1 2 3 4 5 Seasons H P C 9 0 th P e rc e n ti le QC404 QC304 QC105
Winter Spring Automn Summer
Figure 5. Seasonal distribution of HPC (percentile 90th) in three selected sampling points with different residence time of water (RTW) (QC404: low RTW; Qc304: medium RTW; QC105: high RTW)
Figure 6. Relationship between free chlorine, DSS and HPC levels in DS
The previous analysis suggests that the factors potentially influencing the occurrence of heterotrophic bacteria in the DS could be inter-related. For conditions of high water temperatures, for example, several phenomena may arise simultaneously: development of biofilm in the DS, release of bacteria from the biofilm, increase of organic matter from the biofilm, incrementing of turbidity, increase of chlorine demand, decrease of free residual chlorine levels. Consequently,
the quantitative analysis of the impact on HPC of each single factor is not sufficient to identify the most critical variables at stake. Multivariate approaches for data analysis must therefore be favored to identify such variables.
Multivarite models were developed to explain and predict the occurrence of heterotrophic bacteria based on the database described previously. The application of multivariate models permits the consideration of autocorrelation between explanatory variables. Two types of models were applied: logistic regression and negative binomial models. The first allow for modeling the presence or absence of an event (in this case, samples with negative or positive results for samples for HPC). The second is a method adapted to model rare events (in this case, quantitative results of HPC in samples). For the logistic regression model, three variables were identified as significantly influencing the presence of heterotrophic bacteria in the DS under study (table 2). According to the model, the level of free residual chlorine is the most critical variable which controls the presence of heterotrophic bacteria (higher Wald, negative association, B < 0). Water temperature and absorbance were also significant variables, but less so than residual chlorine. Other water quality variables (turbidity, pH) and operational characteristics (type of distribution system) were not significant in this model.
Table 2. Significant variables associated with HPC and statistical parameters (logistic regression)
Variables
β Wald df Significance
(level of Wald statistic)
(p<0.05)
eβ
Free residual chlorine -1.460 93.33 1 <0.001 0.23
Temperature 0.033 26.06 1 <0.001 1.03
Absorbance 0.086 6.42 1 0.011 1.09
Constant -0.564 0.27 1 0.603 0.57
β: logistic regression coefficients (convenient for testing the usefulness of predictors); df:
degree of freedom; eβ: ratio-change in the odds of the event of interest (presence of HPC)
for a one-unit change in the predictor
According to these results, the model that allows for the best prediction of the probability of positive values for HPC is the following:
where Prob. ( =1/ ) is probability that = 1 (presence of heterotrophic bacteria) given (predictor(s) or independent variable(s)).
To estimate the specific HPC values obtained in samples, the negative binomial regression (also called Poisson-Gamma regression) was applied. The results show that the expected HPC decreases with the increase of free residual chlorine, increases with the increase of water
1
1+e *e *e *e
temperature, and increase with the increase of absorbance, similar to results obtained with logistic regression (table 3). But, in this case, two other variables appeared as significant predictors: the type of DS and the pH. The strength of these relationships is influenced by the seasonal conditions.
Table 3. Significant variables associated with HPC and statistical parameters (Negative binomial)
Variables β z Significance level of z statistic
(p<0.05)
Free residual chlorine -2.132 -8.03 <0.001
Type of SDS -0.041 -6.95 <0.001
Temperature 0.103 6.91 <0.001
Absorbance 0.093 4.61 <0.001
pH 0.390 2.33 0.020
Constant -2.515 -1.91 0.068
β: Poissson-Gamma regression coefficients; z: square root of the Wald statistic
The negative binomial model describing the phenomenon and allowing estimating the count of the heterotrophic bacteria ( i) in the DS under study is the following:
i
=
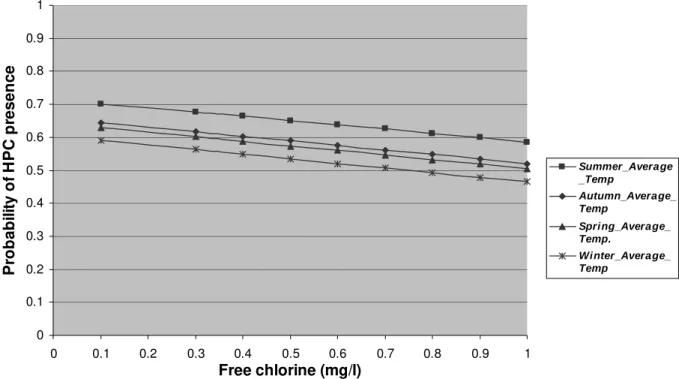
e *e *e *e t *e *eA sensitivity analysis allows for the identification of seasonal-based strategies to reduce the levels of HPC. Figure 7 reveals that disregarding water temperature (or season), the maintenance of sufficient levels of free residual chlorine allows for the reduction of probability of the presence of heterotrophic bacteria in the DS. By considering the average temperature by season and an absorbance of 10m-1, to maintain the probability of presence of heterotrophic bacteria lower than 0.5, is needed a concentration in free residual chlorine of at least 0,75 mg/l in winter, slightly superior to 1.0 mg/l in spring and around 1.2 mg/l in autumn. For summer, on the other hand, the necessary concentration in free residual chlorine is very superior to 1.0 mg/l, according to the look of the curve. In every case, when there is less than 0.3mg/l of residual chlorine in the network, it is evident that the probability that heterotrophic bacteria are present is superior to 0.5. Thus, samples taken in these conditions would be classified in the group of samples with presence of heterotrophic bacteria.
0 0.1 0.2 0.3 0.4 0.5 0.6 0.7 0.8 0.9 1 0 0.1 0.2 0.3 0.4 0.5 0.6 0.7 0.8 0.9 1 Free chlorine (mg/l) P ro b a b il it y o f H P C p re s e n c e Summer_Average _Temp Autumn_Average_ Temp Spring_Average_ Temp. Winter_Average_ Temp
Figure 7. Sensitivity analysis for HPC occurrence according to free chlorine variations. (Predicted probability, cut value: 0.5)
Predictive models for HPC could be used by the utility’s decision-makers to identify the locations where water quality deteriorates most easily, in order to implement preventive and corrective actions. Models can also estimate the levels of free residual chlorine it would be necessary to maintain in the water in order to decrease the probability of presence of HPC, given the conditions for other parameters, such as temperature, absorbance, etc.
It is clear these models are specific to the DS under study. However, the parameters found to be significant have also been identified in studies conducted elsewhere. Thus, while taking into account particularities of the Quebec City DS, such as very specific climatic variations, these models reflect the phenomenon of bacteria growth in water DS, and, with certain precautions, may be generalized.
The models presented herein have, however, certain limitations that must be considered in future research. These limitations are associated, in particular, with the lack of precise data concerning water residence estimation at each monitoring point of the DS, the presence of biofilm within the pipes and the specific characteristics of the pipelines (materials, age diameter, etc.). The models presented in this paper are exploratory ones. To improve the capacity to predict HPC in DS to develop more useful tools for utility managers, it will be necessary to generate more robust data and models to better consideration of the spatial and temporal factors influencing HPC in the DS.
! " # $%
The authors thank the Director of the «Division des Laboratories du Service de l’Environnement» of Quebec City, Mr. François Proulx and all the staff for them full and whole collaboration, the Service of the Public works as well as Pablo Montenegro and Christelle Legay.
&
1. Allen, M.J., Edberg, C. S. et Reasoner, D J (2002). Heterotrophic plate count bacteria __ what is their
significance in drinking water? International Journal of Microbiology 92 (2004), pp 265-274
2. APHA, AWWA and AEF (1998). Standards Methods for the Examination of Water and Wastewater, 20th edn. American Public Health Association, American Water Works Association, Water
Environmental Federation, Washington D.C.
3. Beate, H., Clara, S. and Ivo, W. (2004). Heterotrophic plate count and consumer’s health under
special consideration of water softeners. International Journal of Microbiology 92, 365-373.
4. Bernard, P-M. Régression logistique, Cours EPM-64312. Département de Médecine Sociale et
préventive, Canada.
5. Berry, D., Xi, C. and Raskin, L. (2006). Microbial ecology of drinking water distribution systems.
Elsevier. Biotechnology 2006, 17:297–302
6. Cameron, A. et Trivedi, P. (1998). Regression Analysis of Count Data, Cambridge, Cambridge
University, Press.
7. Carter, J.T., Rice, E.W., Buchberger, S.G. and Lee, Y. (2000). Relationships between levels of
heterotrophic bacteria and water quality parameters in a drinking water distribution system. Water Research 34 (5), 1495-2000.
8. Dionne, G., Desjardins, D. et Pinquet, J. (1999). L’évaluation des risques d’accidents des
transporteurs routiers: des résultats préliminaires. Cahier de recherche 99-02, École des Hautes Études Commerciales (HEC) Montréal.
9. LeChevalier, M.W. et McFeters, G.A. (1985). Interactions between Heterotrophic Plate Count
Bacteria and Coliform Organisms. Applied and Environmental Microbiology 49, pp. 1338-1341.
10. LeChevallier, M.W., Lowry, C.D., Lee, R.G., (1990). Disinfecting biofilms in a model distribution
system. J. Am. Water Works. Assoc. 82 (7), 87–99.
11. LeChevallier, M.W., Lowry, C.D., Lee, R.G., Gibbon, D.L., (1993). Examining the relationship
between iron corrosion and the disinfection of biofilm bacteria. J. Am. Water Works. Assoc. 85 (7), 111–123.
12. Leclerc, H. (2003). Y a-t-il des infections bactériennes opportunistes transmises par les eaux
d’alimentation ? Journal Européen d’hydrologie, tome 3, fasc. 1, pp. 11-44.
13. Lopez, C (2000). La régression de poisson avec GENMOD. Institut de ‘Élevage, Service Biométrie,
France.
14. Ndiongue S., Huck P.M., Slawson R.M., (2005). Effects of temperature and biodegradable
organic matter on control of biofilms by free chlorine in a model drinking water distribution system. Water Research 39. 953–964.
15. Ollos, P.J., (1998). Effects of Drinking Water Biodegradability and Disinfectant Residual on
Bacterial Regrowth. Doctoral Thesis, Department of Civil Engineering, University of Waterloo, Waterloo, Canada.
16. Pavlov, D., de Wet, C.M.E., Grabow, W.O.K. and Ehlers, M.M. (2004). Potentially pathogenetic
features of heterotrophic plate count bacteria isolated from treated and untreated drinking water. International Journal of Microbiology 92, 275-287.
17. Reasoner, J.P. (2004). Heterotrophic plate count methodology in the United States.
18. Russin, P.A., Rose, J.B., Haas, C.N. and Gerba, C.P. (1997). Risk assessment of opportunistic
bacterial pathogens in drinking water. Reviews of Environmental Contamination and Toxicology 152, 57-83.
19. Sartory, P. D. (2004). Heterotrophic plate count monitoring of treated drinking water in the UK: a
useful operational tool. International Journal of Microbiology 92, pp. 297-306.
20. United States Environmental Protection Agency (USEPA), (1989). 40 CRF parts 141 and 142
Drinking Water; national primary water rules and regulations; filtration, disinfection, turbidity, Giardia lamblia, viruses, Legionella and heterotrophic bacteria final rule. US Environmental
Protection Agency. Fed. Reg. 54 (124), 27486-27541.
21. Villeneuve, J-P., Mailhot, A., Salvano, E., (2002). Problématique de l’approvisionnement et de
l’utilisation de l’eau potable dans la nouvelle ville de Québec. Rapport final, t.1. INRS-Eau/Terre/Environnement, Québec.
22. Zhang, W. and DiGiano, F. (2002). Comparison of regrowth in distribution systems using free
chlorine and chloramine: a statistical study of causative factors. Water Research 36, 1469-1482. Santé canada
MEDDQ : Règlement sur la qualité de l’eau potable :
! " # " $ $ % &
Centre d’Expertise en Analyse Environnementale du Québec :
,
http://www.ceaeq.gouv.qc.ca/methodes/bio_toxico_micro.htm#bhaa
Groupe Scientifique sur l’Eau potable : http://www.inspq.qc.ca/pdf/publications/198-CartableEau/ColoniesAtypiques.pdf,
