Publisher’s version / Version de l'éditeur:
Vous avez des questions? Nous pouvons vous aider. Pour communiquer directement avec un auteur, consultez la première page de la revue dans laquelle son article a été publié afin de trouver ses coordonnées. Si vous n’arrivez pas à les repérer, communiquez avec nous à PublicationsArchive-ArchivesPublications@nrc-cnrc.gc.ca.
Questions? Contact the NRC Publications Archive team at
PublicationsArchive-ArchivesPublications@nrc-cnrc.gc.ca. If you wish to email the authors directly, please see the first page of the publication for their contact information.
https://publications-cnrc.canada.ca/fra/droits
L’accès à ce site Web et l’utilisation de son contenu sont assujettis aux conditions présentées dans le site LISEZ CES CONDITIONS ATTENTIVEMENT AVANT D’UTILISER CE SITE WEB.
5th NRC Symposium on Computational Fluid Dynamics and Multi-Scale Modeling
[Proceedings], pp. 1-10, 2008-01-21
READ THESE TERMS AND CONDITIONS CAREFULLY BEFORE USING THIS WEBSITE.
https://nrc-publications.canada.ca/eng/copyright
NRC Publications Archive Record / Notice des Archives des publications du CNRC :
https://nrc-publications.canada.ca/eng/view/object/?id=adf332b9-993b-4b66-b174-a5508b60036d https://publications-cnrc.canada.ca/fra/voir/objet/?id=adf332b9-993b-4b66-b174-a5508b60036d
NRC Publications Archive
Archives des publications du CNRC
This publication could be one of several versions: author’s original, accepted manuscript or the publisher’s version. / La version de cette publication peut être l’une des suivantes : la version prépublication de l’auteur, la version acceptée du manuscrit ou la version de l’éditeur.
For the publisher’s version, please access the DOI link below./ Pour consulter la version de l’éditeur, utilisez le lien DOI ci-dessous.
https://doi.org/10.4224/20378172
Access and use of this website and the material on it are subject to the Terms and Conditions set forth at
CFD simulations for verification of ventilation strategies in Tube C of
the Ville-Marie tunnel in Montréal City
http://irc.nrc-cnrc.gc.ca
C F D s i m u l a t i o n s f o r v e r i f i c a t i o n o f
v e n t i l a t i o n s t r a t e g i e s i n T u b e C o f t h e V i l l e
-M a r i e t u n n e l i n -M o n t r é a l C i t y
N R C C - 5 0 2 6 5
K a s h e f , A . ; S a b e r , H . H .
A version of this document is published in / Une version de ce document se trouve dans: 5th NRC Symposium on Computational Fluid Dynamics and Multi-Scale Modeling, Ottawa, Ontario, January 21, 2008, pp. 1-10
The material in this document is covered by the provisions of the Copyright Act, by Canadian laws, policies, regulations and international agreements. Such provisions serve to identify the information source and, in specific instances, to prohibit reproduction of materials without written permission. For more information visit http://laws.justice.gc.ca/en/showtdm/cs/C-42
Les renseignements dans ce document sont protégés par la Loi sur le droit d'auteur, par les lois, les politiques et les règlements du Canada et des accords internationaux. Ces dispositions permettent d'identifier la source de l'information et, dans certains cas, d'interdire la copie de documents sans permission écrite. Pour obtenir de plus amples renseignements : http://lois.justice.gc.ca/fr/showtdm/cs/C-42
CFD Simulations for Verification of Ventilation Strategies in Tube C of
the Ville-Marie Tunnel in Montréal City
Ahmed Kashef and Hamed H. Saber
National Research Council of Canada, Institute for Research in Construction 1200 Montréal Road, Bldg. M59, Ottawa, Ontario K1A 0R6 Canada
ABSTRACT – Successful CFD simulations of fires in large complicated structures, such as tunnels, are largely dependent on the accuracy of the input data (initial conditions, prevailing winds, ventilation flows, and most importantly, heat release rate from burning objects). A research project has been conducted at NRC-IRC that uses both numerical and experimental studies to evaluate the performance of in-place emergency ventilation strategies to control smoke spread and minimize the impact of smoke on tunnel users in the event of a fire in a road tunnel. The numerical study uses the Fire Dynamics Simulator (FDS) CFD model to study smoke ventilation in tunnels. The experimental phase was used to partially validate the CFD model and provide the necessary input data. In total, seven CFD simulations were conducted for a fire of a size of 30 MW (a bus or truck on fire) in a tunnel section. The first four fire scenarios were simulated in a straight region of the tunnel section. The other three fire scenarios were simulated in a curved region of the tunnel section. Based on the study, recommendations were made to optimize the ventilation scenarios in the tunnel section. This paper presents the details of the study as well as the recommendations made.
1 INTRODUCTION
In order to enhance highway tunnel users’ safety during a fire, the Mechanical Ventilation
Systems (MVS) must be able to maintain a safe egress route that is free of smoke, toxic and hot gases. The most serious emergency would result from a stopped vehicle on fire in the tunnel, disrupting traffic and requiring passenger evacuation. In this situation, efforts should be focused on ensuring a proper Emergency Ventilation Strategy (EVS) capable of maintaining one or more evacuation paths from the tunnel, clear of smoke and hot gases. Using experimental and/or numerical modelling approaches facilitate the study of MVS performance. Experimental approaches include both reduced and full-scale physical model tests and on-site
measurements. Numerical modelling approaches involve one-, two- and three-dimensional modelling. During a fire, airflow temperature and speed will be greatly modified. In order to ensure a safe and tenable egress route, the backlayering phenomenon should be eliminated or minimized. Backlayering is the uphill flow of a layer of hot smoke and gases against the
ventilating stream.
The Ville-Marie tunnel, constructed in 1974, crosses the heart of the Montréal downtown area over a 2.16 km length in the East-West direction. It is composed of two principal tubes with three to five lanes each. The tunnel constitutes a major underground system from the point of view of circulation and structural complexity. The tunnel includes five ventilation towers approximately 300 to 460 m apart. Tower 9, on Viger Avenue, is used as a control and
monitoring centre for the tunnel. The Ville-Marie tunnel involves a rather complex geometry with different numbers of lanes (1 to 5 lanes), slope, natural ventilation (favouring or opposing smoke clearance), type of MVS (partial/semi transversal or longitudinal), and cross-section height. In order to properly assess the performance of the EVS in the tunnel, it is important to study the different combinations of these parameters and their effects on the ventilation operation.
Four full-scale fire tests were conducted for a fire size of 1 MW in a section of the Ville-Marie tunnel. This fire size was selected to minimize the risk of damage to the tunnel and its
associated systems while producing reliable data for verifying the numerical models. The tested section (referred to as Tube C) was about 853 m long and extends from CH17+00 (east portal of Tube A) to CH45+00 (west portal of Tube C) (see Figure 1). Distances along the tunnel are expressed, in the context of this paper, in Chainages (CHs) where 1 CH = 100 ft = 30.48 m. Traffic travels from the east toward the west. The first two fires were conducted in a straight region of Tube C at CH28+50. The other two fires were conducted in the curved region of Tube C at CH36+00. Temperature and Smoke Optical Density (SOD) measurements were made at four locations in all tests, namely, at the fire location, at 50 m downstream of the fire, at 100 m downstream of the fire, and 50 at m upstream of the fire. Upstream of the fire denotes the direction from which the traffic flows. In addition, airflow velocity measurements were made at different locations with and without the fire and ventilation. These measurements provided the necessary input data for the CFD simulations.
The test results showed that a high positive airflow upstream of the fire (i.e. airflow in the same direction of the traffic flow) for a fire at CH28+50 resulted in a short backlayering distance. The longitudinal airflow velocity for the fire at CH36+00 was about zero due to a localized effect of the distributed exhaust vents on both the north and south walls, resulting in the SOD upstream and downstream of the fire to be significantly higher than that for the fire at CH28+50. At 50 m downstream of the fire for all tested scenarios, the top smokemeter recorded higher SOD than that by the lower smokemeter, indicating that most of the smoke was located close to the tunnel ceiling. The smoke travelled mainly downstream of the fire for a fire at CH28+50, while it travelled both downstream and upstream of the fire for a fire at CH36+00. The fire plume was more tilted downstream of the fire (due to the higher positive airflow upstream of the fire) for fire at CH28+50 compared to that at CH36+00. In all tests, the maximum vertical temperature occurred at a distance of approximately 3.0 m below the ceiling. More details about the results of these fire tests are available in [1].
In this paper, the Fire Dynamic Simulator (FDS) CFD model [2] was used to simulate the behaviour of the smoke originating from fires in the Ville-Marie tunnel. The calibration and the verification of the model involved in-situ fire tests in the tunnel [1]. In total, seven CFD
simulations were conducted for a fire size of 30 MW (a bus or truck on fire). This fire represents a typical design fire size recommended for roadway tunnels that do not carry dangerous/
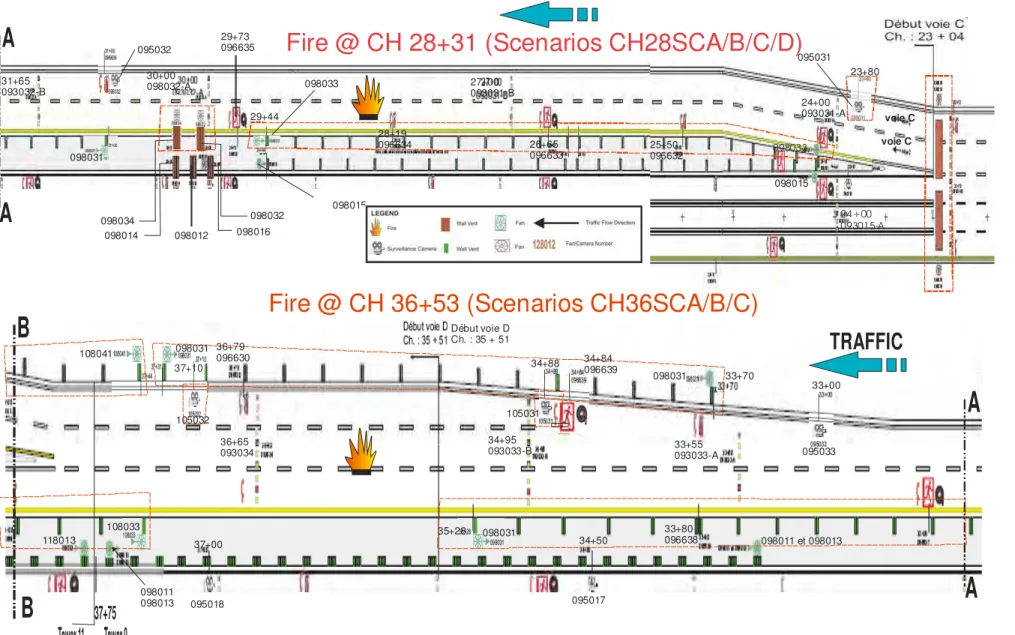
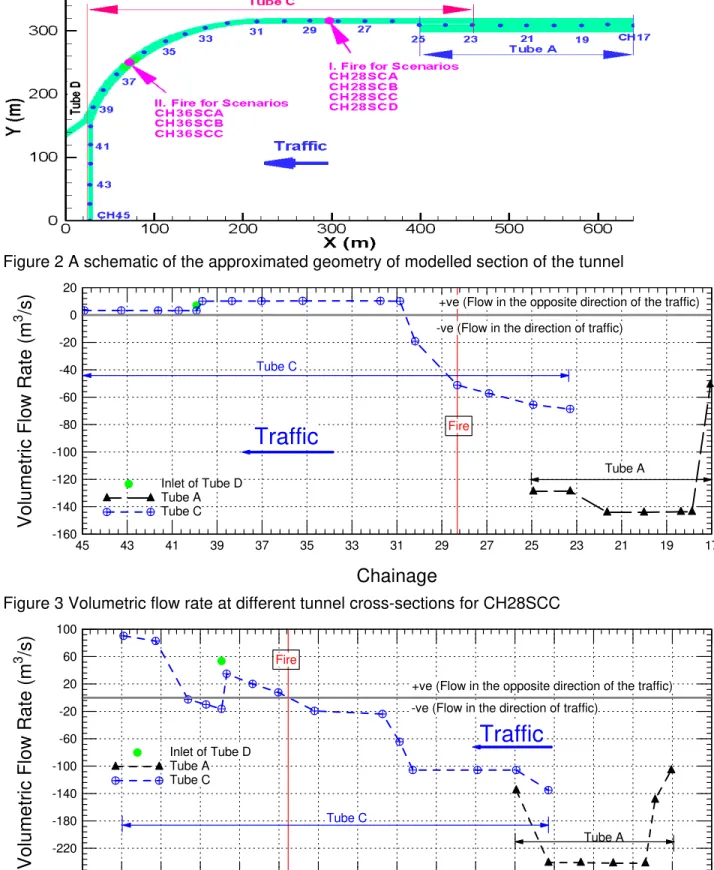
hazardous goods [3]. The first four fire scenarios represented a fire in the straight region of Tube C at CH28+31 (CH28SCA, CH28SCB, CH28SCC, and CH28SCD, see Figure 2). The other three scenarios simulated a fire in the curved region of Tube C at CH36+53 (CH36SCA, CH36SCB, and CH36SCC, Figure 2). The CPU time using the NRC-IRC cluster machine for each scenario at both CH28+31 and CH36+53 was about 10-12 days.
Ventilation vents were introduced to mimic the actual wall and ceiling vents in this section of the tunnel and in accordance with Figure 1. The boundary conditions at all portals were taken as open vents. In this case, the total pressure in the modelled section of the tunnel would be approximately equal to the atmospheric pressure. Therefore, the mass flow rate at each of these portals was calculated and its value differed from a ventilation scenario to another. The wind velocity at these portals was assumed to be zero. All seven simulations were conducted for a duration time of 900 s. The steady state conditions were achieved in all scenarios after approximately 300 s.
3 2 RESULTS
Four numerical simulations CH28SCA, CH28SCB, CH28SCC and CH28SCD were conducted representing a fire of a size of 30 MW occurring at CH28+31. The results showed that scenario CH28SCC produced the best ventilation performance. The description of the airflow, smoke propagation, visibilities and temperature distributions in the tested section of the tunnel is presented and discussed in detail for scenario CH28SCC. Because of the space limitation, the results for CH28SCA, CH28SCB, and CH28SCD are briefly summarized.
Figure 3 shows the volumetric flow rate at different cross-sections of the tunnel at the end of simulation (900 s) for scenario CH28SCC. In this scenario, ceiling fans 088011, 088013, 088015, and 088016 were activated in the supply mode, while wall fans 098032, 098033, and 098034 were activated in the exhaust mode. The ventilation scenario CH28SCD was similar to that of CH28SCC except that ceiling fan 088016 was not activated in CH28SCD. The activation of ceiling fan 088016 in CH28SCC resulted in a higher negative airflow upstream and in the vicinity of the fire than that for CH28SCD. For the four ventilation scenarios, CH28SCC resulted in the highest negative airflow in Tube C, which in turn resulted in a shorter backlayering
distance and a better visibility upstream of the fire.
The activation of the ventilation scenario CH28SCC caused the airflow to be ejected at the portals and to the rest of the tunnel section of Tube A. The ventilation scenario for CH28SCD resulted in drawing fresh airflow from the tunnel section of Tube A at CH25+00 into Tube C causing a delay in the occurrence of backlayering in Tube C. Activating wall fans 098032 and 098034 in the four scenarios significantly contributed not only in causing positive airflow downstream of the fire (see for example Figure 3 for CH28SCC) but also in removing smoke from downstream of the fire. The higher the positive airflow downstream of the fire was the more confined was the backlayering.
As indicated earlier, the ventilation scenarios CH28SCC and CH28SCD were similar except that the ceiling fan 088016 in Tube A was activated in supply mode for the former and was not activated in the latter. This resulted in a slightly lower positive airflow in CH28SCC (Figure 3) than in CH28SCD downstream of the fire after a considerable amount of time. For this reason, in the same period of time, the smoke front travels a longer distance downstream of the fire in CH28SCC than in CH28SCCD. For example, in 900 s, the smoke front traveled a distance of 395 m downstream of fire in CH28SCC (Figure 5d) versus a distance of 364 m downstream of fire in CH28SCD. In both scenarios, the length of the longest backlayering upstream of the fire was 86 m.
The CFD results for CH28SCA showed that at 41 s after fire ignition, the backlayering of smoke reached 51 m upstream of the fire, and at 684 s, the backlayering reached the entrance of Tube C (153 m upstream of the fire). In the period from 684 s until the end of simulation time (900 s), the smoke did not move beyond the entrance of Tube C. Additionally, for scenario CH28SCB, the smoke reached the beginning of the curved region of Tube C in 50 s (9 s later compared to CH28SCA) but the backlayering reached 61 m upstream of the fire, 10 m farther than that in CH28SCA. The smoke in CH28SCB reached the entrance of Tube C faster (153 m upstream of the fire) in about 347 s compared to 684 s in CH28SCA. In the period from 347 s – 900 s (end of simulation) in CH28SCB, the backlayering length did not change (smoke did not move beyond the entrance of Tube C). Scenario CH28SCC produced the shortest backlayering length upstream of the fire. However, CH28SCD was the most successful scenario in confining smoke downstream of the fire with a short backlayering length upstream of the fire.
Figure 7 compares the average visibilities at the centerline of the tunnel for the different
ventilation scenarios. In the content of this paper, the best visibility (smoke free) is represented by 30 m [1]. At each location along the tunnel, the average visibility along the centerline of the tunnel was the mean value of the visibilities at all elevations at that location. Activating ceiling fans 088016 and 088018 in the exhaust mode in CH28SCB drew the smoke from the vicinity of the fire towards the upstream of the fire, resulting in: (a) best visibility conditions downstream of the fire, (b) worst visibility conditions upstream of the fire, (c) longest backlayering upstream of the fire, and (d) best visibility conditions at the fire. Moreover, having the best visibility at the fire location means high mass fraction of oxygen, causing the combustion to be sustained at a high rate. Therefore, it is expected that the temperature, especially in the vicinity of the fire will be the highest in CH28SCB. When ceiling fan 088016 was activated in supply mode in CH28SCA, the fresh air from this fan opposed the movement of the smoke upstream of the fire, resulting in higher visibility upstream of the fire and lower visibility downstream of the fire compared to that in CH28SCB (Figure 7). Activating ceiling fans 088011/13/15 in supply mode in CH28SCC and CH28SCD resulted in a much better visibility upstream of the fire compared to that in CH28SCA and CH28SCB. Also, activating these fans caused lower visibility downstream of the fire in CH28SCC and CH28SCD compared to CH28SCA and CH28SCB.
The average temperatures in these ventilation scenarios are shown in Figure 9. It should be noted that the average temperature at each location along the centerline of the tunnel was the mean value of the temperatures at all elevations at that location. As shown in this figure, at the fire location, simulation CH28SCB had the highest average temperature (469oC), while
simulation CH28SCD had the lowest average temperature (251oC). As a result of activating ceiling fans 088011/13/15 in supply mode in CH28SCC and CH28SCD, the average
temperature downstream of the fire in simulations CH28SCC and CH28SCD was higher than that in simulations CH28SCA and CH28SCB. Meanwhile, the average temperature upstream of the fire in simulations CH28SCA and CH28SCB was higher than that in CH28SCC and
CH28SCD (Figure 9).
Three numerical simulations (CH36SCA, CH36SCB, and CH36SCC) were performed to investigate the possibilities of removing the smoke when a fire of a size of 30 MW was located in the curved region of Tube C at CH36+53. The results showed that CH36SCC produced the best ventilation performance. The CFD results for this scenario (CH36SCC) are discussed in detail and the important findings for scenarios CH36SCA and CH36SCB are briefly
summarized.
Scenario CH36SCC is similar to CH36SCB except that ceiling fans 088011/13/15 (supply mode) and wall fans 098032/34 (exhaust mode) were activated in the former, and were not activated in the latter. As shown in Figure 4, activating wall fans 098032 and 098034, which had a
considerable volumetric flow rate in the exhaust mode (85 m3/s) contributed significantly in increasing the negative airflow upstream of fire in CH38SCC. For example, at CH30+86 (173 m upstream of the fire), the negative volumetric flow rate is 105 m3/s in CH36SCC (Figure 4)
compared to only 31 m3/s in CH36SCB. Activating the ceiling fans 088011/13/15 in the supply
mode has two competing effects in backlayering and smoke removal, namely: (a) contributed in increasing the negative airflow upstream of the fire to some extent, hence producing a shorter backlayering length upstream of the fire (desirable effect), and (b) drew fresh air toward wall fans 098032/34, resulting in a decrease in the efficiency of these fans in removing the smoke (undesirable effect).
The CFD results for CH36SCA showed that activating wall fan 098031 in the supply mode, diluted the smoke to a lower concentration, but on the other hand caused the diluted smoke to
5
fill all the sections of the tunnel upstream of the fire. This phenomenon was confirmed in the in-situ fire tests. A close examination for scenario CH36SCA showed that the backlayering upstream of the fire reached the east portal of Tube A after 522 s. In CH36SCB, after 81 s, the backlayering reached CH32+81 (113 m upstream of the fire); and 95 s later (at 176 s), the backlayering moved 62 m further and reached the beginning of the curved region of Tube C (at CH30+80, 175 m upstream of the fire). In the period from 176 s – 900 s, the backlayering reached CH28+63 (241 m upstream of the fire).
Figure 6 shows the smoke propagations in CH36SCC. As shown in this figure, the smoke front reached the west portal of Tube D after 95 s from initiating the fire (Figure 6b). At 95 s, this backlayering reached CH31+30 (159 m downstream of the fire); and 18 s later (at 113 s), this backlayering moved 16 m further and reached the beginning of the curved region of Tube C (at CH30+80, 175 m upstream of the fire). At 900 s (end of simulation), the smoke front reached CH42+25 (174 m downstream of the fire) in both CH36SCB and CH36SCC. However, the backlayering in CH36SCC reached CH29+93 (201 m upstream of the fire, see Figure 6d) compared to 241 m upstream of the fire in CH36SCB. In summary, in terms of smoke movements both upstream and downstream of the fire, CH36SCC is the favourable scenario among the scenarios.
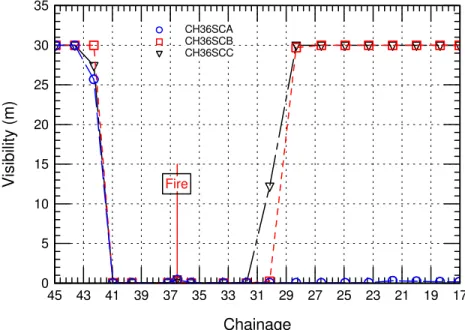
The average visibilities (mean value of the visibilities at elevations 0.1, 0.9, 1.9, 2.9, 3.9 and 4.9 m) at the centerline of the tunnel for the three ventilation scenarios are compared in Figure 8 at the end of simulation time (900 s). Unlike the fire located at CH28+31 (in the straight region of Tube C), this figure shows that there was poor visibility at the fire location for the three
ventilation scenarios of the fire placed at CH36+53 (in the curved region of Tube C). Placing a fire in the curved region of Tube C, however, caused a better mixing between the fresh air and the combustion products (due to the turbulence caused by the wall curvature) than when the fire was located in the straight region, resulting in: (a) poor visibility in the vicinity of the fire, hence lower the concentration of the oxygen and consequently lower the combustion rate, and (b) a lower peak temperature as will be shown next. As shown in Figure 8, the visibilities
downstream of the fire for the three ventilation scenarios were similar. However, CH36SCC produced the best visibility upstream of the fire. For example, at CH30+14 (195 m upstream of the fire), the average visibility in CH36SCC was 12 m compared to almost 0 m in CH36SCB and CH36SCA. Figure 8 shows that the shortest backlayering and the best visibility upstream of the fire were in CH36SCC.
The average temperatures of CH36SCA, CH36SCB, and CH36SCC are compared in Figure 10. As shown in this figure and at the fire location, CH36SCC resulted in the highest average
temperature (323 oC), while the other two simulations CH36SCA and CH36SCB produced a lower average temperature (~277 oC). The average temperature downstream of the fire in CH36SCA was slightly higher than that in CH36SCB and CH36SCC. Additionally, the average temperatures upstream of the fire in simulations CH28SCB and CH28SCC were approximately the same, and higher than that in simulation CH36SCCA for a distance from the fire of less than 160 m. For distances from the fire greater than 160 m, the average temperatures in CH28SCB and CH28SCC were lower than that in CH36SCA.
In summary, when the fire was located in the curved region of Tube C, it was observed that a good mixing between the fresh airflow and the combustion products due to the effect of
curvature of the Tube C took place. This mixing process resulted in reducing the highest peak and highest average temperatures and increasing the extent of backlayering phenomenon upstream of the fire. Consequently, having a fire accident in the curved region of Tube C, the trapped vehicles upstream of the fire would receive a lower amount of heat by radiation than if
A
A
TRAFFIC
Fire @ CH 28+31 (Scenarios CH28SCA/B/C/D)
098015 24+00 093015-A 098033 25+50 096632 26+65 096633 27+00 093031-B 28+19 096634 098033 098034 098014 098012 098032 30+00 098032-A 098016 098015 29+44 29+73 096635 098031 31+65 093032-B 24+00 093031-A 23+80 voie C voie C 095032 095031
A
A
B
B
Tower 11 Tower 9
37+75
TRAFFIC
Fire @ CH 36+53 (Scenarios CH36SCA/B/C)
33+00 095033 33+55 093033-A 33+70 098031 098011 et 098013 33+80 096638 095017 34+50 34+84 096639 34+88 105031 34+95 093033-B 35+28 098031 Début voie D Ch. : 35 + 51 36+65 093034 36+79 096630 37+10 105032 098031 108041 108033 098011 098013 118013 37+00 095018
7
Figure 2 A schematic of the approximated geometry of modelled section of the tunnel
-160 -140 -120 -100 -80 -60 -40 -20 0 20 17 19 21 23 25 27 29 31 33 35 37 39 41 43 45 Inlet of Tube D Tube A Tube C
-ve (Flow in the direction of traffic)
+ve (Flow in the opposite direction of the traffic)
Traffic
Tube A Tube C FireChainage
Volumetr
ic Flow Rate (m
3/s)
Figure 3 Volumetric flow rate at different tunnel cross-sections for CH28SCC
-260 -220 -180 -140 -100 -60 -20 20 60 100 15 17 19 21 23 25 27 29 31 33 35 37 39 41 43 45 47 Inlet of Tube D Tube A Tube C Tube A Tube C
Traffic
-ve (Flow in the direction of traffic)
+ve (Flow in the opposite direction of the traffic)
Fire
Chainage
Volumetr
ic Flow Rate (m
3
/s)
(a) Time = 0 s (a) Time = 0 s
(b) Time = 36 s (b) Time = 95 s
(c) Time = 567 s (c) Time = 113 s
(d) Time = 900 s (end of simulation) (d) Time = 900 s (end of simulation)
Figure 5 Smoke propagation for fire at CH28+31 for scenario CH28SCC
Figure 6 Smoke propagation for fire at CH36+53 for scenario CH36SCC
9 0 5 10 15 20 25 30 35 17 19 21 23 25 27 29 31 33 35 37 39 41 43 45 CH28SCA CH28SCB CH28SCC CH28SCD Fire Chainage Visi bili ty (m ) 0 5 10 15 20 25 30 35 17 19 21 23 25 27 29 31 33 35 37 39 41 43 45 CH36SCA CH36SCB CH36SCC Fire Chainage Visibi lity (m)
Figure 7 Average visibilities along the height at centerline of the tunnel for fire at CH28+31
Figure 8 Average visibilities along the height at centerline of the tunnel for fire at CH36+53
0 50 100 150 200 250 300 350 400 450 500 17 19 21 23 25 27 29 31 33 35 37 39 41 43 45 CH28SCD CH28SCC CH28SCB CH28SCA Chainage T e mp er ature ( o C) 0 50 100 150 200 250 300 350 17 19 21 23 25 27 29 31 33 35 37 39 41 43 45 CH36SCC CH36SCB CH36SCA Fire Chainage T e mper ature ( o C)
Figure 9 Average temperatures along the height at centerline of the tunnel for fire at CH28+31
Figure 10 Average temperatures along the height at centerline of the tunnel for fire at CH36+53
the accident occurred in the straight region of Tube C. On the other hand, a fire accident in the curved region of Tube C is more serious than that in the straight region of Tube C in terms of a smoke management point of view.
3 CONCLUSIONS AND RECOMMENDATIONS
Based on the fire tests [1] and the CFD simulations for a fire of a size of 30 MW located in Tube C, it is recommended that:
For a fire located in the straight part of Tube C, CH28SCD limited the extent and delayed the occurrence of the backlayering. Moreover, this scenario produced the lowest peak temperature.
In order to optimize the performance of CH28SCC, the ceiling fan 88018 of Tube C should not be activated. If this fan must be activated, dampers should be used to minimize its supply of fresh air into the tunnel section.
Large size exhaust wall vents are more effective in removing smoke and fire products. For a fire located in the curved part of Tube C, ventilation scenario CH36SCC produced the
shortest backlayering distance, although it did not eliminate smoke backlayering completely. To eliminate the smoke backlayering in the curved part, it was recommended to use ceiling
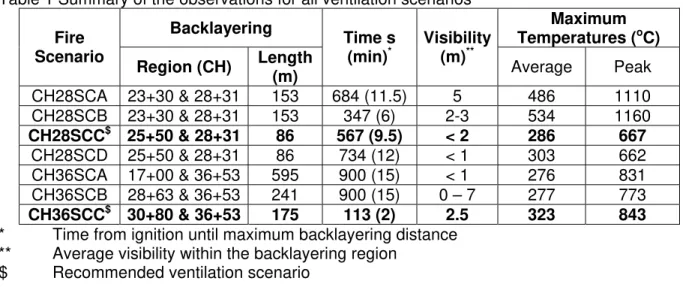
jet fan(s) to produce a proper longitudinal flow towards the west direction of Tube C. Table 1 Summary of the observations for all ventilation scenarios
Backlayering Maximum Temperatures (oC) Fire Scenario Region (CH) Length (m) Time s (min)* Visibility (m)** Average Peak CH28SCA 23+30 & 28+31 153 684 (11.5) 5 486 1110 CH28SCB 23+30 & 28+31 153 347 (6) 2-3 534 1160 CH28SCC$ 25+50 & 28+31 86 567 (9.5) < 2 286 667 CH28SCD 25+50 & 28+31 86 734 (12) < 1 303 662 CH36SCA 17+00 & 36+53 595 900 (15) < 1 276 831 CH36SCB 28+63 & 36+53 241 900 (15) 0 – 7 277 773 CH36SCC$ 30+80 & 36+53 175 113 (2) 2.5 323 843 * Time from ignition until maximum backlayering distance
** Average visibility within the backlayering region $ Recommended ventilation scenario
ACKNOWLEDGMENTS – The authors acknowledge the NRC researchers and technical staff and the staff of the Ministère des Transports du Québec who contributed immensely to
conducting the successful in-situ tests. 4 REFERENCES
1. Kashef, A., Saber, H. H., Gao, L., Bénichou, N., Lougheed, L., Carpenter, D., Crampton, G., Leroux, P., Verification of Ventilation Strategies of the Ville-Marie Tunnel West Direction, Tube C in Proximity of Towers 8, 9, and 10, June 2007.
2. McGrattan, K. B., Baum, H. R., Rehm, R. G., Forney, G. P., Floyd, J. E., Hostikka, S., Fire Dynamics Simulator (Version 4), Technical Reference Guide (Technical Report NISTIR 6783), National Institute of Standards and Technology, Gaithersburg, Maryland, Sep. 2003.
3. National Fire Protection Association, "NFPA 502 Standard for Road Tunnels, Bridges, and Other Limited Access Highways", 2001 Edition, NFPA, Quincy, MA.