Water loss regulation in mature Hevea brasiliensis: effects of
intermittent drought in the rainy season and hydraulic regulation
Supat Isarangkool Na Ayutthaya
1,7, Frederic C. Do
2, Krirk Pannangpetch
1, Junya Junjittakarn
1,
Jean-Luc Maeght
3, Alain Rocheteau
4and Herve Cochard
5,61Faculty of Agriculture, Khon Kaen University, Khon Kaen 40002, Thailand; 2IRD, UMR Eco&Sols, SupAgro-INRA, Montpellier F-34060, France; 3IRD, UMR BIOEMCO, IWMI-NAFRI,
Vientiane, Lao PDR.; 4IRD, CEFE-CNRS, Montpellier F-34060, France; 5INRA, UMR 547 PIAF, Clermont-Ferrand F-63100, France; 6Clermont Université, Université Blaise Pascal,
UMR 547 PIAF, BP 10448, Clermont-Ferrand F-63000, France; 7Corresponding author (isupat@kku.ac.th)
Received November 13, 2010; accepted May 17, 2011; published online July 11, 2011; handling Editor David Whitehead
Effects of soil and atmospheric drought on whole-tree transpiration (ET), leaf water potential (ψL) and whole-tree hydraulic conductance (KT) were investigated in mature rubber trees (Hevea brasiliensis, clone RRIM 600) during the full canopy stage in the rainy season in a drought-prone area of northeast Thailand. Under well-watered soil conditions, transpiration was tightly regulated in response to high evaporative demand, i.e., above reference evapotranspiration (ET0) ~2.2 mm day−1 or maximum vapor pressure deficit ~1.8 kPa. When the trees experienced intermittent soil drought ET decreased sharply when relative extractable water in the top soil was < 0.4. The midday leaf water potential (ψmd) on sunny days did not change as a function of soil drought and remained stable at approximately − 1.95 MPa, i.e., displaying isohydric behavior. The decrease in ET was mainly due to the change in KT. KT remained constant over a wide range of environmental conditions and decreased sharply at low soil water availability. A simple hydraulic model incorporating critical minimum water potential and the response of whole-tree hydraulic conductance to relative extractable water correctly simulated patterns of transpiration over 6 months. We conclude that an explicit and simplified framework of hydraulic limitation hypothesis was sufficient to describe water use regulation of a mature rubber tree stand in water-limited conditions. Given the complexity of constraints in the soil–plant–atmosphere pathway, our results confirm the relevance of this approach to synthesize the overall behavior of trees under drought.
Keywords: critical transpiration, evaporative demand, leaf water potential, rubber tree, soil drought, water relations, whole-tree hydraulic conductance.
Introduction
Plants respond to drought by reducing transpiration through stomatal closure to prevent excessive water deficit in their tis-sues. However, this regulation occurs at the cost of reduced CO2 supply, photosynthesis and primary productivity. Hence, the plant’s dilemma is to maximize carbon gain while minimizing water loss (Eamus and Prior 2001). This complex trade-off probably explains why considerable attention is currently being paid to measuring and modeling transpiration in response to drought. Among the models of water transfer in the soil–plant– atmosphere continuum, plant-based models are of particular
interest because they investigate the internal processes of reg-ulation and may include traits that can be used for genetic screening (Williams et al. 1996, Sperry et al. 1998, Damour et al. 2010). The plant hydraulic approach provides a sound framework to analyze the effects of soil and atmospheric drought on transpiration (Cruiziat et al. 2002, Sperry et al. 2002). As a physical process, tree transpiration (ET) is deter-mined by the evaporation of water molecules in the substomatal cavity of leaves. Hence, ET is first determined by evaporative demand, which is defined by climatic variables like solar radia-tion or vapor pressure deficit (VPD). Climatic demand combined
Research paper
with stand evaporative characteristics sets an upper physical limit (Eclim) to ET. ET may equal Eclim when Eclim is relatively low, for instance on cloudy rainy days. But there are a number of situations in which Eclim largely overestimates ET. Hence, several authors have reported that even under well-watered soil condi-tions plants exhibit tight stomatal regulation of ET under high climatic demand (Oren et al. 1999, David et al. 2004, Bovard et al. 2005, Oguntunde et al. 2007, Bush et al. 2008). The decline in transpiration under low soil water availability is a more well-known process (Sinclair 2005, Breda et al. 2006). Transpiration generally declines at between 0.5 and 0.3 of rela-tive transpirable or extractable water (REW). Water transport in trees behaves like the transport of water in a plumbing system and can be efficiently modeled using a simple hydraulic analogy in which flows are proportional to pressure gradients, the coef-ficient of proportionality being analogous to a hydraulic resis-tance (Van den Honert 1948, Tyree and Zimmermann 2002):
ΨS ΨL T T T
T
− =E ×R = EK (1)
where ψS is the soil water potential, ψL is the leaf water poten-tial, and RT and KT are the hydraulic resistance and conduc-tance of the whole-sap pathway, respectively. The gravitational potential due to tree height is neglected here. ψL is a key physi-ological parameter with marked direct and indirect impacts on ET. Direct effects of ψL on ET can be caused by its impact on leaf turgor (Cochard et al. 2002) or on the interaction between stomatal sensitivity and abscissic acid (ABA; Tardieu and Simonneau 1998). Indirect effects include the correlation between ψL and the xylem water potential, and its relationship with xylem cavitation (Sperry et al. 1998, Cochard et al. 2002). Whatever the mechanisms, experimental data suggest that many tree species tend to adjust their transpiration rate, main-taining midday ψL above a critical value (ψcrit). Plants with iso-hydric tendency exert tight stomatal control of transpiration (Tardieu and Simonneau 1998, Bucci et al. 2005, Franks et al. 2007, West et al. 2007). They operate over a short range of leaf water potential and exhibit a relatively high (less negative) ψcrit independently of soil water and atmospheric constraints. Conversely, plants with anisohydric tendency exert less strict stomatal control. They operate over a larger range of leaf water potential where midday ψL significantly decreases as a function of increasing soil drought. As a result, no discernable ψL thresh-old is observed.
Under the hydraulic limitation hypothesis (Jones 1998, Sperry et al. 1998) and according to Eq. (1), it is possible to compute a critical transpiration rate (Ecrit) corresponding to ψcrit:
Ecrit =(ΨS−Ψcrit)×KT (2) Hence, Ecrit sets a functional limit on ET that can be reached under drought conditions (low ψS and low KT values) but also
when the evaporative demand is very high. A decrease in KT as a function of soil water availability (REW) or predawn ψL (ψpd) has been demonstrated in several tree species (Cochard et al. 1996, Lu et al. 1996, O’Grady et al. 2008, Domec et al. 2009). By combining the limiting effects of Eclim and Ecrit on tree tran-spiration, it is possible to construct a simple model for ET (Cruiziat et al. 2002):
ET =Min(Ecrit;Eclim) (3) This model provides an explicit and simplified framework for the hydraulic limitation hypothesis at the whole-tree scale. Complex plant hydraulic models that separate different compo-nents in the soil–plant–atmosphere pathway and/or in the plant itself, and may include vulnerability curves, have been devel-oped (Williams et al. 1996, Sperry et al. 1998, Cochard et al. 2002). However, parameterization of these comprehensive models is difficult. Simplified approaches considering only whole-plant hydraulic conductance and isohydric behavior have been successfully used to predict regulation of transpiration as a function of atmospheric (Oren et al. 1999) and soil drought (Duursma et al. 2008). An explicit framework of the hydrau-lic limitation hypothesis has rarely been applied in tropical conditions (Fisher et al. 2006).
The general objective of this study was thus to test the sim-plified framework described above in H. brasiliensis (rubber tree), a species of great economic importance in South East Asia and native to wet tropical forests in Amazonia. To benefit from the increasing demand for natural rubber, the cultivation of H. brasiliensis has been extended to drought-prone areas like those in the southern part of northeast Thailand. In this area, rubber trees experience soil and atmospheric drought in both wet and dry seasons. Several authors have studied the influence of soil and atmospheric drought on the water rela-tions of mature rubber trees (Chandrashekar et al. 1990, Gururaja Rao et al. 1990, Chandrashekar 1997), but they focused on the absolute comparison of variables between the dry season and the wet season and on the relationships with latex yield. Two studies on young potted trees provided inter-esting insights about hydraulic limitation (Ranasinghe and Milburn 1995, Sangsing et al. 2004). Firstly, both teams found low xylem tension values corresponding to 50% of embolism in the petioles (between −1.5 and −2.0 MPa), suggesting that the rubber tree is rather vulnerable to cavitation. Secondly, Sangsing et al. (2004) found that stomatal control operates at the onset of xylem embolism in the petiole, suggesting isohy-dric behavior.
For the present study, we selected a mature representative rubber tree stand containing the most widely planted clone in South East Asia. The stand was located in the southern part of northeast Thailand where trees are regularly exposed to soil and atmospheric drought in the full canopy stage during the
rainy season. We had four specific objectives. The first was to assess the response of whole-tree transpiration to intermittent drought in the rainy season—we hypothesized that responses to both atmospheric and soil drought would have specific thresholds. The second objective was to study the operational range of ψL under soil and atmospheric drought conditions— we hypothesized that midday values would be relatively stable on sunny days, demonstrating isohydric behavior. The third objective was to analyze the concurrent change in whole-tree hydraulic conductance: we expected this change to mainly explain the decrease in transpiration. The fourth objective was to test the ability of a simple hydraulic limitation model, based on (i) whole-tree hydraulic conductance (sensitive to soil drought) and (ii) a critical minimum leaf water potential, to sim-ulate the main changes in transpiration.
Materials and methods
Field site and plant material
The experiment was conducted in a monoclonal plot of RRIM600, planted at 2.5 m × 7.0 m spacing and tapped for 4 years. The plantation is located at Baan Sila (N15°16′23″ E103°04′51.3″), Khu-Muang village, Buriram province, north-east Thailand. The soil is a deep loamy sand. Mean content of clay, silt and organic matter varied from 9.9, 24.2 and 0.78% in the topsoil (0–20) to 20.2, 23.6 and 0.34% at a depth of 1.5 m, respectively. In this new plantation area, the environ-mental conditions are water limited for H. brasiliensis. The rainy season lasts ~6 months (May to October), and annual rainfall averages 1176 mm. Six representative trees were selected. Their trunk girths, measured at 1.50 m above the soil, varied from 43.3 to 58.3 cm (average: 52.5 cm). The maximum leaf area index, measured using nine 1 m2 litter traps during defo-liation (December–January–February), was estimated at 3.9 (SD = 0.7).
Climatic measurements
The local microclimate was monitored automatically in an open field, at a distance of 50 m from any trees. A datalogger (Minimet automatic weather station, Skye Instruments Ltd, Llandrindod Wells, UK) recorded half-hourly values of air tem-perature, relative humidity, incoming short wave radiation, wind speed and rainfall. The reference evapotranspiration (ET0) was calculated according to Allen et al. (1998).
Soil water content measurements
Volumetric soil water content (θ) was measured with a neu-tron probe (3322, Troxler, Research Triangle Park, NC, USA) calibrated for the experimental soil with separate calibrations for upper (0–0.2 m) and lower (below 0.2 m) layers. Twelve tubes 2 m long were set up in pairs; of each pair, one tube was located in the planting line between two trees, and the
other in the middle of the inter-row. Measurements were made every 0.2 m, from a depth of 0.1 to 1.7 m every 2 weeks from May to October 2007. Based on observed fluctuations in soil water, the soil profile was separated into two layers, topsoil (0–0.4 m) and subsoil (0.4–1.8 m). Average field capacity and permanent wilting points were estimated at 0.20 and 0.07 m3 m−3 for the topsoil, and 0.25 and 0.10 m3 m−3 for the subsoil, respectively (Isarangkool Na Ayutthaya et al. 2010). Additionally, θ was measured continuously with a capacitance probe (EnvironSCAN System, Sentek Sensor Technologies, Adelaide, South Australia, Australia) placed in a single tube close to a tube used for neutron probe measurements. The vertical probe included nine sensors located every 0.2 m at the same level as the neutron probe measurements. For each sensor, θ was estimated from cross-calibration with the neu-tron probe measurements over the whole seasonal range. To estimate continuous changes in the average soil water profile, linear regressions were performed between θ of the average soil water profile (12 neutron probe access tubes) and θ of the profile continuously measured with the capacitance probe. For the previously defined topsoil and subsoil layers, R2 of linear regressions was 0.89 and 0.76, respectively. Relative extractable soil water was calculated according to Breda et al. (2006).
Leaf water potential measurement
Leaf water potential was measured on the six instrumented trees with a Scholander-type pressure chamber (PMS 1000, PMS Instrument Company, Albany, OR, USA). Two trifoliate leaves with their petioles were taken from sunny locations on each experimental tree. ψL measurements were performed in situ immediately after cutting. ψL was measured regularly once or twice per month, ψpd between 5:30 and 6:15 a.m. and mid-day leaf water potential (ψmd) between 12:30 and 1:30 p.m. Additionally, ψL was measured daily every 1–2 h from predawn to sunset in four contrasting periods of soil water content. Xylem sap flow measurements and tree transpiration calculation
Xylem sap flow density was measured using the transient ther-mal dissipation method (TTD, Do and Rocheteau 2002, Isarangkool Na Ayutthaya et al. 2010). The TTD method is based on the same Granier’s probe design and heating power but uses a cyclic schedule of heating and cooling to assess a transient thermal index over a 10-min rise in temperature. This measurement system limits the influence of passive tempera-ture gradients and saves electrical energy. The hourly sap flux density (Js; kg m−2 h−1) was calculated according to the non-species-specific calibration assessed by Isarangkool Na Ayutthaya et al. (2010):
Js =12 95. ×Ka×102 (4)
where Ka is a transient thermal index (dimensionless). A tem-perature signal (ΔTa) was defined as
∆Ta = ∆Ton−∆Toff (5) where ΔTon is the temperature difference reached at the end of the 10-min heating period and ΔToff is the temperature dif-ference reached after 10 min of cooling. To measure Js every half hour with a heating period of 10 min, a cycle of 10 min heating and 20 min cooling was applied and the temperature signals were recorded every 10 min. Our previous experi-ments showed that averaging ΔToff values (before 10 min of heating and after 10 min of cooling) improves measure-ment accuracy. This interpolation of ΔToff at the time of ΔTon measurement likely reduces sensitivity to rapid changes in natural thermal gradients. The transient thermal index was calculated as
Ka =(∆T0a −∆Tua) /∆Tua (6) where ΔT0a is the maximum temperature difference obtained under zero flow conditions and ΔTua is the measured signal at a given Js. The zero flux signal was determined every night assuming that sap flow was negligible at the end of the night. Our assumption was based on two facts. Firstly, the nocturnal VPD (measured when ΔTmax was recorded) was never greater than 0.3 kPa. Secondly, the slight changes in ΔTmax over the 6-month period (variation coefficient = 1.7%) were not correlated with VPD. Probes were inserted into the trunks at a height of 1.8 m above the soil. At this height, average sapwood area was estimated to be 1.97 × 10⁻² m2. After removal of the bark, the 2-cm-long probes were inserted to a depth of 2.5 cm into the sapwood, in such a way that the whole probe was fully inside the conductive sapwood. Three probes were inserted into each trunk to account for circum-ferential variability. After the probe was inserted, the exposed parts of the needles were coated with silicone. The trunk area containing the probes was protected from direct solar radia-tion and rainfall by a deflector. Probes were connected to a datalogger (CR10X, Campbell Scientific, Leicester, UK). Hourly sap flow density (Js), measured in the outermost ring of the sapwood, was accumulated over 24 h to calculate daily Js (Jout_day expressed in kg m−2 day−1). To account for radial variation in sap flux density in the deep sapwood, a reduction coefficient of 0.874 was applied to the Js measured in the outermost ring of conducting xylem (Isarangkool Na Ayutthaya et al. 2010). Finally, neglecting tree water storage, ET (mm day−1) was estimated according to the equation
ET Jout_day sapwoodarea/
tree spacingarea =0 874 10. × −2 × ×
(7)
Whole-tree hydraulic conductance
The whole-tree hydraulic conductance specific to sapwood area (KT) was calculated from concurrent measurements of sap flux density and leaf water potential following Eq. (1). The multi-point method plotted the diurnal changes in ψL versus Js, the slope of the assumed linear relationships representing the hydraulic resistance, the reverse of the hydraulic conductance. The single-gradient method applied the simplified formula described below (Cochard et al. 1996):
KT = Jmax/(Ψpd−Ψ md) (8) where Jmax is the maximum sap flux density (kg m−2 h−1) mea-sured around midday, and ψpd and ψmd are predawn and mid-day leaf water potentials, respectively.
Hydraulic limitation model of water loss
The basis of the model used was similar to the models developed by Tyree and Sperry (1988) and Sperry et al. (1998). Named ‘Ecrit_Eclim’, it was developed in Microsoft Office Excel. It is based on the following simple equation (Cochard et al. 1996, 2002):
Jcrit =KT(Ψpd−Ψ crit) (9) where Jcrit is the critical maximum sap flux density and ψcrit is the critical leaf water potential. Next, the maximum sap flux density was estimated daily according to the following equation:
Jmax =KT(Ψpd−Ψ crit) (10) where KT and ψpd were both estimated daily from relationships with REW (input data). ψcrit was assumed to remain stable with the same value for the whole rainy season.
Hence, in this simplified approach, it is assumed that ψmd and Jmax reached ψcrit and Jcrit every day. Jout_day was then deduced from its strong linear relationship with Jmax (R2 = 0.94, n = 432, P < 0.0001) according to the following equation:
Jout_day =7 8216. ×Jmax (11) Finally, Ecrit was calculated from Jout_day according to Eq. (7). Ecrit defines a maximum value of daily transpiration due to hydraulic limitations; however, this value may not be reached due to low evaporative demand. Hence, the final modeling step was to select the minimum value between Ecrit and Eclim accord-ing to Eq. (3). It was assumed that Eclim (the upper physical limitation of transpiration of the stand) is proportional to ET0. Table 1 summarizes the model parameters and units. The whole data set of ET measured by sap flow covered 162 days. The model was parameterized with the 16 days of ψL measure-ments. The remaining days (146 days) were used to test model performance.
Statistical analyses
Soil drought effects on ψmd, ψpd, KT were analyzed as a two-way analysis of variance (XLSTAT, Addinsoft, Paris, France). Model factors were: trees (repeated measurement on the same six trees) and soil drought intensity (well-watered, mild drought, severe drought) according to thresholds of REW as described below in the Results. Normality distribution and variance homogeneity were checked. For ψpd, a Box–Cox transformation was applied to restore normality. Post hoc comparisons of means were performed using the Tukey test. Drought effects were also analyzed using regressions, which were performed with SPSS 11.5 (SPSS Inc., New York, NY, USA) and Sigmaplot 10.0 (Systat Software, Inc., Chicago, IL, USA). For the hydraulic model, measured ET and estimated ET were compared using the root mean square error (RMSE) according to the formula
RMSE =
∑
=(
x −x)
n i i i n 1 2 2 1 , , (12)where x1,i is measured ET and x2,i is estimated ET, and n is the number of estimated ET values.
Results
Environmental conditions and seasonal changes
In 2007, the rubber trees in the plantation we studied were at the full canopy stage from May to November. Rainfall occurred from mid-April to October. Cumulative rainfall (960 mm) was 20% below the long-term average for this area. After the onset of the rainy season, several spells of drought, i.e., periods of 10–20 days without significant rainfall, occurred in May, June, July and September (Figure 1a). During the rainy season, ET0 varied markedly from 0.43 to 4.17 mm day−1. The values were relatively high in the first part of the rainy season from May to July (i.e., above 2 mm day−1) and again at the end of the rainy season in October (Figure 1a).
Transpiration
Daily transpiration (ET) showed remarkable features over the rainy season (Figure 1a). Firstly, there were recurring stable values of ~2 mm day−1 (maximum = 2.38 mm day−1), when transpiration did not follow the increase in ET0. Secondly, there were dramatic decreases to 0.32 mm day−1 (>80%) in June and July. This period combined low rainfall and high ET0. Some decreases in transpiration could also correspond to days with rainfall and low ET0 (Figure 1a).
Soil drought
Volumetric soil water content (θ) in the topsoil (0–0.4 m) also underwent marked variation, with a continuous decrease from May to July (Figure 1b). Values ranged from 0.26 to 0.08 m3 m−3, the minimum being reached at the same time as minimum transpiration (Figure 1a). In contrast, in the sub-soil (0.4–1.8 m) θ remained low at ~0.11 m3 m−3, except for a slight increase in October after high rainfall. REW estimated from continuous soil water data (capacitance probe) con-firmed the very low water availability in the subsoil (<0.2 REW) except in October (Figure 1c). Above all, it revealed the severity of the soil drought in the topsoil from the begin-ning of June to the end of July, with ~60 days <0.5 REW. According to REW in the topsoil, three periods were sepa-rated: well-watered (May and August to October), REW above 0.5; mild drought (beginning of June to early July), REW fluctuating at ~0.3; severe drought (mid-end July), REW fluctuating at ~0.15.
Leaf water potential and whole-tree hydraulic conductance
Predawn leaf water potential differed between the three periods of contrasting REW (P < 0.001). ψpd ranged between −0.32 and −0.44 MPa in the well-watered period (Figure 1d, aver-age −0.38 MPa). It decreased to between −0.47 and −0.54 MPa in the mild drought period (P < 0.001) and reached −0.83 MPa in the peak drought period (P < 0.001). In contrast, ψmd did not differ according to soil drought intensity (P = 0.603). It ranged from −1.21 to −1.84 MPa when ET0 was < 2.2 mm day−1 (aver-age −1.60 MPa), and from −1.57 to −2.27 MPa when ET0 was > 2.2 mm day−1 (average −1.93 MPa). K
T calculated with the single gradient method differed according to soil drought inten-sity (P < 0.001). It averaged 1.63 × 10² kg m−2 h−1 MPa−1 in the well-watered period and decreased to 1.47 × 10² kg m−2 h−1 MPa−1 in the mild drought period (P < 0.05). At the peak of soil drought, the decrease reached 50% (P < 0.001): KT equaled 0.79 × 10² kg m−2 h−1 MPa−1 on July 25 (Figure 1d).
Transpiration responses to atmospheric and soil drought The relationship between ET and ET0 showed that in well- watered conditions and low evaporative demand, transpiration followed ET0 along the 1:1 line (Figure 2), i.e., a proportionality Table 1. Summary of the parameters of the Ecrit_Eclim model. Daily tree
transpiration (ET) is expressed per ground unit in mm day−1 (i.e., kg of
water per day and square meter of ground). Hourly sap flux density is expressed per unit of sapwood area.
Symbol Name Unit
ET Tree transpiration mm day−1
Ecrit Critical tree transpiration mm day−1
Eclim Climatic potential transpiration of
the stand mm day
−1
REW Relative extractable soil water Dimensionless Jmax Maximum sap flux density kg m−2 h−1
Jout_day Daily sap flux density kg m−2 day−1
ψcrit Critical minimum leaf water potential MPa
ψpd Predawn leaf water potential MPa
KT Whole-tree hydraulic conductance kg m−2 h−1 MPa−1
of 1 between Eclim and ET0 for this stand. Above an ET0 thresh-old of between 2 and 2.2 mm day−1, the relationship revealed tight regulation of transpiration.
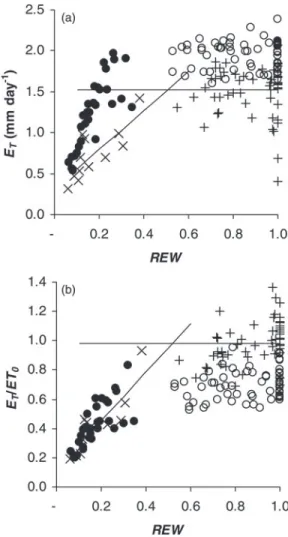
The analysis of transpiration change versus soil drought revealed no significant slope above 0.5 REW (Figure 3a and b). With non-saturating conditions of ET0 (<2.2 mm day−1), relative transpiration (ET/ET0) ranged between 0.69 and 1.36 with an average close to 1 (0.98). Below 0.5 REW, there was a significant linear decrease in relative transpiration (R2 = 0.65, P < 0.0001, Figure 3b). Based on the intersection of the decreasing line and the plateau at high REW, the REW thresh-old was ~0.5. However, this estimate is approximate due to the lack of soil data between 0.4 and 0.5 REW. Finally, relative
transpiration decreased by 40% at REW ~0.3 (mild drought) and by 80% at REW ~0.1, i.e., peak drought. In addition, the relationship between ψpd and REW confirmed a highly signifi-cant effect of soil drought on ψpd, whose maximum value was estimated at −0.375 MPa (Figure 4). The previous threshold of 0.5 REW for the onset of the decrease in transpiration corresponds to a ψpd value of −0.45 MPa.
Diurnal kinetics
Bi-hourly kinetics of ET and ψL were compared using four sunny days with contrasting soil drought conditions (Figure 5): onset (23 May, REW = 0.90), mild drought (11 July, REW = 0.24), peak drought (25 July, REW = 0.08) and recovery Figure 1. Changes in environmental conditions and tree water functioning in the rainy season in a mature rubber tree plantation in northeast Thailand. (a) Rainfall, reference evapotranspiration (ET0) and whole-tree transpiration (average of six trees) deduced from sap flow measurement
(ET). (b) Volumetric soil water content (θ) in the topsoil and subsoil, measured with neutron probes and continuous recordings with capacitance
probes (CP). (c) Relative extractable water (REW) in topsoil and subsoil. (d) Predawn (pd) and midday (md) leaf water potential and whole-tree hydraulic conductance (KT). The vertical bars indicate the confidence interval with 95% probability.
(22 August, REW = 0.82). Daily ET0 varied significantly between 2.23 and 3.71 mm day−1. In well-watered conditions, ET exhibited a classical pattern that tracked the increase in ET0 and reached a maximum around midday. Due to the effect of transpiration on leaf dehydration, ψL reached its highest value predawn, its lowest value around midday and then increased up to the end of daytime (Figure 5). It was notable that maxi-mum transpiration decreased from 0.23 to 0.08 mm h−1 as a function of the intensity of soil drought, but reached 0.22 mm h−1 again during the recovery period. The curves of diurnal ET and ψL were particularly flat during the drought period (Figure 5b and c). ψmd did not change significantly, ranging from −1.73 to −1.88 MPa. In contrast, ψpd decreased from −0.34 to −0.83 MPa, as shown previously. Moreover, soil drought decreased ψL at sunset, thus preventing hydration recovery at the end of daytime, which occurred in well-watered conditions (Figure 5).
KT multi-points
Diurnal ψL plotted against hourly Js revealed significant linear relationships (P < 0.001, Figure 6) in which the slopes repre-sent the reverse of KT. The linear shape supports the hypothe-sis that the effect of water storage (capacitance) was negligible at the daily scale. It confirms the validity of the single-gradient method, which uses only the gradient between ψpd and ψmd, versus Jmax to calculate seasonal KT (Figure 1d). Figure 6 shows the three periods of varying soil drought. It is notable that both y intercepts and slopes tend to decrease as a function of drought intensity. Compared with well-watered conditions, the slope differed significantly at peak drought (P < 0.05) but not in mild drought conditions.
Figure 2. Relationship between tree transpiration (ET; average of six
trees) and reference evapotranspiration (ET0) in a well-watered period
(REW > 0.5) with ET0 ≤ 2.2 mm day−1 (open circle), a well-watered
period when ET0 was higher than >2.2 mm day−1 (closed circle), a
mild-drought period (REW ranged from 0.2 to 0.5: cross), and a severe-drought period (REW <0.2: closed square). The dotted line represents the 1:1 reference.
Figure 3. Tree transpiration versus REW in topsoil, (a) absolute value (ET)
and (b) value relative to ET0 (ET/ET0). The circles (open or closed)
repre-sent saturating conditions of evaporative demand (ET0 > 2.2 mm day−1);
pluses and crosses represent non-saturating conditions. The dotted line represents the average ET/ET0 above 0.5 REW and in
non-saturat-ing conditions of evaporative demand, and the solid line represents the trend below 0.5 REW.
Figure 4. Predawn leaf water potential (ψpd) versus REW in the topsoil.
The vertical bars represent the standard deviation for six trees, and ** indicates a highly significant correlation with 99% probability.
KT versus REW
As suggested in Figure 1d, plotting of ET against KT showed that the decrease in daily ET was mainly explained by the change in KT, which followed a linear response (ET = 1.063 × 10⁻² KT, R2 = 0.84, data not shown). However, intermediate data were missing to get reliable statistics on the relationship. The decrease in KT under the effect of soil drought was confirmed by the highly significant relationship with decreasing REW (Figure 7, R2 = 0.89, P < 0.001). However, KT remained constant at its maximum value over a wide range of REW. According to the exponential function, the maximum value of whole-tree hydraulic conduc-tance (KTmax) was estimated at 1.625 × 10² kg m−2 h−1 MPa−1. Hydraulic limitation model
Firstly, ψcrit was estimated according to Eq. (9) using the 16 days of ψL measured on six trees (n = 96); −1.95 MPa provided
the best adjustment between Jcrit and Jmax with a slope not differ-ent from 1 (R2 = 0.980, RMSE = 0.31). Secondly, to simulate E
T over the 6-month study period, the courses of REW and ET0 were used as input data for the model. The model used the rela-tionships in Figures 4 and 7 to estimate ψpd and KT, respectively. Equation (10) was used to calculate Jmax with ψcrit. Jout_day was deduced from Jmax using Eq. (11). Equation (7) was then used to calculate Ecrit. Eclim was deduced from ET0 with a proportionality of 1 according to Figure 2. The final step selected the lowest value between Ecrit and Eclim to estimate ET. This simple Ecrit_Eclim model satisfactorily simulated the main changes in transpiration over the 6-month period (Figure 8, R2 = 0.78, RMSE = 0.22): the saturation in the case of high ET0 in well-watered conditions, the effect of soil drought in June and July, and the decreases related to low ET0 in well-watered conditions. In the details, several inaccuracies were revealed: the decline in June and July was Figure 5. Diurnal kinetics of reference evapotranspiration (ET0; open circle), tree transpiration (ET; closed circle) and leaf water potential (ψL;
closed square) for rubber trees in four periods of contrasting REW in the topsoil: (a) onset (REW = 0.90; 23 May 2007), (b) mild drought (REW = 0.24; 11 July 2007), (c) severe drought (REW = 0.08; 25 July 2007) and (d) recovery (REW = 0.82; 22 August 2007). The vertical bars with ET and ψL dots represent the standard deviation of six trees. The horizontal line intersecting the ψL axis shows the estimated value of critical
midday leaf water potential.
underestimated, and maximum ET was slightly underestimated in May and overestimated in October (Figure 8).
Discussion
Response of transpiration to soil and atmospheric drought Our results demonstrate a transpiration response to both atmo-spheric drought and soil drought with critical thresholds. Firstly,
a critical ET0 inducing tight regulation of transpiration despite well-watered soil conditions was observed between 2.0 and 2.2 mm day−1. These values corresponded to a maximum VPD of 1.6 and 1.8 kPa, respectively. The maximum ET measured was ~2.4 mm day−1 and corresponded to J
s per sapwood area close to 3 × 10² kg m−2 h−1. Surprisingly, this is the first time that tight regulation of daily transpiration over a certain thresh-old of evaporative demand has been assessed in rubber trees. However, continuous recordings of rubber ET with sap flow measurement are very rare. The data of Gururaja Rao et al. (1990) for mature rubber trees in India did not support saturat-ing transpiration under high evaporative demand. They found high transpiration in the dry season: between 3.5 and 4.5 mm, depending on the clone, the relative transpiration ET/ET0 being close to 1. However, in their study, transpiration was directly measured by a porometer, which could have led to consider-able overestimation. Moreover, the clones studied, RRII 105 and RRII 118, also differ from RRIM 600 and comparative stud-ies revealed significant clonal variability of water response to soil and atmospheric drought (Chandrashekar 1997). In other species, several studies mention the saturation of transpiration at high evaporative demand. The thresholds of critical evapora-tive demand quoted are within a similar range of VPD, i.e., between 1.0 and 2.0 kPa (David et al. 2004, Bovard et al. 2005, Bush et al. 2008). In our study, the transpiration response of RRIM 600 clone to high evaporative demand sug-gests conservative stomatal behavior that may reduce growth and productivity in the short term but enhances long-term sur-vival. Like other authors (Silpi et al. 2006), we observed with this clone complete cessation of growth at the onset of the dry season (unpublished data). In addition, results showed that soil drought in the rainy season led to a large decrease in ET. The threshold of 0.4–0.3 REW for a marked decrease in transpira-tion was close to the range quoted by Sinclair (2005) and Breda et al. (2006).
Operational range of leaf water potential and isohydric behavior
Our results showed relative stability of ψmd on sunny days. ψmd values ranged between −1.8 and −2.2 MPa on sunny days and did not decrease during soil drought. The average value was −1.93 MPa. Such a pattern expresses isohydric behavior, which maintains leaf hydration above a critical ψmd by means of sto-matal closure (West et al. 2007). Such behavior appears to be consistent with the observation of tight regulation of transpira-tion when evaporative demand is high. Our range of ψmd is in agreement with previous results in India (Gururaja Rao et al. 1990, Chandrashekar 1997). In contrast, the results of Chandrashekar et al. (1990) suggested anisohydric behavior when ψmd decreased from −1.3 MPa in the wet season to −1.8 MPa in the dry season. However, we are not sure that this comparison refers to similar sunny days, and the difference Figure 6. Diurnal relationships between leaf water potential (ψL) and
sap flux density (Js) for three periods of contrasted relative extractable
water: well-watered (pooling onset and recovery periods, open circle), mild drought (open square) and severe drought (closed circle). Each data point is the average of six rubber trees. The upper and lower bounds of the confidence intervals of slopes and Y intercepts with 95% probability are respectively (−0.61, −0.44) and (−0.63, −0.36) for well-watered conditions, (−0.81, −0.48) and (−0.92, −0.51) for mild drought, and (−1.50, −0.56) and (−1.28, −0.84) for severe drought. The vertical and horizontal bars represent standard errors. The horizontal dashed line intersecting the ψL axis shows the
esti-mated value of critical midday leaf water potential.
Figure 7. Whole-tree hydraulic conductance (KT) versus REW at the
full canopy stage in the rainy season. The vertical and horizontal bars represent the standard deviation, and ** indicates a highly significant correlation with 99% probability
could be related to the difference in evaporative demand and the magnitude of transpiration. However, concerning young potted rubber trees of the same clone (RRIM 600), the results of Sangsing et al. (2004) clearly did not support isohydric behavior. In the latter experiment, a 4-week drought treatment led to a marked decrease in minimum xylem pressure from −0.8 to −1.7 MPa. Hence, the separation between isohydric and anisohydric behavior in the same clone could be influenced by tree maturity or by the experimental conditions. In our results, well-watered soil conditions corresponded to predawn values between −0.3 and −0.4 MPa. Extreme soil drought (0.1 REW)—with an 80% reduction in transpiration—corresponded to −0.78 MPa. These predawn values and the amount of annual rainfall may suggest moderate drought conditions compared with other species in drier biomes (Eamus and Prior 2001). However, this range of drought was sufficient to induce serious dieback of main branches and the death of several trees, which are common features in rubber tree stands in this area. Whole-tree hydraulic conductance and transpiration Our results showed that the decrease in ET was mainly due to the change in KT. And the decrease in KT was closely correlated with the decline in REW. Our maximum values of KT (between 1.5 and 2.0 × 10² kg m−2 h−1 MPa−1) are within the range previ-ously quoted by authors in temperate (Cochard et al. 1996, Lu et al. 1996, O’Grady et al. 2008) and tropical (Eamus and Prior 2001, Do et al. 2008, O’Grady et al. 2009) trees. The quick recovery of KT after substantial rainfall in August suggests that
the main control came from the change in soil–root conduc-tance. Complementarily, the complete linear response of sap flux density versus ψL, even when the apparent ψcrit was reached, does not support the hypothesis of a significant contri-bution of non-lethal xylem embolism (Sperry et al. 2002). In several species, it was found that ψcrit corresponded to ~10% of percentage loss of hydraulic conductivity and 90% of sto-matal closure (Cochard et al. 1996, Cruiziat et al. 2002). However, in our conditions, an assumption of 90% stomatal closure at the apparent ψcrit does not seem relevant given the relatively high transpiration rate. Combined knowledge of native embolism, stomatal regulation and xylem vulnerability is thus needed to progress further on mature rubber trees.
Performance of the hydraulic limitation model
The results of simulation confirmed the experimental evidence of isohydric control of daily water use. Our results demonstrated the ability of a simple model, based on KT and ψcrit, to simulate the pattern of changes in transpiration. It was able to simulate the main effects of both soil and atmospheric drought. The change in KT was related only to soil water availability (REW), which also influenced ψpd. Hence the tight regulation of transpi-ration in well-watered conditions was simulated through the maximum value of KT (KTmax) and the critical value of ψmd (ψcrit), which are hydraulic traits of the tree. In detail, there is no reason to think that these values remained completely stable over the 6-month period of study. They could have fluctuated according to root growth, stem growth and leaf aging. This could explain Figure 8. Comparison of daily tree transpiration between measured (ET meas) and simulated (ET sim) values with the Ecrit_Eclim model: (a) seasonal
course with ET0 values; (b) ET sim and ET meas relationships. The same remarks as in Figure 2 describe the four groups of points. The dotted line
indicates the 1:1 reference. R2 and RMSE (n = 146) were 0.78 and 0.22.
inaccuracies in the simulation of maximum transpiration. With its oversimplification, the correct performance of the model Ecrit_Eclim provides a robust test of the basis of the hydraulic limitation framework. In addition, the performance is likely also related to several features. One is the relatively strict isohydric behavior of the clone studied in our experiment. A comparison of eight clones in a water-limited area of India ranked RRIM 600 as having the best performance in terms of control of water status (Chandrashekar 1997). The condition of soil drought could be another feature because there was little pos-sibility of root water uptake in the subsoil. Moreover, a full canopy ensures relative stability of the leaf area index, which is a key factor in whole-tree transpiration. The objective of this modeling exercise was to provide a clear framework to test the combination of hypotheses and relationships to explain changes in daily transpiration under drought. It was not to vali-date an operational model ready to predict water use in all conditions. The data used to derive the model were different from the data used to test the model except for the relation-ship between Eclim and ET0 (Figure 2). However, these data belong to the same time series. A next step will be to apply this framework in different conditions (soil, climate, phenology and clone) to see how the parameters and relationships change or not. Nevertheless, this minimalist model provides insight for simplification of operational predictive models.
Conclusion
The framework of plant hydraulic limitations was successful in analyzing the transpiration response of mature rubber trees to atmospheric and soil drought. The results demon-strate isohydric behavior in which whole-tree hydraulic con-ductance remains constant over a large range of environmental conditions and decreases sharply at the low end of soil water availability. Given the complexity of constraints and regula-tions along the soil–plant–atmosphere pathway, these results confirm the relevance of a simplified whole-plant hydraulic approach to the synthesis of the overall behavior of trees under drought.
Acknowledgments
Many thanks to French and Thai counterparts from the Research Institute for Development (IRD), Khon Kaen University and the Land Development Department. We particularly thank the Land Development Department of Bangkok and Dr Darunee Chairod for assistance with neutron probe measurements. We are grateful to Dr Daniel Nandris for his support as coordinator of the agreement program between IRD and the French Institute for Rubber. Finally we deeply thank the plantation holder (Mr Chaipat Sirichaiboonwat) who welcomed us so kindly into his rubber tree plantation.
Funding
This Thai–French research was funded by the French Research Institute for Development (IRD), the French Institute for Rubber (IFC), by Michelin/Scofinco/SIPH Plantations Companies and by the 40-year anniversary fund of Khon Kaen University.
References
Allen, R.G., L.S. Pereira, D. Raes and M. Smith. 1998. Crop evapotrans-piration: guidelines for computing crop water requirements. Irrigation and Drainage Paper No. 56, FAO, Rome.
Bovard, B.D., P.S. Curtis, C.S. Vogel, H.-B. Su and H.P. Schmid. 2005. Environmental controls on sap flow in a northern hardwood forest. Tree Physiol. 25:31–38.
Breda, N., R. Huc, A. Granier and E. Dreyer. 2006. Temperate forest trees and stands under severe drought: a review of ecophysiological responses, adaptation processes and long-term consequences. Ann. For. Sci. 63:1–20.
Bucci, S.J., G. Goldstein, F.C. Meinzer, A.C. Franco, P. Campanello and F.G. Scholtz. 2005. Mechanisms contributing to seasonal homeo-stasis of minimum leaf water potential and predawn disequilibrium between soil and plant water potential in Neotropical savanna trees. Trees 19:296–304.
Bush, S.E., D.E. Pataki, K.R. Hultine, A.G. West, J.S. Sperry and J.R. Ehleringer. 2008. Wood anatomy constrains stomatal response to atmospheric vapor pressure deficit in irrigated, urban trees. Oecologia 156:13–20.
Chandrashekar, T.R. 1997. Stomatal responses of Hevea to atmo-spheric and soil moisture stress under dry subhumid climatic condi-tions. J. Plant Crops 25:146–151.
Chandrashekar, T.R., M.K. Jana, J. Thomas, K.R. Vijayakumar and M.R. Sethuraj. 1990. Seasonal changes in physiological characteris-tics and yield in newly opened trees of Hevea brasiliensis in North Konkan. Indian J. Nat. Rubb. Res. 3:88–97.
Cochard, H., N. Breda and A. Granier. 1996. Whole tree hydraulic conductance and water loss regulation in Quercus during drought: evident for stomatal control of embolism? Ann. For. Sci. 53:197–206.
Cochard, H., L. Coll, X.L. Roux and T. Ameglio. 2002. Unraveling the effects of plant hydraulics on stomatal closure during water stress in walnut. Plant Physiol. 128:282–290.
Cruiziat, P., H. Cochard and T. Ameglio. 2002. Hydraulic architecture of trees: main concepts and results. Ann. For. Sci. 59:723–752. Damour, G., T. Simonneau, H. Cochard and L. Urban. 2010. An
over-view of models of stomatal conductance at the leaf level. Plant, Cell Environ. 33:1419–1438.
David, T.S., M.I. Ferreira, S. Cohen, J.S. Pereira and J.S. David. 2004. Constrains on transpiration from an evergreen oak tree in southern Portugal. Agric. For. Meteorol. 122:193–205.
Do, F. and A. Rocheteau. 2002. Influence of natural temperature gradi-ents on measuremgradi-ents of xylem sap flow with thermal dissipation probes. 2. Advantages and calibration of a non-continuous heating system. Tree Physiol. 22:649–654.
Do, F.C., A. Rocheteau, A.M. Diagne, V. Goudiaby, A. Granier and J.P. Lhomme. 2008. Stable annual pattern of water use by Acacia tortilis in Sahelian Africa. Tree Physiol. 28:95–104.
Domec, J.-C., N. Asko, J.S. King, G. Sun, S.G. Mcnulty, M.J. Gavazzi, J.L. Boggs and E.A. Treasure. 2009. Decoupling the influence of leaf and root hydraulic conductances on stomatal conductance and its
sensitivity to vapour pressure deficit as soil dries in a drained loblolly pine plantation. Plant, Cell Environ. 32:980–991.
Duursma, R.A., P. Kolari, M. Perämäki et al. 2008. Predicting the decline in daily maximum transpiration rate of two pine stands dur-ing drought based on constant minimum leaf water potential and plant hydraulic conductance. Tree Physiol. 28:265–276.
Eamus, D. and L. Prior. 2001. Ecophysiology of trees of seasonally dry tropics: comparisons among phenologies. Adv. Ecol. Res. 32:113–197.
Fisher, R.A., M. Williams, R. Lobo Do Vale, A. Lola Da Costa and P. Meir. 2006. Evidence from Amazonian forest is consistent with isohydric control of leaf water potential. Plant, Cell Environ. 29:151–165. Franks, P.J., P.L. Drake and R.H. Froend. 2007. Anisohydric but
isohy-drodynamic: seasonally constant plant water potential gradient explained by stomatal control mechanism incorporating variable plant hydraulic conductance. Plant, Cell Environ. 30:19–30.
Gururaja Rao, G., P. Sanjeeva Rao, R. Rajagopal, A.S. Devakumar, K.R. Vijayakumar and M.R. Sethuraj. 1990. Influence of soil, plant and meteorological factors on water relations and yield in Hevea brasiliensis. Int. J. Biometeorol. 34:175–180.
Isarangkool Na Ayutthaya, S., F.C. Do, K. Pannengpetch, J. Junjittakarn, J.-L. Maeght, A. Rocheteau and H. Cochard. 2010. Transient thermal dissipation method of xylem sap flow measurement: multi-species calibration and field evaluation. Tree Physiol. 30:139–148.
Jones, H.G. 1998. Stomatal control of photosynthesis and transpira-tion. J. Exp. Bot. 49:387–398.
Lu, P., P. Biron, A. Granier and H. Cochard. 1996. Water relation of adult Norway spruce (Picea abies (L) Karst) under soil drought in the Vosges mountains: whole-tree hydraulic conductance, xylem embolism and water loss regulation. Ann. For. Sci. 53:113–121. Oguntunde, P.G., N. van de Giesen and H.H.G. Savenije. 2007.
Measurement and modeling of transpiration of a rain-fed citrus orchard under subhumid tropical conditions. Agric. Water Manage. 87:200–208.
Oren, R., N. Phillips B.E. Ewers, D.E. Pataki and J.P. Megonigal. 1999. Sap-flux-scaled transpiration responses to light, vapor pressure deficit, and leaf area reduction in a flooded Taxodium distichum forest. Tree Physiol. 19:337–347.
O’Grady, A.P., D. Worledge and M. Battaglia. 2008. Constraints on transpiration of Eucalyptus globulus in southern Tasmania, Australia. Agric. For. Meteorol. 148:453–465.
O’Grady, A.P., P.G. Cook, D. Eamus, A. Duguid, J.D.H. Wischusen, T. Fass and D. Worldege. 2009. Convergence of tree water use within an arid-zone woodland. Oecologia 160:643–655.
Ranasinghe, M.S. and J.A. Milburn. 1995. Xylem conduction and cavi-tation in Hevea brasiliensis. J. Exp. Bot. 46:1693–1700.
Sangsing, K., P. Kasemsap, S. Thanisawanyangkura, K. Sangkhasila, E. Gohet, P. Thaler and H. Cochard. 2004. Xylem embolism and stomatal regulation in two rubber clones (Hevea brasiliensis Muel. Arg.). Trees. 18:109–114.
Silpi, U., P. Thaler, P. Kasemsap, A. Lacointe, A. Chantima, B. Adam, E. Gohet, S. Thanisawanyangkura and T. Ameglio. 2006. Effect of tapping activity on the dynamics of radial growth of Hevea brasiliensis trees. Tree Physiol. 26:1579–1587.
Sinclair, T.R. 2005. Theoretical analysis of soil and plant traits influencing daily plant water flux on drying soils. Agron. J. 97:1148–1152. Sperry, J.S., F.R. Adler, G.S. Campbell and J.P. Comstock. 1998.
Limitation of plant water use by rhizosphere and xylem conductance: results from model. Plant, Cell Environ. 21:347–359.
Sperry, J.S., U.G. Hacke, R. Oren and J.P. Comstock. 2002. Water defi-cits and hydraulic limits to leaf water supply. Plant, Cell Environ. 25:251–263.
Tardieu, F. and T. Simonneau. 1998. Variability among species of sto-matal control under fluctuating soil water status and evaporative demand: modeling isohydric and anisohydric behaviour. J. Exp. Bot. 49:419–432.
Tyree, M.T. and J.S. Sperry. 1988. Do woody plant operate near the point of catastrophic xylem dysfunction caused by dynamic water stress? Plant Physiol. 88:574–580.
Tyree, M.T. and M.H. Zimmermann. 2002. Xylem structure and the ascent of sap. 2nd edn. Springer, Berlin.
Van den Honert, T.H. 1948. Water transport in plant as catenary pro-cess. Disc. Farad. Soc. 3:146–153.
West, A.G., K.R. Hultine, T.L. Jackson and J.R. Ehieringer. 2007. Differential summer water use by Pinus edulis and Juniperus osteo-sperma reflects contrasting hydraulic characteristics. Tree Physiol. 27:1711–1720.
Williams, M., E.B. Rastetter, D.N. Fernandes et al. 1996. Modeling the soil-plant-atmosphere continuum in a Quercus-Acer stand at Harvard Forest: the regulation of stomatal conductance by light, nitrogen and soil/plant hydraulic properties. Plant, Cell Environ. 19:911–927.