HAL Id: hal-01744891
https://hal.archives-ouvertes.fr/hal-01744891
Submitted on 20 May 2021
HAL is a multi-disciplinary open access
archive for the deposit and dissemination of
sci-entific research documents, whether they are
pub-lished or not. The documents may come from
teaching and research institutions in France or
abroad, or from public or private research centers.
L’archive ouverte pluridisciplinaire HAL, est
destinée au dépôt et à la diffusion de documents
scientifiques de niveau recherche, publiés ou non,
émanant des établissements d’enseignement et de
recherche français ou étrangers, des laboratoires
publics ou privés.
Implication in seismogenic source definition and seismic
hazard assessment
Hugo Yepes, Laurence Audin, Alexandra Alvarado, Céline Beauval, Jorge
Aguilar, Yvonne Font, Fabrice Cotton
To cite this version:
Hugo Yepes, Laurence Audin, Alexandra Alvarado, Céline Beauval, Jorge Aguilar, et al.. A new
view for the geodynamics of Ecuador: Implication in seismogenic source definition and seismic
hazard assessment. Tectonics, American Geophysical Union (AGU), 2016, 35 (5), pp.1249 - 1279.
�10.1002/2015TC003941�. �hal-01744891�
A new view for the geodynamics of Ecuador: Implication
in seismogenic source de
finition and seismic
hazard assessment
Hugo Yepes1,2, Laurence Audin2, Alexandra Alvarado1, Céline Beauval2, Jorge Aguilar1, Yvonne Font3, and Fabrice Cotton4
1
Instituto Geofísico, Escuela Politecnica Nacional, Quito, Ecuador,2Institut des Sciences de la Terre, ISTerre, Université de Grenoble Alpes-CNRS-IRD, Grenoble, France,3Observatoire de la Côte d’Azur, Géoazur, Université de Nice Sophia-Antipolis,
Institut de Recherche pour le Développement (UR 082), Valbonne, France,4German Research Institute for Geosciences, GFZ, Institute for Earth and Environmental Sciences, University of Potsdam, Potsdam, Germany
Abstract
A new view of Ecuador’s complex geodynamics has been developed in the course of modeling seismic source zones for probabilistic seismic hazard analysis. This study focuses on two aspects of the plates’ interaction at a continental scale: (a) age-related differences in rheology between Farallon and Nazca plates —marked by the Grijalva rifted margin and its inland projection—as they subduct underneath central Ecuador, and (b) the rapidly changing convergence obliquity resulting from the convex shape of the South American northwestern continental margin. Both conditions satisfactorily explain several characteristics of the observed seismicity and of the interseismic coupling. Intermediate-depth seismicity reveals a severeflexure in the Farallon slab as it dips and contorts at depth, originating the El Puyo seismic cluster. The two slabs position and geometry below continental Ecuador also correlate with surface expressions observable in the local and regional geology and tectonics. The interseismic coupling is weak and shallow south of the Grijalva rifted margin and increases northward, with a heterogeneous pattern locally associated to the Carnegie ridge subduction. High convergence obliquity is responsible for the North Andean Block northeastward movement along localized fault systems. The Cosanga and Pallatanga fault segments of the North Andean Block-South American boundary concentrate most of the seismic moment release in continental Ecuador. Other inner block faults located along the western border of the inter-Andean Depression also show a high rate of moderate-size earthquake production. Finally, a total of 19 seismic source zones were modeled in accordance with the proposed geodynamic and neotectonic scheme.1. Introduction
Adequate understanding of long-term crustal deformation processes is essential for accurate determination of seismic hazard. Present-day seismogenic structures are palpable evidence of tectonic forces that have slowly evolved during geologic times but remain invariant in terms of the short time frame observed for seismic hazard assessment. Once those tectonic processes are unveiled and the resulting main fault systems are linked to historical and instrumental seismicity on the one hand, and ground motion prediction equations are adopted on the other, seismic hazard experts have the main inputs to calculate the probabilities of experiencing different levels of ground shaking within a specific exposure time. The output of this intricate modeling process, known as probabilistic seismic hazard assessment (PSHA), is especially valuable for engi-neering design and planning purposes in earthquake-prone countries.
In PSHA it is current practice to use geodynamic and tectonic information as well as geodetic data for mod-eling seismic sources [Muir-Wood, 1993; Meletti et al., 2008; Stirling et al., 2012; Caputo et al., 2013]. Seismic sources could be defined either as distributed seismicity or as fault sources. Distributed seismicity sources are geometric volumes where seismicity may be considered uniformly distributed in space and stationary in time, rendering their seismic potential as homogeneous. They encompass seismogenic structures with similar tectonic behavior [Meletti et al., 2008; Baize et al., 2013]. On the other hand, the fault source model requires the geometry and slip rates of mapped fault sources in order to develop a single characteristic earth-quake (magnitude and frequency) for each source [Stirling et al., 2012]. Knowledge about the size, geometry, and slip rates of individual faults or fault systems is poor in Ecuador; consequently, only distributed seismicity sources or seismic source zones (SSZs) are discussed in this paper.
Tectonics
RESEARCH ARTICLE
10.1002/2015TC003941
Key Points:
• A reviewed model of Ecuador’s geodynamics is used to define seismic source zones
• Differences in rheology and changes in convergence obliquity explain observed seismicity
• Shallow and intermediate-depth seismicity show slab bending and block motion, respectively
Supporting Information: • Supporting Information S1 • Movie S1 Correspondence to: H. Yepes, hyepes@igepn.edu.ec Citation:
Yepes, H., L. Audin, A. Alvarado, C. Beauval, J. Aguilar, Y. Font, and F. Cotton (2016), A new view for the geodynamics of Ecuador: Implication in seismogenic source definition and seismic hazard assessment, Tectonics, 35, 1249–1279, doi:10.1002/2015TC003941. Received 18 JUN 2015 Accepted 20 APR 2016
Accepted article online 22 APR 2016 Published online 24 MAY 2016
©2016. American Geophysical Union. All Rights Reserved.
Previous attempts of defining SSZs in Ecuador date back to the early 1990s [Bonilla et al., 1992]. More com-prehensive studies were aimed at doing PSHA for seismic design of infrastructure [e.g., Gajardo et al., 2001; Yepes et al., 2006] and at producing seismic zonation maps for the Ecuadorian Building Codes of 2001 and 2011 [CEC, 2001; NEC, 2014], but they were not published in the scientific literature. Alvarado revisited the 2011 zones in her Ph.D. work [2012], and Beauval et al. [2014] used them for PSHA in Quito, the capital city, for estimating uncertainties related to both the definition of distinct source zones and the differences in the chosen ground motion prediction equations.
Our approach to develop the new SSZ scheme for Ecuador is to revisit the previously published geodynamic and seismotectonic models with the goal of matching the seismic source zonation to the novel geodynamic interpretation presented here. Our fresh view on Ecuador’s geodynamics is based on the recently published country-wide Earthquake Catalog For Seismic Hazard Assessment [Beauval et al., 2013] which combines the most reliable magnitude and hypocentral solutions extracted from different instrumental catalogs, including reprocessed results from the local seismic network [i.e., Font et al., 2013]. For our analysis we divide the catalog in shallow (0–50 km) and intermediate-depth (50–300 km) seismicity. Shallow seismicity is tied to both, brittle rupture of crustal faults and interface megathrust failures. The largest interface earthquake in the catalog is the 1906 Mw8.8, while the strongest recorded crustal event corresponds to the 1987 Mw7.1
earthquake. Intermediate-depth events are related to internal tearing of the subducting slab. In the catalog the maximum magnitudes are assigned to the 2005 and 1971 events (Mw7.5 and 7.4, respectively). The
300 km depth limit reflects the fact that there are few deep earthquakes in the catalog (just three events are deeper than 300 km, the strongest dated in 1925).
The sharper picture of the country’s seismicity provided by the new catalog depicts the downgoing slab geo-metry and confirms the relationship of the involved plates at depth where inherited oceanic plate structures have an influential role. For the continental domain, convergence obliquity, and tectonic stress partitioning, focal mechanisms and seismic energy release patterns are analyzed along with new knowledge obtained from recent geologic investigations on active continental faults [Baize et al., 2014; Alvarado et al., 2016]. We merge all that information with the seismic catalog and active deformation data to better define geometries and boundaries of continental source zones corresponding to the seismotectonic model.
2. Revisiting Geodynamics and Seismotectonics in Ecuador
2.1. Overview of Geomorphic Features and Shallow Seismicity of the Intervening Plates 2.1.1. Nazca Plate: Two Plates With Different Densities in Contact
The subduction of the Nazca plate since early Miocene (convergence direction N83; 56 mm yr 1at equatorial latitudes [Kendrick et al., 2003]) is the most obvious and major geodynamic process taking place in northwes-tern South America. Before stabilizing during the late Miocene when the Panama Basin spreading centers became extinct, active spreading axes, rifts, transform faults, and grabens along ridge crests populated the basin as can still be noticed in Figure 1.
Nowadays, the subduction of two major topographic elements complicates the penetration of the Nazca plate beneath the continent: (a) the Carnegie ridge, an ~200 km wide, 2000 m high aseismic ridge, and (b) the ~500 m step north of the Grijalva ridge related to the density contrast between the younger Nazca crust to the north and the older Farallon crust to the south (Figure 1). The density contrast is related to an up to 9 Ma difference in oceanic crustal age resulting from the latestfission of the Farallon plate that progressively resulted in the Nazca and Cocos plates at the beginning of the Miocene [Hey, 1977; Lonsdale and Klitgord, 1978; Lonsdale, 2005]. Grijalva is the remaining evidence of the rifting of the Farallon lithosphere and will be named as the Grijalva rifted margin hereinafter. To the south, Alvarado and Sarmiento (Figure 1) are 2 km high topographic fossil ridges generated byfissural eruptions [Lonsdale, 2005]. They do not constitute rifting features and thus do not show any density contrast. Both the Carnegie ridge and Grijalva rifted margin have been entering the subduction zone from at least 3–6 Ma ago and are thought to have penetrated up to 300–500 km under the continent [Gutscher et al., 1999; Lonsdale, 2005; Michaud et al., 2009]. This implies that two plates of different densities are in contact underneath the Ecuadorian Andes; the northernmost includes the Carnegie ridge’s lower density, buoyant, thickened oceanic crust. North of the Carnegie ridge a clear bathymetric feature belongs to the Yaquina graben: an abandoned transform fault [Lonsdale, 2005] or fracture zone [MacMillan et al., 2004] (Figure 1).
2.1.2. Interface Seismicity: One of the Most Seismically Active Convergent Margins
In the scientific literature [Kelleher, 1972; Kanamori, 1977; Kanamori and McNally, 1982; Beck and Ruff, 1984; Mendoza and Dewey, 1984; Swenson and Beck, 1996; Collot et al., 2004; Font et al., 2013; Chlieh et al., 2014], it has been extensively shown that the subduction zone along the northwestern edge of South America is one of the most active convergent margins in the world. Along this approximately 1300 km long subduction zone, eight Mw>7.0 events ruptured the seismogenic interface during the twentieth century (Figure 2a) which includesfive in the Nazca plate domain north of the Grijalva rifted margin and three south of it. No historical subduction earthquakes have been described prior to 1896 either due to a lack of seismicity or to absence of historical records. The only possible exception would be the 1619 Trujillo, Peru earthquake, which has not been verified as an interplate event [Dorbath et al., 1990].
In the northern group, the Mw8.8 1906 Ecuador-Colombia megathrust earthquake ranks among the 10 most
powerful earthquakes ever recorded by seismometers in the world [Kanamori, 1977] and released seismic
Figure 1. Geodynamic framework of Ecuador and neighboring countries. The Nazca plate is converging at equatorial latitudes relatively to the Brazilian shield at 56 mm yr 1[Trenkamp et al., 2002]. Due to the acute convexity of the margin (trench is the thick black line with indents), oblique convergence is driving two different continental slivers away from each other. The North Andean Block (NAB) is moving toward the NNE at 9 mm yr 1along localized right-lateral strike-slip or reverse faults—CCPP fault system that continues in Colombia as the Algeciras fault (red thick line). The Inca sliver is moving toward the SSE at ~5 mm yr 1along the proposed limit in the eastern Peruvian sub-Andean Belt (dashed red line). The Grijalva rifted margin is separating two oceanic plates of different ages. The black segmented line is marking the inland prolongation of the rifted margin. The approximate location of main cities has been highlighted with white letters: Bu = Buenaventura; Pa = Pasto; Q = Quito; R = Riobamba; B = Bahía; G = Guayaquil; Cu = Cuenca; Ta = Talara. Base map modified from GeoMapApp (http:// www.geomapapp.org). (a) Topographic A-B profile showing the relief across the central Ecuadorian Andes. CC = Coastal Cordillera; WC = Western Cordillera; ID = inter-Andean Depression; EC = Eastern Cordillera; ESB = Eastern sub-Andean Belt; AB = Amazon Basin. (b) Region covered in our study.
energy from an ~500 km long interface segment immediately north of Carnegie ridge. Within the 1906 rupture area, three other large earthquakes occurred during the twentieth century, depicting a dual rupture cycle where megathrust earthquakes may represent supercycles recurring every 200 to 600 years [Kanamori and McNally, 1982; Beck and Ruff, 1984; Mendoza and Dewey, 1984; Chlieh et al., 2014], while smaller Mw7–8
events occurred at a pace of three per century during the twentieth century (Figure 2a).
Southward, no Mw≥ 8 event has been recorded along the interface between the Grijalva rifted margin and the Mendaña fracture zone (~10°S, outside the analyzed region). This segment of the South American subduction zone is considered to have greater than average repeat times for great earthquakes [Nishenko, 1991] or to be freely slipping as a second alternative [Nocquet et al., 2014]. The strongest recorded magnitude corresponds to the rare tsunamigenic 1960 earthquake (Mw7.8; Figure 2a)
character-ized by slow rupture that involved only the shallow portion of the subduction zone [Bilek, 2010]. From Figure 2a, it is also apparent that south of 2°S the interface seismicity is sparse and less conspicuous, with the exception of an epicenter cluster at 4°S latitude where two Mw≥ 7 events are located. This concentra-tion of earthquakes is named here as the Talara seismic cluster. Notice that the Grijalva rifted margin encounters the trench at 2.9°S latitude, suggesting a differential influence of each plate on the generation of interface earthquakes.
The small 100–120 km long subduction segment located between 1.8°S latitude and the reported southern rupture limit of the great 1906 thrust earthquake at ~0.7°S latitude [Kelleher, 1972; Collot et al., 2004] is characterized by dense background seismicity with a maximum magnitude of Mw6.1. Here most of the
seismic energy of the interface is released during intense seismic swarms related to the activity of persistent
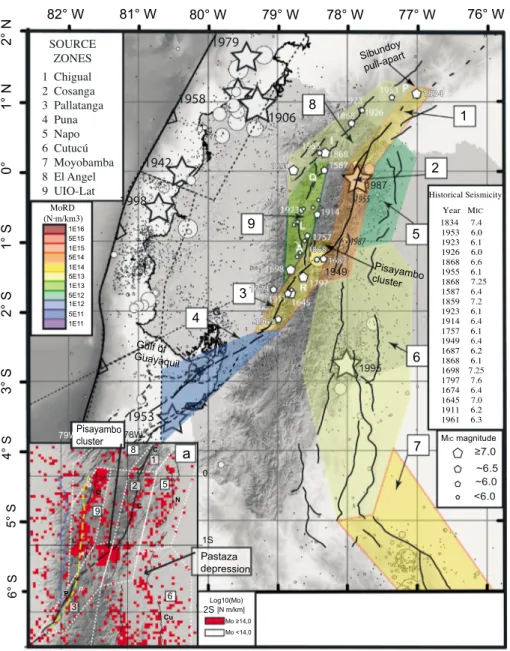
Figure 2. The 110 years of instrumental seismicity in Ecuador, 1900–2009. Mw≥7 earthquakes are plotted as stars. Years and magnitudes are listed in the respective
insets. Mw<7 events are plotted as circles. Sizes are proportional to the seismic moment release Mo of individual events. Circle’s radii are obtained assuming circular
faults releasing seismic moment at a constant stress drop of 3 MPa. Black hollow squares are pre-1930 Mw≥ 7 earthquakes whose location and depth are considered
not reliable. Hypocentral depths (Z) are classified by colors. (a) Shallow seismicity (hypocentral depth ≤50 km). CCPP fault system marks the North Andean Block boundary. (b) Intermediate-depth seismicity (hypocentral depth>50 km). The dotted line represents the inland prolongation of Grijalva rifted margin. Notice that the line separates slabs with different origin and ages. Cross sections A-A′ to D-D′ presented in Figure 5 are marked here. Letters are main cities: Q = Quito; B = Bahía; R = Riobamba; G = Guayaquil. Seismicity is from Beauval et al. [2013].
shallow slow-slip events [Vallée et al., 2013]. There is also a concentration offive Mw6–7 earthquakes
imme-diately to the south of the slow-slip zone, but it lacks the presence of smaller events (Figure 2a). 2.1.3. Crustal Morphology: Evidence of Continuous Oblique Convergence
In continental Ecuador, four physiographic zones can be defined from west to east as a result of long-term crustal deformation (Figure 1): (1) the low, wide coastal region with smoother topography and a coastal range located at the western margin (~300 m above mean sea level (amsl)); (2) the Andean ranges, 150 km wide on average in Ecuador, that display a general N-S direction and rise above 3000 m amsl; (3) the Eastern sub-Andean Belt (ESB) with lower average altitudes (~2000 m amsl) than the main Andean Cordillera; and (4) the Amazon Basin gently dipping to the east (~300 m amsl). The Ecuadorian Andes shows distinct morphology, north and south of 1.7°S latitude. To the north, two parallel ranges are distinguishable (the Western and Eastern Cordilleras at ~4000–4400 m above sea level (asl)) separated by the inter-Andean Depression (~2200–3000 m asl) that is not wider than 30 km (Figure 1a). An active volcanic arc with up to four subparallel rows of volcanoes extends from the Colombian border to the southern end of the volcanic arc at ~2°S. No distinctive ranges are found south of 1.7°S, and the inter-Andean Depression gives way to individual intramountainous sedimentary basins that lack the widespread Quaternary volcanic deposits observable to the north. Farther south in Peruvian territory, the northern Peruvian Andes consists of a more massive range ~300 km wide.
This morphology is the consequence of a shared geodynamic history of the northern Andes (Ecuador-Colombia-Venezuela [Pindell and Kennan, 2009]), which is very different from that of the central Andes (Peru-Chile-Bolivia [Barnes and Ehlers, 2009]). Indeed, present-day Ecuador’s tectonic setting results from a transpressive evolution that has occurred throughout the Paleocene as a consequence of oblique subduction and progressive, accretionary continental growth [Daly, 1989; Cediel et al., 2003; Toro, 2007]. Subsequently, the onset and development of the current subduction scheme began during the Oligocene [Jaillard et al., 2009] characterized by continuous oblique subduction [Daly, 1989]. As a result of oblique convergence and the accretion of oceanic terranes, a tectonic block began to be pushed toward the northeast, in response to partitioning of shear stresses and high coupling along the northern Ecuadorian interface [Egbue and Kellogg, 2010; Nocquet et al., 2014], as will be described in more detail later. This continental block is known as the North Andean Block (NAB) and is bordered to the east by a long-lived, transpressive right-lateral fault system, the Chingual-Cosanga-Pallatanga-Puná (CCPP) system, that forms the western limit of the stable South American plate [Ego et al., 1996b; Alvarado et al., 2016] (Figure 1).
2.1.4. Crustal Seismicity: Localized Activity With Strong Shallow Earthquakes
In continental Ecuador, high-energy seismic moment release is mostly concentrated in the northern Andes, especially in the inter-Andean Depression and along the sub-Andean Belt (Figure 2a). Two shallow continen-tal crust earthquakes of Mw≥ 7 have been instrumentally recorded during the past 110 years. The 1987 Mw7.1
shock is related to the NAB-South American transpressive boundary, while the second event is located in the Ecuadorian ESB but probably still in the central Andes compressive domain [Yepes et al., 1996] (Figure 2a). Several events with Mw6.0–7.0 also cluster in the northeastern Peruvian central Andes domain (~6°S latitude)
and are aligned in a direction perpendicular to Nazca plate convergence.
The largest intra-Andean instrumental event corresponds to the 1949 Ambato earthquake (Mw6.5; Figure 2a).
This devastating earthquake is also related to the NAB-South American boundary zone [Beauval et al., 2010]. Several moderate earthquakes (5< Mw≤ 6) have also been recorded along a 130 km long, N15°E lineament
that coincides with the western slopes of the inter-Andean Depression (Figure 2a).
Preinstrumental earthquakes are also fairly common in the inter-Andean Depression [Giesecke, 1988; Giesecke et al., 2004; Beauval et al., 2010]. Seven out of 30 Andean historical earthquakes relocated by Beauval et al. [2010] and Beauval et al. [2013] have an intensity-derived magnitude MIC≥ 6.5 (MIC= intensity magnitude
calculated at the intensity center using Bakun and Wentworth [1997] methodology equivalent to Mw) in a time
span of 368 years and 21 have MIC≥ 6.0. The recurrence interval for Mw≥ 6 historical and instrumental crustal
earthquakes along the 300 km long segment of the Ecuadorian north-central Andes is estimated to be 10–20 years [Beauval et al., 2013], for events that originated along both NAB boundary faults and at the smaller thrust faults marking the borders of the heavily populated inter-Andean Depression. Although the total moment release along these structures is not comparable with that at the interface, hypocenters are very shallow and have a high potential for damage as reflected by the high number of fatalities and
widespread destruction during historical earthquakes. It is noteworthy that NAB’s CCPP Pallatanga fault segment, to the SW of the inter-Andean Depression, and which was broken by the 1797 event—one of the largest historical crustal earthquakes in South America [Baize et al., 2014] with a death toll between 15,000 and 30,000 [Egred, 2000]—exhibits very little seismic energy release during the catalog’s instrumental time span (Figure 2a). Historical earthquakes will be addressed in more detail when discussing individual source zones.
2.2. Consequences of the Oblique Convergence Along the Convex Continental Margin of Northwestern South America
Subduction of oceanic plates is a complex geodynamic process responsible not only for the release of more than 90% of the total seismic moment globally but also for most of thefirst-order tectonic features that characterize continental plates at convergent margins. It has been recognized that along-strike variations in the margin geometry, such as convexity and concavity, have effects on the shape and stressfield in the descending slab [Bevis, 1986] and on the stress regime and the strain pattern in the upper plate [e.g., Bonnardot et al., 2008]. Additionally, the resulting obliquity of the convergence leads to partitioning of the convergence vector in its thrust and shear components that are perpendicular and parallel to the trench, respectively [McCaffrey, 1993]. The parallel-to-the-trench component may give rise to the development of large continental faults in response to continental block movements.
2.2.1. Subduction Along a Convex Margin
As observed in Figure 1, the trench displays a significant curvature at the equatorial latitudes, giving rise to complexities in the geometry of the slab [Barazangi and Isacks, 1976; Isacks and Barazangi, 1977; Bevis and Isacks, 1984; Cahill and Isacks, 1992; Heuret et al., 2007; Bonnardot et al., 2008]. Therefore, different subduction angles and geometries should be expected along the strike of this convex margin. The new global subduc-tion plate geometry model SLAB 1.0 [Hayes et al., 2012] describes the 3-D shape of the downgoing slab under-neath South America. SLAB 1.0 accurately reproduces the widerflat slab geometry described by several authors in central and northern Peru up to ~4°S latitude [Cahill and Isacks, 1992; Tavera and Buforn, 2001]. Farther north it models a gentle change of the Benioff zone to steeper dipping angles in central Ecuador. However, insufficient data make it difficult for the model to fit the true subduction interface in a narrow region of complex geometry based upon worldwide seismic catalogs (see Figure 6a in Hayes et al. [2012]), which is the case for central and northern Ecuador. Therefore, in order to model intermediate-depth seismic source zones, we have reviewed the literature and carried out an independent analysis of a more comprehen-sive set of seismicity data supplied by local networks [Beauval et al., 2013], in order to recognize and identify potential shapes and boundaries of plate segments along the subduction.
2.2.2. Slab Geometry From South to North as Given in the Literature
In central Peru (~10°S latitude), the Nazca plate is subducting with a gently dipping angle that increases to 30° until it reaches ~100 km depth; then the plate becomes almost horizontal for distances of≤500 km from the trench [Stauder, 1975; Barazangi and Isacks, 1976; Jordan et al., 1983; Suarez et al., 1983; Cahill and Isacks, 1992]. This pattern is also found in northern Peru between ~4°S and ~8°S, where the Nazca plate initially dips beneath the continent at a 10° angle, then dives with a steeper angle until the slab reaches depths of ~130 km, and then itflattens out [Tavera and Buforn, 2001]. Local seismicity studies [Tavera et al., 2006] helped to determine these initial subduction angles to 10° and 28°, respectively, measured along cross sections oriented N70°E, but theflat slab portion that follows the initial dive of the plate further south was not recognized by the local seismicity studies.
In south-central Ecuador, between 4°S and 1°S, the Nazca plate undergoes a sharp contortion similar to that observed in southern Peru where a southward transition from aflat to a normal (30°) plunging slab at ~15°S latitude takes place [Hasegawa and Sacks, 1981; Cahill and Isacks, 1992]. First Pennington [1981], later Bevis and Isacks [1984], and then Hall and Wood [1985] proposed a sharpflexure of the subducted Nazca plate beneath Ecuador associated with the Carnegie ridge subduction. Chen et al. [2001] statistically analyzed along-strike dip variations of the subducted Nazca plate from 1°N to 3°S latitude using focal mechanisms of intermediate-depth earthquakes given in Harvard’s centroid moment tensor (CMT) catalog [Dziewonski et al., 1981]. They determined that the slab is dipping at 20° and has a general strike of N300°. This averaged strike represents a counterclockwise ~45° rotation as compared to the N345° strike found for the subducted slab southward of 5°S latitude, using focal mechanism solutions. This is interpreted as a sharpflexure of the descending slab [Tavera et al., 2006].
Instead of favoring the contortion orflexure of a coherent slab at these latitudes, Gutscher et al. [1999] postulated that the oceanic lithosphere is torn along the Grijalva scarp or fracture zone (sic) due to the buoyancy of the adjoining slab segment to the north, which carries the Carnegie ridge. For them, the Carnegie segment corresponds to aflat slab that is also bounded to the north by a series of tears arranged in steps from 1.5°N to 3°N latitude. For this same segment, several authors propose that the slab is subducting eastward at 25° to 35° dip angles [Pennington, 1981; Taboada et al., 2000; Guillier et al., 2001; Manchuel et al., 2011], whereas others conceive dipping planes up to 50° [e.g., Pedraza et al., 2007]. In any case, the presence of such a bathymetric relief from 2°S to 0.5°N (Figure 1) and its impingement against South America is appealing for explaining the north-northeastward escape of the NAB.
As presented above, there are different notions concerning the general shape, orientation, dip, and tears of the subducting slab underneath Ecuador. There are also differences about the role that Carnegie ridge plays in the subduction process and in shaping many superficial characteristics of Ecuadorian geology since the mid-Miocene [Michaud et al., 2009]. Local microseismicity studies [Guillier et al., 2001; Manchuel et al., 2011] have contradicted theflat subduction hypothesis [Gutscher et al., 1999]. Michaud et al. [2009] used arguments put forward by Kay et al. [2005] related to the fact that abundant evidence for adakites in the Andes shows that slab tearing or aflat slab is not necessarily required for generation of adakites to conclude that there is no need for tears in the Nazca plunging slab to explain the anomalous geochemical (adakitic) signature of volcanoes in the broad Ecuadorian volcanic arc. Furthermore, they consider that there is no clear deforma-tion in the continental realm linked solely to the arrival and later subducdeforma-tion of the Carnegie ridge, either on the coastal plains or in the Cordillera.
Finally, at the northern end of our studied area, several authors [e.g., Taboada et al., 2000; Vargas and Mann, 2013] have recognized an abrupt change in the intermediate-depth seismicity pattern in central Colombia. At ~5.6°N latitude (not in ourfigures) there is a 240 km long offset to the east of the easterly dipping Benioff zone. The two Benioff zones are actually reflecting the presence of two very distinct subducting slabs: paleo-Caribbean and Nazca [Taboada et al., 2000]. There is an overlap of the paleo-paleo-Caribbean and the Nazca plates, between 5.2°N and 7°N, that provides a thermal blanket that shuts down the volcanic arc north of 5°N [e.g., Taboada et al., 2000; Cortés and Angelier, 2005]. The offset of the intermediate-depth seismicity most likely marks the southern edge of the paleo-Caribbean plate [Taboada et al., 2000]. To the south, from 5.6°N to 2° N, the Nazca plate is subducting at 30°–40° to the east [Vargas and Mann, 2013]. The intermediate-depth seis-micity disappears southward of ~2°N latitude. We observe that the disappearance of this seisseis-micity to the south coincides with the inland projection of the fossil Malpelo rift spreading center (Figure 1) [Lonsdale, 2005]. 2.2.3. Relocated Intermediate-Depth Seismicity as a Key to Interpret Moment Release, Shapes, and Dipping Angles
Let us now look at the intermediate-depth seismicity distribution in order to elucidate the moment release, shape, and dipping angles of the Nazca and Farallon slabs from the perspective of the newly published catalog [Beauval et al., 2013; Font et al., 2013]. Intermediate-depth earthquakes (hypocentral depths between 50 km and 300 km) have very distinct distributions in northern and southern Ecuador (Figure 2b). Seismicity is bounded by the inland projection of the Grijalva rifted margin, an aspect that was not recognized by previous authors. Mw≥ 6 earthquakes have not been recorded between this projection line and 2°N latitude during the 110 years
of catalog coverage. Intermediate-depth seismicity is almost exclusively located south of the Grijalva projection, implying a strong control of the intermediate-depth seismicity by differing mantle rheology of the older Farallon plate to the south and the younger Nazca plate to the north.
A clear alignment of sizable earthquakes is also apparent along a narrow 600 km long NNW-SSE band in the Farallon plate, stretching from 1.5°S to 6.5°S latitude (Figure 2b). Six of them show Mw≥ 7 with depths ranging
from 120 to 200 km. The moment release everywhere else in the subducting slab is secondary to this seismic strip, which may be related to the transition from aflat to a much steeper angle of the slab, as modeled in SLAB 1.0 (see Figure 7a in Hayes et al. [2012]). The northern termination of the strip is marked by a conspic-uous concentration of earthquakes around 1.5°S latitude, 77.8°W longitude, which have hypocentral depths ranging from 130 to 210 km and have had a maximum Mw7.1 (2010). We name this concentration hereafter as the El Puyo seismic cluster (Figure 2b).
In Figure 3, we present the focal mechanism solutions (depth 50–300 km) obtained from the Harvard global centroid moment tensor catalog [Dziewonski et al., 1981] from 1976 to 2013. Normal faulting focal mechanisms
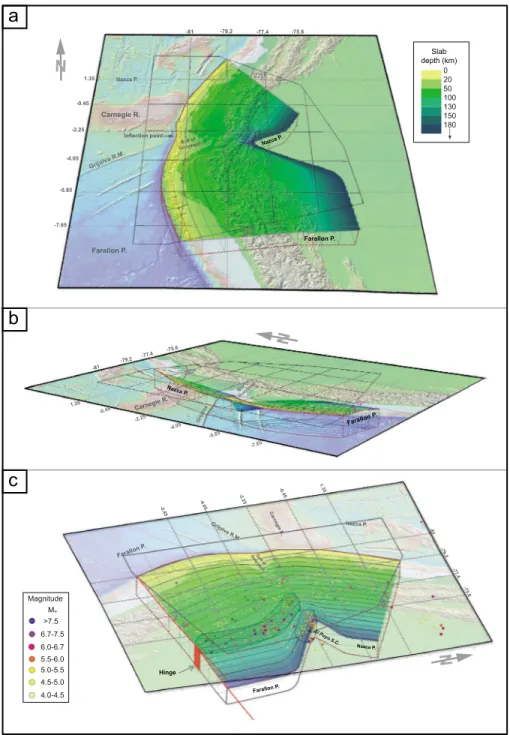
are ubiquitous in the Farallon downgoing slab. Nodal plane strikes show a remarkable parallelism with the direction of the magnetic anomalies offshore (Figure 3), which in general show similar directions as the tectonic fabric acquired during the creation of the oceanic plate. This suggests that gravity-driven stretching of the subducted oceanic lithosphere is tearing the plate along that inherited fabric. If this is the case, the ~20° counterclockwise rotation in the nodal planes’ strikes observed in El Puyo seismic cluster (Figure 3) and the hypocentral deepening as shown in Figure 2b should be related to the bending of the subducted lithosphere. The east dipping slab of northern Peru begins toflex at about 3°S and dips to the northeast toward the El Puyo cluster. The slab bending may be responsible for concentrating stresses that trigger the intermediate-depth seismicity in the cluster. The details of the shape and complexities of the bending slab and its influence on the surface geology are beyond the scope of the present work, but a series of three diagrams have been attempted to help visualize the shape and the possible depth isocontours of the subducted plates (Figure 4).
Figure 3. Focal mechanisms for intermediate-depth earthquakes (55 km< Z ≤ 300 km) obtained from the Harvard global centroid moment tensor catalog [Dziewonski et al., 1981] from 1976 to 2013. The Grijalva rifted margin northeastern prolongation (thin hachured line) constitutes a sharp boundary for intermediate-depth seismicity which is sporadic north of it. Focal mechanisms for the four largest events have been highlighted. Notice the along-strike counterclockwise rotation of fault plane azimuths from south to north in the Farallon plate. The thick hachured circle’s arch at the trench at approximately 0° and the thin dotted lines show a circle’s sector centered at El Puyo cluster (see the text for explanation). Offshore lines represent magnetic isochrones modified from Lonsdale [2005]. Associated numbers are crustal ages in million years. (a) Sketch showing internalflexuring of the subducting plates. The light dotted rectangle in the main figure depicts the sketched portion of the subduction.
Figure 4. Slab bending depicted as a hypothetical contorted surface. The drawings represent the subduction and bending of Farallon and Nazca plates from three different perspectives. The margin convexity (concavity from the perspective of the continental plate) forces the slab toflex and shorten at depth which accumulates stresses in most strained areas. Present-day position of the Grijalva rifted margin at the trench coincides with a noticeable inflection point of the trench axis (in red). A horizontal grid has been added to help visualize the plates dipping angles. A transparent 100 km thick volume has been added below the contorted surface to simulate the plate, but at intermediate depths the depicted surface should be representing the plate inner section. (a) South to north perspective showing the different dipping angles of Farallon and Nazca plates. The slab depth color scale is valid for the three drawings. (b) West to east oblique perspective at approximately the same angle as Nazca plate’s dip. The contortion of the Farallon plate at depth south of the Grijalva rifted margin is clearly noticeable from this perspective. (c) East to west perspective. Intermediate depth seismicity (50–300 km) from the instru-mental catalog [Beauval et al., 2013] is drawn at the reported hypocentral depth. Two areas of maximum strain in the Farallon plate are shown (hachured): the El Puyo seismic cluster (SC) and the 100–130 km depth stretch of high moment release seismicity related to a potential hinge in the subducting plate. Lack of seismicity in the Nazca plate is explained due to the fact that this young plate, even though it is also strained, is too hot for brittle rupture.
A short 3-D animation showing a hypothetical contorted surface representing the subducting slabs is included as Movie S1 supporting information.
In order to explore the slab’s dipping angles across the Nazca-Farallon boundary, four 50 km wide cross sections with azimuths parallel to the Nazca plate’s convergence direction are shown in Figure 5. Sections A-A′ and B-B′ include hypocenters exclusively located in the Nazca plate, while section D-D′ corresponds to events in the Farallon plate; the remaining section C-C′ has events in both (Figure 2b).
Two aspects clearly stand out in cross sections A-A and B-B′ (Figure 5) and in Figure 2b. Inslab Nazca plate seis-micity is not observable below the Ecuadorian volcanic arc, stopping abruptly about 240 km east of the trench, and is not deeper than 140 km. There is only a conspicuous small volume-small energy seismic cluster at 0.9°S, 79.1°W in section B-B′—named here La Maná cluster—with magnitudes Mw<4. The almost complete absence of seismicity below the Ecuadorian volcanic arc precludes us from proposing a dip for the younger Nazca plate from cross section A-A′ below central and northern Ecuador by looking exclusively at the recorded earthquakes. The fact that active volcanism is present above the aseismic segments indicates that the plate continues to dip eastwardly. As Syracuse and Abers [2006] point out, it has been extensively discussed in the literature that the top of the slab below the front arc volcanoes is at a depth of roughly 100–120 km and that this depth is the same for all subduction zones, regardless of slab dip and plate age [Davies and Stevenson, 1992]. If these values hold for the Ecuadorian front arc volcanoes, the young Nazca plate should be dipping at about 20°, if the upper earthquakes of La Maná cluster were used along with the mentioned depth to define the slab top as seen in section B-B′ (Figure 5). By analogy, Nazca is probably dipping with the same angle below the active volcanic arc in northern Ecuador and southernmost Colombia (section A-A′; Figure 5). The lack of seismicity is probably related to the age of this subducted portion of the Nazca plate, since in young plates, intermediate-depth seis-micity is largely absent [Syracuse and Abers, 2006]. Earthquakes with Mw >6 only reappear north of 2°N,
although they are far less abundant than in the older Farallon plate (Figure 2b).
Immediately south of the Grijalva rifted margin, i.e., in the Farallon plate domain, inslab seismicity in section D-D′ indicates a gently dipping slab (~12°) that can be traced for more than 600 km inland (Figure 5). This dip differs from the 28° angle reported by Tavera et al. [2006] 200 km to the south. Seismicity in section C-C′ cannot be interpreted as a single slab profile, since it comprises events from both Nazca and Farallon plates. Besides, the El Puyo seismic cluster is part of a contorted portion of the older slab and is anomalously deeper than the rest of the Farallon slab directly to the south (Figures 2b and 5). The Nazca dipping angles mentioned above in the literature review are thus systematically overestimated, once the El Puyo cluster is included as part of the Nazca plate seismicity.
Here we analyze the location of the El Puyo seismic cluster in relationship with the convex Ecuadorian margin. It is surprising that the horizontal distance from El Puyo cluster to any point along the trench for approxi-mately 350 km, from ~1.3°S to ~1.3°N, varies only 5%. Thus, the curving trench describes an almost perfect circle’s arc centered upon the El Puyo cluster as drawn in Figure 3. Any slab’s dipping angle determined from cross sections perpendicular to the trench along these latitudes will be invariant. Those cross sections inter-sect the inland prolongation of Grijalva ridge, thereby creating a false spatial association between shallower Nazca plate earthquakes at the trench with intermediate-depth Farallon plate earthquakes at the El Puyo seis-mic cluster to the east (cross section C-C′; Figure 5). This in turn defines an apparently continuous slab with dipping angles around 25°. Consequently, we consider that hypocenters in the El Puyo seismic cluster should not be associated with eastward dipping Nazca plate interface events for slab description purposes but should be treated separately.
2.2.4. Oblique Convergence Tectonics
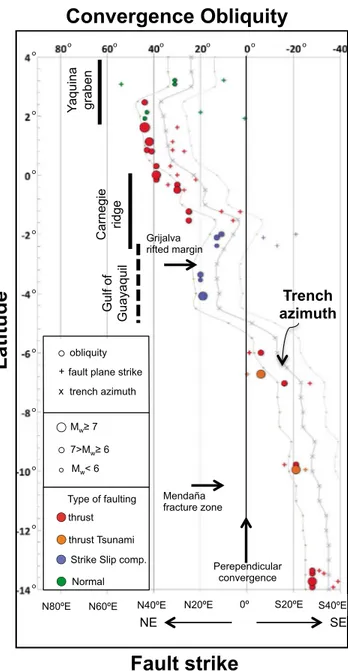
In the context of convexity of the northwestern South American margin and the subsequent oblique conver-gence, in Figure 6 we have compared obliquity with the trench azimuth and with fault plane strikes of inter-face earthquakes. We observe that the total change in obliquity is about 60° in the 1200 km from 2°N to 10°S. Perpendicular convergence is taking place at around 5°S latitude where null partitioning is expected. North of 5°S, i.e., in Ecuadorian territory, there is a gradual, northward increase in obliquity that reaches its maximum value north of the Carnegie ridge. In Peru, south of 5°S latitude, the trench rapidly assumes a southeasterly direction and obliquity is negative, remaining invariant south of the Mendaña fracture zone (Figure 6). Both partitioning and coupling transfer the trench-parallel shear stresses to the continental crust, thereby inducing northeastward motion of the fore-arc north of the Gulf of Guayaquil and southeastward movement
Figure 5. Vertical cross sections (50 km wide) showing instrumental seismicity. Seismicity is from Beauval et al. [2013]. Cross-section location is marked in Figure 2b. Colors reflect hypocentral depth. Solid triangles are active late Holocene volcanoes; open triangles are Holocene dormant volcanoes. The vertical line in cross section C-C′ shows the approximate contact between Nazca and Farallon plates. The shaded areas capture the general dip of the plate or of portions of it distinguishable through seismicity: for B-B′, the dipping angle is obtained using magma-generating conditions (see text); for C-C′, the angle reflects El Puyo cluster apparent dip as result of plate contortion; and for D-D′, the general dipping trend of tearing seismicity inside the plate has been measured. The upper topographic profile shows a generalized topography for Ecuador north of 2°S latitude. CP = Coastal Cordillera; WC = Western Cordillera; ID = inter-Andean Depression; EC = Eastern Cordillera; ESB = Eastern sub-Andean Belt.
south of it. Partitioning reaches similar levels at around 20–25% in both domains [Nocquet et al., 2014]. As a result of this, the NAB is moving as a rigid block toward the northeast, while a newly defined conti-nental sliver—the Inca sliver proposed by Nocquet et al. [2014]—is moving to the southeast (Figure 1) and prompting the opening of the gulf. Based upon observed GPS data and the geodetic velocityfield in Ecuador [Trenkamp et al., 2002; White et al., 2003; Freymueller et al., 1993; Nocquet et al., 2009], general consensus is achieved on ~7 ± 2 mm yr 1 northeast-ward motion of the NAB relative to South America [Nocquet et al., 2009; Egbue and Kellogg, 2010; Nocquet et al., 2014]. In Ecuador, the NAB translation takes place along a narrow corridor of crustal deformation—the Chingual-Cosanga-Pallatanga-Puná (CCPP) transpressive right-lateral system—that sharply deter-mines the limit of the block with the rest of stable South America [Ego et al., 1996b; Alvarado et al., 2016] (Figure 7) and is the loci of large earthquakes [Beauval et al., 2010; Baize et al., 2014]. Soulas et al. [1991], based on morphody-namic analysis, were the first to depict these four major active fault subsystems and their deformation rates in continental Ecuador. Several authors [Winter et al., 1993; Lavenu et al., 1995; Ego et al., 1996a; White et al., 2003; Dumont et al., 2005; Tibaldi et al., 2007; Fiorini and Tibaldi, 2012; Baize et al., 2014; Alvarado et al., 2016] have described in further detail various aspects of the fault systems and given different tectonic interpreta-tions, but the first proposed picture remains unchanged.
By contrast, in southern and central Colombia convergence obliquity decreases rapidly (Figure 6) and internal deformation in the block appears to be related to the complex interaction of the paleo-Caribbean, Nazca, and South American plates and the Panama micro-plate [Ego et al., 1996b; Taboada et al., 2000]. Major strike-slip faults resulting from this deformation, such as the Cauca-Patía and Romeral fault systems, run parallel to the NNE-SSW striking Andes. This fault trend turns to a N-S orientation from ~0° latitude to the south and adopts a reverse dip-slip movement [Ego et al., 1995] (Figure 7), joining the NAB boundary in central Ecuador. In northern Ecuador the NNE-SSW strike-slip faults of El Angel belong to thisfirst-order tectonic structure [Ego et al., 1995; Taboada et al., 2000].
Figure 6. Convergence obliquity. Circles represent obliquity values calculated at each epicentral latitude for Mw≥6 earthquakes. Plus signs
represent ruptured fault plane strikes obtained from focal mechanisms assuming the most probable fault plane candidate. We have used the Harvard focal mechanism catalog (http://www.globalcmt.org) from 1976 to 2013. Colors indicate focal mechanism. Tsunami events are highlighted, but they also correspond to thrust events. Light gray lines are the trench azimuth (crosses) ± 10% error. Notice the good agreement between fault strike and trench azimuth for thrust interface events. Some Mw<6
earth-quakes have been included to show lack of agreement for noninterface events such as the Yaquina graben normal and the Grijalva rifted margin strike-slip events.
To the east and southeast of the NAB-South American boundary, shortening across the active Andean back arc is taking place along the easternmost thrust-and-fold belts (ESB) [Ego et al., 1996b; Bès de Berc et al., 2005], i.e., the Napo and Cutucu uplifts, and along thrust faults on the eastern slopes of the Eastern Cordillera, such as the Macas fault system [Alvarado et al., 2016] (Figure 7). The belt’s N10 general direction is approximately parallel to the trench between 1°S and 5°S latitudes, where obliquity is smaller (Figure 6). This favors thrust
Figure 7. Main crustal fault systems in Ecuador (modified from Alvarado et al. [2016]). Thick continuous lines indicate the North Andean Block east boundary—CCPP—composed by four major transpressive segments from NE to SW: Ch = Chingual, Co = Cosanga, Pa = Pallatanga, and Pu = Puná. The type of faulting is determined by faults’ orientation and is mainly right-lateral strike-slip and reverse. The thick-dotted line represents the northeastward continuation of the system not modeled for this study. Double-dotted-dashed lines indicate the Eastern sub-Andean thrust-and-folds Belt (ESB) divided in two main uplifts: N = Napo and Cu = Cutucu separated by the PD = Pastaza Depression. The M = Macas fault system is considered to be part of ancient tectonic systems that may have been reactivated by present-day tectonics. All three families show compressional deformation. Dashed lines indicate that the Quito-Latacunga fault system (Q-L) is related to blind thrusts separated in two main segments: Q = Quito and L = Latacunga. Reverse faulting is dominant throughout the system. Single-dotted-dashed lines indicate that the El Angel fault system (EA) comprises a series of right-lateral strike-slip faults and could be part of the Romeral–Cauca-Patía major fault system in Colombia (R-CP; thin-dotted line). Parallel segments go from B = Buesaco to Na = Nanegalito. Three-dotted lines indicate the low-angle detachment normal faults in the Gulf of Guayaquil (GGYE) continental margin simplified from Bourgois [2013]. Thin lines are the complete inventory of cataloged faults, folds, and lineaments by Egüez et al. [2003].
faulting due to a larger trench-perpendicular partitioning of the plate movement than that to the north. The Southern Ecuador-northern Peru Andes seem to be entirely included in the Inca sliver, if its boundary lies along the thrust-and-fold belts as proposed by Nocquet et al. [2014]. The sliver shows a fairly constant 4.5–6.0 mm yr 1 southeastward motion between latitudes 3°S and 10°S (Figure 1), but a major, single, continental size structure that takes up most of the deformation has not been identified yet, as is the case with the NAB.
To the west of the NAB boundary, moderate historical earthquakes (Mw≤ 6) are associated with thrust faults
concentrated along the western internal slopes of the inter-Andean Depression from 0.5°N to 1.7°S latitudes, collectively known as the Quito-Latacunga fault system (Figure 7) [Ego et al., 1995; Beauval et al., 2010; Alvarado et al., 2014]. At these latitudes convergence obliquity rapidly decreases from north to south (Figure 6), promoting a compressional environment. The Depression is a compressional basin (“push-down” type) bounded by N-S trending reverse faults which have been active since the Miocene at a shortening rate of 1.4 ± 0.3 mm yr 1. Lavenu et al. [1995] and Alvarado et al. [2016] postulate that these faults are related to internal deformation of the NAB at a rate of 1 to 4 mm yr 1. North of 0° latitude newly described strike-slip faults by Alvarado et al. [2014] could be transferring the regional strain from the compressive Q-L faults to CCPP’s Chingual strike-slip faults or to the Romeral–Cauca-Patia fault systems in Colombia as part of a major transpres-sive dextral zone proposed by some authors [e.g., Ego et al., 1995; Ego and Sébrier, 1996; Taboada et al., 2000] (Figure 7).
3. Construction of a New Seismic Source Zones Model for Ecuador
Our new interpretation of the geodynamic and seismotectonic scheme for Ecuador is fundamental for de fin-ing the new seismic source zones model presented here. The model comprises the region from 4°N to 6°S and from 75°W to 82°W and covers Ecuador, southern Colombia, and northern Perú.
In this section we describe 19 seismicity source zones (SSZs)—three interface, six inslab, nine crustal, and one outer trench zones. Each SSZ has a homogeneous seismogenic potential; they contain all Mw≥ 5 cataloged
events. Interface and subducting inslab sources are bounded by limits that reflect, as much as possible, physical features in the interface or in the subducting plate that could condition earthquake generation and/or rupture propagation in agreement with the geodynamic model. On the other hand, crustal sources are described by the main tectonic structures and by the shallow seismicity related to brittle fracture in the crust. We have also defined small complementary SSZs—all of them below the main interface zones— as a means of grouping seismicity not included in the interface SSZs. This seismicity may reflect inaccuracies in hypocentral locations or tectonic complexities not included in the main zones. We let PSHA practitioners do the option to include it in the sources or to treat it as background seismicity.
In the following pages we briefly describe the criteria used to define and limit the seismic source zones. Schematic descriptions, parameters, and boundaries for each zone are provided as Table S1 in the supporting information. In Table S1, we provide further details on some of the most significant sources for each tectonic domain, chosen as typical examples of the approach we have followed. The criteria include morphotectonic aspects and/or neotectonic and structural features of major faults or subduction segments, as well as seismic, geodetic, paleoseismic, and other geophysical features. Every historical earthquake reported in Beauval et al. [2010] is correlated with a specific source zone. The same is true for large and great earthquakes of the instru-mental part of the catalog. A predominant focal mechanism is identified for each source. Focal mechanism solutions are obtained either from the Harvard centroid moment tensor (CMT) catalogue [Dziewonski et al., 1981] or from specific individual studies. If different types of focal mechanisms are reported for the same source zone, all of them are shown, but only one faulting style is identified as predominant. This style reflects structural/tectonic evidence collected in the literature or from our ownfield observations. Simple statistics related to hypocentral data are used to obtain the mean depth for each source. The moment release density (Mo per unit volume normalized for 100 years) was calculated for each source as a way to have afirsthand approximation of their seismic activity; the sources were colored accordingly.
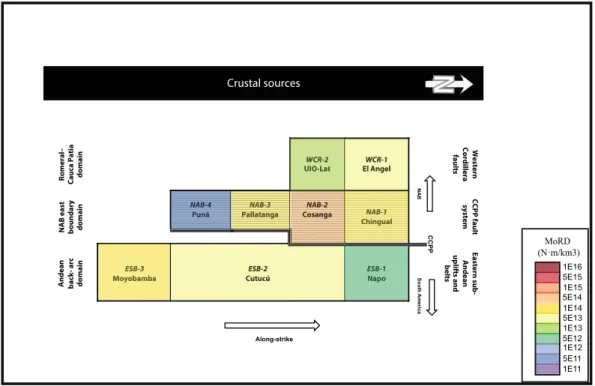
In Figures 8 and 11 we present schematic views of subduction and crustal SSZ, respectively, with the names, codes, and relative position of the sources and of the dominant structures. These schemes serve as a guide for identifying the sources in the following discussion.
3.1. Interface Megathrust Sources
Along the Ecuadorian margin, interface sources encompass seismicity recorded from the trench to the down-dip edge of the seismogenic zone. For great megathrust earthquakes such as the Esmeraldas 1906 event, this depth could reach to 45–55 km as observed in the Sumatra, Chile, and Japan megaearthquakes during the 21st century [Lay et al., 2012]. For the smaller Mw<8 events the interface rupture could reach depths around 35 km, according to the present interseismic coupling [Chlieh et al., 2014] (Figure 8).
3.1.1. Esmeraldas SMT-1
During the twentieth century, four Mw7.6 to 8.8 thrust earthquakes repeatedly ruptured segments of an
~500 km long stretch of the subduction zone north of the Carnegie ridge (Figure 9). For a comprehensive description of the NW Ecuador-SW Colombia twentieth century large earthquake sequence, please refer to Chlieh et al. [2014].
The Mw8.8 1906 earthquake defines the Esmeraldas SMT-1 interface megathrust source zone. To look for possible boundaries for the southern limit of the 1906 rupture, several studies have been reviewed. Based upon so-called“marginal evidence,” Kelleher [1972] drew the southern termination of the great 1906 mega-thrust event at 0° latitude. Kanamori and McNally [1982], quoting Rudolph and Szirtes [1911], suggested that the rupture zone did not extend farther south beyond Kelleher’s limit, based on the intensity distribution. Again, based on the relocation of aftershocks by Mendoza and Dewey [1984], Swenson and Beck [1996] sug-gested that it was unlikely that the 1906 rupture propagated south of 0°, by observing the 1942 Mw 7.8
aftershock zone and taking into account the presence of the Carnegie ridge. Collot et al. [2004] proposed a different southern termination of the 1906 and 1942 earthquake rupture zones, coinciding with the offshore extension of the ancient Jama-Quininde fault and with the probable inland location of the Carnegie ridge crest (approximately at 0.5°S latitude). This limit is ~50 km south of the previously assumed limit (Figure 9). From this review, it is clear that the 200 km wide Carnegie ridge constitutes a barrier for large Ecuadorian earthquakes to propagate southward, similar to other subducting bathymetric features along the South American subduction zone [Bilek, 2010].
Figure 8. Schematic representation of interface and inslab SSZs. Along-dip and along-strike domains have been defined for interface and inslab sources. Along dip, the deeper portion of the megathrust seismogenic zone defines interface segments and separates them from inslab sources. Along strike, sources are defined by distinguishable intermediate-depth seismicity distribution and earthquake focal mechanisms constrained by rheological conditions of the subducting plates. Older Farallon and younger Nazca plate domains are adopted, with the Grijalva rifted margin marking the separation between the two. SSZs are colored according to their Mo release density (MoRD).
Let us further explore along the Carnegie ridge interface. There are three Mw~7 epicenters south of the
1906 and 1942 rupture zones, referred to hereafter as the Bahía earthquake zone (BEZ): the 1998 Mw7.1,
the 1956 Mw 6.95, and the 1896 M~7 (assumed magnitude based on a similarities with the other two
events; this earthquake happened 10 years before the 1906 earthquake). Keller [2014] analyzed the intensity distribution of the 1896 earthquake applying the Bakun [2005] method; however, it was not possible to
Figure 9. Interface seismogenic source zones. The three sources are the outlined polygons. Continuous thick lines off the Esmeraldas trench represent the rupture length of Mw≥7 earthquakes; the dashed line represents the 1906 earthquake
probable rupture. Colored contours show distribution of the interseismic coupling (ISC) modified from Chlieh et al. [2014]. ISC values vary from 0 to 1. The dotted line is the proposed inland location of Carnegie ridge crest; thin lines are the traces of the ancient Jama-Quininde fault, both after Collot et al. [2004]. BEZ = Bahía earthquakes zone comprising 1998, 1956, and 1896 events; the shadowed area corresponds to well-located aftershocks for the 1998 earthquake. Circles and stars correspond to seismicity presented in Figure 2a.
provide an accurate location for the event due to shortcomings in the input data. Since the intensities of the 1896 event are distributed in a pattern similar to those of the 1998 event, including liquefaction, the rupture plane of this earthquake is assumed to belong to the BEZ. The BEZ as shown in Figure 9 is defined by the well-located aftershocks from the 1998 main shock [Font et al., 2013]. The southern limit of the 1906 rupture zone proposed by Collot et al. [2004] falls in the middle of the 1998 event rupture plane. Considering the three earthquakes, the BEZ asperity is showing a characteristic behavior with a M≈ 7 event every 50 ± 10 years. Since the BEZ source seems to behave independently of the northern megathrust, the southern boundary of Esmeraldas SMT-1 is herein defined as the northern boundary of the BEZ (Figure 9). South of the BEZ asperity the coupling model proposed by Chlieh et al. [2014] predicts a 50 km wide creep-ing corridor that could also have marked the southern limit of the 1906 rupture. In such a case the BEZ asperity would have also failed, and our interpretation would require a second scenario for the SMT-1 southern boundary.
With regard to the northern limit of SMT-1 (~4°N), the Colombia trench abruptly changes its azimuth from NE-SW to ~N-S. Buenaventura, a seaport at 3.9°N (Figure 1), still experienced 1.6 m of subsidence as a result of the 1906 rupture [Herd et al., 1981]. However, the rupture probably did not propagate north of the trench’s sharp bend. At this same latitude, the Malpelo ridge rifting scarp could be projected inland [Lonsdale, 2005], which means that an across-strike discontinuity in the Nazca subducting slab could have stopped the northern propagation of the 1906 rupture. Therefore, we set the boundary at the discontinuity.
Updip and downdip limits of the seismogenic part of the megathrust interface define the thickness of the EMS-1 seismic source zone. The 50 km boundary is defining the downdip limit of the Esmeraldas SMT-1 zone. We consider that the updip limit reaches the trench, since all of the large and great earthquakes of the zone, except the 1942 event, have generated tsunamis.
The quality of the hypocentral solutions in the catalog does not help us to clearly differentiate between intra-plate and overriding intra-plate events. In an offshore and onshore passive seismic experiment, Manchuel et al. [2011] showed that at the Ecuadorian fore-arc region hypocentral depths reach at least 40 km but do not clus-ter along crustal active structures. On the other hand, it has not been possible to distinguish between off-shore splay fault seismicity and interplate seismicity either, although Collot et al. [2004] proposed that the Mw 7.6 1958 earthquake ruptured along one of these splay-fault structures and not at the interface.
Therefore, for practical reasons, all the 0–50 km depth seismicity in the fore arc is incorporated in SMT-1 and will be modeled as interface seismicity.
3.1.2. Bahía SMT-2 and Talara SMT-3
The SMT-2 Bahía source zone, already referred to in the previous section, includes the BEZ and the highly coupled asperity of La Plata island [Vallée et al., 2013; Chlieh et al., 2014] (Figure 9). SMT-2 is considered a tran-sition zone linking the strongly locked SMT-1 with the SMT-3 Talara zone that shows weak to negligible interplate coupling.
According to the geodetic model presented by Nocquet et al. [2014] an ~1000 km along-strike segment of the plate interface—comprising southern Ecuador and northern Peru from the Gulf of Guayaquil to the Mendaña fracture zone at 10°S—slips predominantly aseismically. The intersection of the Grijalva rifted margin (which separates the Farallon and Nazca domains; Figures 7 and 8) with the trench marks the termination of the interface’s strongly coupled segment modeled by Nocquet et al. [2014, Figure 3]; therefore, we let the northern boundary of the Talara SMT-3 zone to coincide with the inland prolongation of the Grijalva rifted margin. The Talara SMT-3 zone could be extended south at least the projection of the Viru fracture zone into the continent (7.5°S [Lonsdale, 2005, Figure 1]); however, it is artificially closed at 6°S, the southern limit of our study.
Talara SMT-3 could be considered a tsunami generating source zone due to the occurrence of two tsunami-genic events: the rare 1960 Mw7.8 one (Figure 2a) and the Mw7.5 1996 earthquake located just north of
Mendaña [e.g., Bilek, 2010] (Figure 6). Their presence implies that ruptures in this segment could start at shal-low depths and proceed updip, generating large slips but rather shal-low frequencies, as described by Lay et al. [2012]. This tsunamigenic character of SMT-3 has been described through an alternative velocityfield model also permitted by GPS data showing interseismic coupling close to the trench [Nocquet et al., 2014, Figure 3c]. This alternative model resolves the strain accumulation in this ~1000 km long segment by means of a weak,
shallow (<20 km) interseismic coupling and a very weak to zero coupling at the usual seismogenic depths (20–45 km) from the Grijalva rifted margin to the Mendaña fracture zone. This coupling mode satisfactorily explains tsunamigenic earthquakes, but it also precludes the accumulation of elastic strain over the entire seismogenic interface necessary to produce Mw∼9 megaearthquakes.
Alternatively, Bourgois et al. [2007, 2011] performing geomorphic analyses of coastal landforms close to the Talara cluster area proposed a 1300–1437 year recurrence rate for major earthquakes during at least the upper part of the Quaternary. Their analyses are based on erosional notches observed in anomalously fast uplifted terraces produced by successive stands of sea level during the late Quaternary, although Pedoja et al. [2011] have questioned these results. Present-day elastic strain accumulation—as interpreted from GPS measurements—may not support the occurrence of the megaearthquakes suggested by Bourgois et al. [2007] based on their interpretation of the geologic record, but our understanding of the earthquakes sources in this and other subduction segments is so limited that, as a conservative approach to PSHA, the maximum earthquake size may be constrained only by the maximum length over which a coherent fault rup-ture may develop, as stated by Okal [2010], with recurrence times in the order of 1–2 millennia, as proposed by Bourgois et al. [2007].
The two Mw>7 earthquakes that have been recorded at the southern edge of the Gulf of Guayaquil (Figure 2a)
are thought to belong to the Talara cluster area (Mw7.6 1953 and Mw7.2 1970; Figure 9). The origin and
precise depth distribution of the cluster is not yet resolved. These large events could have ruptured the sub-duction megathrust [Suarez et al., 1983] or continental slope detachments in the Gulf of Guayaquil [Bourgois, 2013], although von Huene et al. [1989] and Bourgois et al. [1993] favor a rotational landslide origin for similar detachments identified south of Talara without the release of Mw≥ 7 equivalent seismic energy.
3.2. Inslab Sources
Inslab SSZs border intermediate-depth seismicity. Notwithstanding that the seismic catalog used for this study contains the best available hypocentral locations, the seismicity is far from showing clear, neat Wadati-Benioff zones to define the shapes of individual segments in the Farallon plate. On the other hand, the Nazca plate is not prolific in generating intermediate-depth earthquakes and the dipping slab cannot be recognized solely from seismicity.
3.2.1. Farallon ISF Sources
As hypocentral depth distribution and moment release vary along dip inside the Farallon plate (Figure 2b), four horizontal volumetric source zones of the inslab Farallon have been defined. The zones correspond to layers of seismicity of increasing depth toward the east and northeast (Figures 8 and 10). According to our model, apart from contortion, the plate is dipping gently (12° on average) and is traceable eastward for over 600 km from the trench (Figure 5). Therefore, there is an overlap of the modeled sources, as observed on the map view of Figure 10.
Most of the seismic moment is being released within a slim, 30 km thick layer (Morona ISF-3) at depths from 100 to 130 km. This zone tries to capture the seismicity probably being generated along a kink in the subducting slab as mentioned before. The Loreto ISF-4 SSZ contains deeper seismicity in the overlapped portion underneath Morona ISF-3 and is prolonged all the way to fragile portion of the subducted slab at ~180 km depth. The El Puyo SSZ—Puyo ISF-5(Figures 2b and 10)—reproduces the seismicity generated in the contorted northeastern tip of Farallon (Figure 5c) and deepens from 130 km to at least to 250 km. It releases one third of the energy of Morona ISF-3. By modeling Farallon subduction with thin horizontal sources, the total source volume has been reduced in comparison to modeling a 600 km wide and 200 km thick single body, thus aiming for a better representation of seismic distribution for upcoming PSHA calculations. A second possibility was to model this seismicity as single dipping parallelepiped, in which case all the details worked out in thefirst part of this paper would have been absorbed in one single volume. In any case, the impact of our decision to model horizontal sources will be weighted during the hazard calculations.
3.2.2. Nazca ISN Sources
North of the Grijalva rifted margin, intermediate-depth seismic moment release is very small in comparison to that of the Farallon plate’s (Figures 2b and 3). The Sub-Volcanic Arc source, ISN-5, has been defined to include events located east of the interface megathrust and below the volcanic arc, although very little seismicity is generated in this warmer part of the subducting slab.
Intermediate-depth seismicity is somehow more energetic north of ~2°N (Figure 2b) where it could be related to the normal dipping segment of the Nazca plate south of the Caldas tear (~5°N [Vargas and Mann, 2013]). A second source ISN-4 is modeled, separated from the ISN-5 Sub-Volcanic Arc by the inland projection of the Malpelo paleorift [Lonsdale, 2005, Figure 10] (Figures 1 and 10).
Figure 10. Inslab seismogenic source zones. Seven inslab SSZs have been defined along with three complementary sources (see the text for explanation). SSZs are colored according to their Mo release density (MoRD). Farallon slab zones are overlapped as seen in Figure 9a. Only colors in the“visible” part of the plate in plan view are shown as original. They are identified by three labels: source zone name and depth range, western boundary (W), and eastern boundary (E). Nazca plate SSZs are not overlapped. Complementary zones below the interface SSZs are hachured. Yellow triangles are active late Holocene volcanoes. Circles and stars correspond to seismicity presented in Figure 2b. (a) A-B 150 km wide cross section in Farallon domain to show how plates overlap. (b) Normal faulting, shallow (Z≤ 50 km) focal mechanisms related to the Yaquina graben extracted from the Harvard global centroid moment tensor catalog [Dziewonski et al., 1981] from 1976 to 2013. Focal mechanisms correspond mainly to internal tearing. Outer trench bending is ruled out as the cause for normal faulting since dilatational focal mechanisms are obviously present east of the trench, where the slab is already plunging with normal angles and is not subjected to bending forces.
A very conspicuous shallow seismicity is present between the Yaquina graben crest and the trench (Figure 2a). Its seaward trench location is anomalous and unique along the South American trench. The normal faulting focal mechanisms that characterize this seismicity are also anomalous, appearing west of the trench as well as in the interface megathrust source zone (Figure 10b). This unusual seismicity is modeled as the OUT-1 Yaquina source zone (Figures 8 and 10).
3.3. Crustal Sources
According to the description given for oblique convergence tectonics, crustal sources have been classified in three main domains: (a) the NAB east boundary domain that encompasses strike-slip and reverse faulting (accounting for the sliver’s NNE movement), (b) the Romeral–Cauca-Patía domain (Figure 7) including the western Colombian Andes and the Ecuadorian Western Cordillera down to 1.5°S, and (c) the Andean back-arc domain where east verging fold belts on top of blind thrusts absorb shortening. A schematic representa-tion and the geographical locarepresenta-tion of crustal source zones are shown in Figures 11 and 12. In Table S1 greater detail about individual sources is presented and is complementary to the description below.
3.3.1. Chingual-Cosanga-Pallatanga-Puná Fault System
The NAB eastern boundary includes four segments (Chingual, Cosanga, Pallatanga, and Puná [Alvarado et al., 2016]) and has been defined as the CCPP fault system (Figures 7 and 12). The CCPP shows general displace-ment rates on the order of 7 ± 2 mm yr 1from published GPS results and 7.6 mm yr 1as an estimated mean geologic slip rate for thefinal part of the Pleistocene [Egbue and Kellogg, 2010]. According to other authors [Tibaldi et al., 2007], those estimates could peak to 11.9 ± 0.7 mm yr 1in the northernmost segment, also from geologic indicators.
The Chingual NAB-1 source has a NNE orientation and therefore is considered to be mostly of strike-slip nat-ure (Fignat-ure 12). We have placed its northern limit at the Sibundoy pull-apart [Soulas et al., 1991], but the fault system continues further north along the east Andean front [Ego et al., 1995; Tibaldi et al., 2007]. In 1834 a MIC
7.4 earthquake [Beauval et al., 2013] destroyed the Sibundoy area, but very little seismic activity is recogniz-able along NAB-1 at present times (Figures 2a and 12). The southern limit abuts with the next segment (NAB-2) at the zone where the CCPP fault system changes direction and runs parallel to the Andean chain.
Figure 11. Schematic representation of crustal SSZs. The North Andean Block (NAB) and South American plate boundary is shown as the CCPP fault system. Shadowed sources represent the boundary sources. SSZs are colored according to their Mo release density (MoRD).
The Cosanga NAB-2 source is aligned N10° (Figure 12). The tectonic structures show mainly transpressive beha-vior. Its northern portion has experienced two Mw~7 earthquakes during the last 60 years (1955 and 1987). The southern end has been drawn to include the southern termination of the Cosanga thrust [Bès de Berc et al., 2005] as well as Mw>5 earthquakes that show transpressive focal mechanisms (e.g., September 1987 Mw6.3
event and March 1987 shock; both most likely on the same fault system). The Pisayambo seismic cluster (Figure 11a) is not included in NAB-2.
Figure 12. Crustal seismogenic source zones. Nine crustal SSZs are defined. Polygons are colored according to the seismic moment release density MoRD for each source. Interface SSZs (hachured lines) have been included to show spatial rela-tionship with crustal sources. The black continuous lines are main crustal fault systems shown in Figure 7. Discontinued lines in the Gulf of Guayaquil area are detachments from Bourgois [2013]. Pentagons represent historical epicenters relo-cated by Beauval et al. [2010]. Their sizes reflect magnitude classes. MICis the magnitude determined at the Intensity Center
and is equivalent to Mw. White numbers are years when historical events occurred. Letters are main cities: I = Ibarra;
Q = Quito; L = Latacunga; A = Ambato; R = Riobamba. (a) Shallow seismicity (Z≤ 35 km) moment release per unit area in the inter-Andean Depression. The instrumental catalog (1900–2009) is used [Beauval et al., 2013]. The unit area is a 5 × 5 km pixel, approximately equivalent to the rupture area of a Mw5.0 earthquake. Pixels are colored with a“saturation color” if the
sum of all the seismic moments from events with epicentral location within the pixel reaches Mo≥ 1014N• m, which is close to Mw3.25. By this artifice it is possible to highlight the areas where microseismicity is occurring. The white-dotted
polygons are SSZ. The yellow and blue lines are Pujili and Chimbo-Toachi sutures modified from Hughes and Pilatasig [2002]. Letters refer to fault systems described in Figure 7.
![Figure 3. Focal mechanisms for intermediate-depth earthquakes (55 km < Z ≤ 300 km) obtained from the Harvard global centroid moment tensor catalog [Dziewonski et al., 1981] from 1976 to 2013](https://thumb-eu.123doks.com/thumbv2/123doknet/12932224.374201/9.918.267.862.135.743/figure-mechanisms-intermediate-earthquakes-obtained-harvard-centroid-dziewonski.webp)