HAL Id: hal-02795810
https://hal.inrae.fr/hal-02795810
Submitted on 5 Jun 2020HAL is a multi-disciplinary open access archive for the deposit and dissemination of sci-entific research documents, whether they are pub-lished or not. The documents may come from teaching and research institutions in France or abroad, or from public or private research centers.
L’archive ouverte pluridisciplinaire HAL, est destinée au dépôt et à la diffusion de documents scientifiques de niveau recherche, publiés ou non, émanant des établissements d’enseignement et de recherche français ou étrangers, des laboratoires publics ou privés.
properties between Eucalyptus and poplar
Véronique Jorge, Jean-Marc Gion
To cite this version:
Véronique Jorge, Jean-Marc Gion. WP3 - Comparative mapping architecture of wood properties between Eucalyptus and poplar. 2015. �hal-02795810�
Abstract
Fast-‐growing tree species such as poplar and eucalypts represent one of the most appealing sources of renewable biomass feedstock for Northern/Western and Southern Europe as they produce high yields of lignocellulosic biomass. Because the chemical and structural composition of lignified secondary cell walls render woody feedstocks particularly recalcitrant to degradation, improved genetic material is needed to use these energy crops in an efficient manner. The overall goal of TREEFORJOULES was to identify genes regulating relevant cell wall properties before moving on to identify the specific desirable allelic variants for breeding. Here are described the achievements made in the four different workpackages: In WP1, New transcriptomic data (RNASeq & miRNA libraries) dedicated to wood formation were generated for both in eucalypts and poplar. In silico integration and mining of these data allowed the selection of candidate transcription factors (TF) and miRNAs differentially expressed in contrasted wood samples. Constructs (overexpression, dominant repression and/or RNAi…) have been generated for 19 candidate TF in Eucalyptus and 25 in poplar (including 2 miRNAs). Transgenic poplar (and Arabidopsis lines) have been generated and some of them fully characterized at the biochemistry level highlighting promising candidates whose modulation of expression improve SCW composition and saccharification potential. The behavior of such promising lines in field conditions would be worth evaluated in the near future. In addition, a cryopreservation protocol was implemented for long-‐term storage of Eucalyptus/poplar transgenic lines, and a fast and versatile transformation system (hairy-‐roots) was set up to allow medium throughput functional characterization of Eucalyptus genes in an homologous system. The effects of environmental stresses (nitrogen fertilization, drought, salinity, seasonal variation and cold) were characterized on four different eucalyptus and four poplar genotypes at the phenotypic (biomass production), molecular and biochemistry levels gathering important information for future plantations and/or for breeding. In WP2, PLS_R models for high-‐throughput NIR spectroscopic methods for wood property measurements including all key cell wall constituents have been obtained and used for both Eucalyptus and poplar species at felling age and also on very young trees. A micro steam-‐treatment system was constructed and a suitable method was developed to treat samples prior to saccharification. In WP3, The colinearity between the E. grandis and P trichocarpa genomes was restricted to only several small regions. The resolution of available genetic maps using high-‐throughput genotyping methods has been increased and wood-‐related QTLs have been localized. In Eucalyptus, Chromosome 10 contains both a major QTL for S/G ratio and 10 eQTLs in both parents suggesting a role for both regulatory and structural genes in regulating wood properties. A dedicated website http://tfj.lrsv.ups-‐tlse.fr/ has been set up with a link to a database to store, mine, and integrate the high-‐throughput genomic, genetic, and phenotypic data
Table of content
WP1. Identification and functional characterization of Candidate Genes (CG)________ 4
Task 1.1 in silico identification of CGs from a compendia of expression data_____________ 4Subtask 1.1.1 Development of new transcriptomic resources ____________________________________________ 4 Subtask 1.1.2 Integration and data mining of transcriptomic resources_________________________________ 7 Task1.2 – Transcript profiling of selected CGs _________________________________________________ 9 Task1.3 Identification of transcriptional interactome_______________________________________ 13
Task 1.4 Functional characterization of a limited number of selected CGs_______________ 14
A new homologous stable transformation system for Eucalyptus_______________________________________14 Constructs and transformation for Eucalyptus candidate genes_________________________________________15 Constructs and transformation for Poplar candidate genes _____________________________________________19 Set up of a cryopreservation protocol for Eucalyptus and poplar transgenic lines ____________________25 Task 1.5 Environmental regulation of CGs and impact on biomass production and wood quality _______________________________________________________________________________________________ 26
Subtask 1.5.1 Selection of Eucalyptus and poplar genotypes ____________________________________________26 Subtask 1.5.2 Effect of environmental factors on CGs expression _______________________________________27 A-‐Nitrogen fertilization assay (P11): ___________________________________________________________________27 B-‐ Drought assay (P11).__________________________________________________________________________________30 C. Saline stress assay (P11/P13). _______________________________________________________________________31 D-‐ Cold Treatment and seasonal variation _____________________________________________________________35
WP2- CHARACTERIZATION OF WOOD & BIO-ENERGY POTENTIALS ____________________ 42
Task 2.1 Development and application of high throughput methodologies______________ 42Task 2.2 Bioenergy potentials, saccharification, and bio-oil_____________________________ 45
Networking activities:_______________________________________________________________________________________45 Lignin content and sugar composition ___________________________________________________________________45 Micro steam-treatment_____________________________________________________________________________________46 Analytical Pyrolysis-Gas Chromatography/Mass Spectroscopy______________________________________46 Preparative Mini-‐Pyrolysis _________________________________________________________________________________48 Task 2.3 Micro-phenotyping of transgenic wood zones through microscopic and
microspectrophotometric investigation methods__________________________________________ 49
WP3. COMPARATIVE ARCHITECTURE OF WOOD PROPERTIES BETWEEN EUCALYPTUS
AND POPLAR ______________________________________________________________________________________ 52
Task 3.1 Comparative Genomics between Eucalyptus and Populus _______________________ 52 Task 3.2 Comparative architecture of wood quality traits in Eucalyptus and Populus _ 55Subtask 3.2.1 QTL mapping for each mapping pedigree _________________________________________________55 Subtask 3.2.2 Meta QTL analysis and comparison with others QTL results ____________________________58 Task 3.3 A case study: Dissection of a major QTL for lignin______________________________________________59
WP1. Identification and functional characterization of Candidate Genes (CG)
The overall objective was to identify and characterize candidate genes (CGs) (focusing on transcription factors, miRNAs and their respective partners and/or targets) involved in the regulation of wood properties important for bioenergy in poplar (P) and eucalypts (E).Task 1.1 in silico identification of CGs from a compendia of expression data
Objective: In this task, we aimed to analyze in silico the transcriptomic data available publicly or within the consortium as well as the new resources generated during the project to select a reservoir of regulatory CGs potentially involved in secondary wall (SW) formation in E & P
Subtask 1.1.1 Development of new transcriptomic resources
P1 & P8 performed transcriptome analysis of developing wood of E. globulus clones GB3, MB3, and GM2-58, collected on upper side (tension wood, TW) and bottom side (opposite wood, OW) of trees bent for one week and 3 and 4 weeks (Carocha et al., in preparation, see Figure below). Plant material and experimental trials were made available by P7 (Altri Florestal).
Twelve RNA-seq libraries were prepared and sent to GenoToul platform for sequencing (HiSeq2000, Illumina). After cleaning and trimming the reads for quality, they were mapped against the E. grandis genome, in order to identify which loci where differentially expressed between tissue type and time of bending. We found 93 loci
differentially expressed between tension and opposite E. globulus wood forming tissues (3 clones), 88 of these genes were assigned each to a single E. grandis genome model gene. The major transcriptome remodeling occurred between tension and opposite wood, and to a lesser extent between bending times (Figure 1a). When we clustered samples by their transcriptomic profiles, we observed that samples were grouped in two major groups corresponding to the type of forming tissue (tension wood versus opposite wood (Figure 1b)) involving genes implicated in carbon reallocation between the two types of wood, and thus in the different strategies of secondary cell wall (SCW) biosynthesis.
Fig 1. a) Identification of pairwise significant genes between conditions (P<0.05); b) Clustering analysis of samples by their transcriptomic profile: S1WO – 1 week of bending and opposite side; S1WT – 1 week of bending and tension side; S34WO – pool of 3 and 4 weeks of bending and opposite side; S34WT – pool of 3 and 4 week of bending and tension side
These findings are in good agreement with chemical and anatomical analyses of differentiating xylem tissues of the same trees, indicating an enrichment in polysaccharide content relative to lignin (data obtain in collaboration with P9; WP2) in tension wood samples (Figure 2).
Fig 2. Principal components analysis (PCA) of the synthetic chemical variables
.
a) Correlation circle showing the position of nine selected variables from synthetic pyrolysis products on the PC1–PC2 plane. In the correlation circle pyrolysis products related with proteins are represented in green, lignins in red and polysaccharide in blue. Protein origin: aa1 (amino acid content) and H products (mainly protein but also from p-hydroxyphenyl lignin units origin). Lignin origin: G (guaiacyl units); S (syringyl units); Py_lignin (sum of H, G and S). From polysaccharide origin but main contributor cellulose: cH (hexosans); c (carbohydrates). hemicellulose origin: cP (pentosans). The ration cP/cH was also considered. b) Main plane (PC1–PC2) with the positional display of the differentiating xylem samples from tension (WT) and opposite wood (WO) kinetics (one to four weeks bending stress; S1-S4). PCA was performed using the ade4 library of the R package (Chessel et al.,2004).To identify which of these genes were also post-regulated by miRNAs, P8 crossed the list of differentially expressed genes with the list of genes target by miRNAs (degradome analysis). We identified six candidate genes targeted by miRNAs, including one Beta-6-tubulin known to be involved in cellulose microfibril orientation within the cell wall. P8 made available to the project 768 novel and conserved E. globulus miRNA candidates. Degradome libraries from tension wood (2) opposite wood (2) and control wood from non-bent trees (Carocha et al, in preparation).
P2 identified 5,869 putative miRNAs from tension wood (TW) and opposite wood (OW) tissues from 3 different poplar genotypes (P. deltoides x P. trichocarpa hybrids, P.
trichocarpa N°101 174 and Populus tremula x P. alba INRA clone #717 1B4). From these
predicted miRNAs, 213 were already described in mirbase corresponding to 46 families. Already described miRNAs in mirbase were well conserved between the different genotypes but a huge amount of unknown predicted miRNAs presented sequence variation between genotypes. In the ANR project “TROPIC” (2011-2015) a Degradome approach has been developed for the clone 717-1B4 in order to experimentally 1) identify the targets of these miRNA and 2) validate them as miRNA actors (Figure 3) (Gourcilleau et al, 2012, Gourcilleau et al., in preparation).
Fig 3. Comparison of miRNA prediction and degradome sequencing analysis. TW: tension wood;
miR397a appeared up-regulated in TW from clone 101-174 and only detectable in TW tissues of P. deltoides x P. trichocarpa hybrids. As this miRNA was predicted to targets laccases, enzymes putatively involved in lignin polymerization, it has been selected for functional analysis in poplar (see Task1.4) with the aim to decrease lignification by interfering with lignin polymerization (Gourcilleau et al, in preparation).
P5a performed a transcriptome sequencing analysis of developing wood in Populus
tremula x Populus tremuloides (Esch5) by Illumina High-Seq. 2000 (GenXPro, Frankfurt) and
identified 19,139 different transcripts, including 707 transcription factors/transcription regulators. P5a also prepared miRNA from total RNA by size-fractionation using gel filtration. In total, 191,214 different miRNA tags were generated by Illumina sequencing with HiSeq 2000 sequencer.
Subtask 1.1.2 Integration and data mining of transcriptomic resources
P1 built within the 34J web site (see WP4; tfj.lrsv.ups-tlse.fr/) a database with restricted access to integrate and mine transcriptomic resources mainly for Eucalyptus. For poplar, whose genome has been sequenced long ago, several tools to mine transcriptomic data are publicly available.
The online database contains RNAseq and high throughput qPCR data generated within this project (P1 & P8, subtask 1.1.1; task 1.2) as well as large in-house collections of wood-associated ESTs and transcriptomic data already generated in parallel projects. It provides to users both online graphical representation and analytical tools (Figure 4). The representation of transcriptomic datasets (heat maps and eFP browser adapted for 34J purposes) as well as statistical tools (PCA, clustering, correlation analyses and gene network) have been developed. The data mining using this tool allowed the screening of candidate genes with specific expression patterns (see below task 1.2). Options for sorting out list of genes presenting similar profiles and drawing targeted gene correlation networks have been implemented. Because one of the major aims of this project was to take advantage of sharing resources developed on Eucalyptus and Poplar, all the tools have been developed to allow further integration of datasets available on both trees. Beyond its importance for the 34J project, this interactive database will be maintained and enriched by P1 bioinformaticians as perennial platform of analytical tools open for a network of collaborating teams working on the regulation of wood formation at the international level.
Fig 4. Screenshot of the 34J website. Database information are accessible through a set of tabs providing, for each gene, sequences, orthologs, phylogenetic analyses and expression profiles. The combination of heat maps and eFP Browser graphical representations allow easy analyses of gene expression profiles. Statistical tools to highlight relevant variables and correlate gene expression patterns have been implemented.
Task1.2 – Transcript profiling of selected CGs
Objective: To refine the number of CGs (selected in task 1.1), the most pertinent ones were selected, using highthroughput expression profiling tools in contrasted wood samples (juvenile vs mature, opposite vs tension, distinct wood tissues/cellular types…) from different E and P species and genotypes.
Eucalyptus
To allow accurate RT-qPCR analysis, we first selected 13 potential reference genes and validated 5 of them using 17 distinct experimental sets covering 17 organs and tissues, as well as various developmental and environmental conditions for 5 Eucalyptus species (published in (Cassan-Wang et al., 2012); collaboration between P1, P2 &P8). These genes were particularly useful for normalization of microfluidic experiments (large-scale qRT-PCR) used by several partners of the project but are also instrumental for the whole Eucalyptus community.
Thanks to the release of the sequence of the Eucalyptus grandis genome (Myburg et
al., 2014) to which P1 and P8 participated for assembly and expert annotation), we
performed an in depth analysis of 11 families of genes involved in lignin biosynthesis (Carocha et al., 2015) (P1 &P8) as well as 4 transcription factor families containing members known to be involved in secondary cell wall formation such as the MYB (Soler et al., 2015) (P1 &P8), NAC (Hussey et al., 2015) (P1), Aux/IAA (Yu et al., 2015) (P1 &P8) and ARF (Yu
et al., 2014) (P1 &P8). We performed comparative phylogenetic analyses including poplar
genes as well as other sequenced genomes such as Arabidopsis, grapevine and rice. The genome-wide study of all the above-mentioned families enabled us to highlight some remarkable and new features. For instance, in the large MYB family, some subgroups are more expanded in woody plants than in herbaceous plants. We could also identify new subgroups containing only members from woody plants. Remarkably, 94% of the tandem duplicated R2R3-MYB genes belong to those woody-expanded and woody-preferential subgroups. In striking contrast, subgroups containing genes known involved in SCW formation are well conserved among woody and non-woody species and did not suffer tandem duplication events.
We then used RNA Seq data from a range of six organs and tissues (kindly provided by Prof Myburg, Pretoria University, South Africa) to highlight genes preferentially expressed in xylem. Combining the data from comparative phylogenetic analyses, bibliography and high throughput transcriptome analyses, we selected a subset of 250 genes to study more in depth their expression in a large range of organs and tissues, developmental stages and in response to different environmental conditions (thanks to plant material made available by
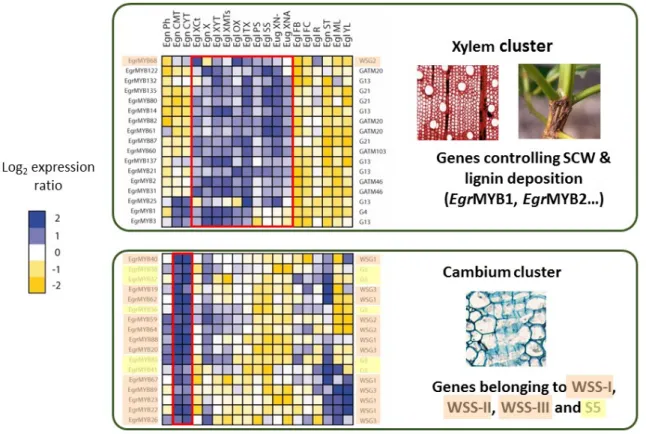
P3 (FCBA), P4 (CIRAD), P7 (Altri Florestal) & P8 (IBET). One of the most remarkable results of our study is that all R2R3-MYB genes analyzed belonging to three of the woody-subgroups are preferentially expressed in cambium (Figure 5). Cambial activity is responsible for secondary-growth, one major feature of woody perennial plants.
Fig 5. Heat map of the transcript abundance patterns assessed using microfluidic qPCR of Eucalyptus genes in 19 different tissues from Eucalyptus globulus, from Eucalyptus Gundal hybrids (Eucalyptus gunnii × Eucalyptus dalrympleana) and from Urograndis hybrids (Eucalyptus urophylla ×
Eucalyptus grandis). Genes and samples were hierarchically clustered according to their transcript abundance (expressed in relation to the mean of all samples and log2-transformed), showing two cluster of genes, one including genes highly expressed in xylem and stems under different conditions, whereas the other including genes preferentially expressed in cambium. Gene names are shown to the left of the heat map, whereas the short name of the phylogenetic subgroup is included to the right; and according to Soler et al. (2014, New Phytol), woody preferential genes are highlighted in orange whereas woody expanded genes are highlighted in yellow. Ph, phloem; CMT, cambium from mature (25-yr-old trees); CYT, cambium from young (7-yr-old) trees; XCt, control (straight, not bended) xylem; X, xylem; XYT, young xylem; XMTs, mature xylem; OX, opposite xylem; TX, tension xylem; PS, primary stem; SS, secondary stem; XN-, xylem with low nitrogen fertilization; XNA, xylem with high nitrogen fertilization; FB, floral buds; FC, fruit capsule; R, lateral roots; ST, shoot tip; ML, mature leaves; YL, young leaves; Egl, E. globulus; Egn, E. gunnii × E. dalrympleana; Eug, E. urophylla × E. grandis.
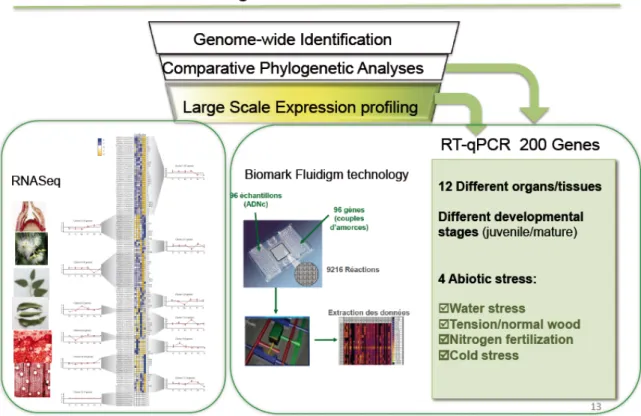
All these data were integrated in the 34J database (see task 1.1.2) and mined to select the best Eucalyptus candidate genes (CG) (Figure 6). Among the 250 genes tested, more than 60 CG were preferentially and/or highly expressed in xylem and/or cambium. This list included 25 MYB, 11 NAC, 8 Aux/IAA, 3 ARF. We established a ranking from 1 to 5 to
restrict the number of CG for functional characterization by including several additional criteria such as: i) their relative level of expression in xylem/cambium, ii) their level of tissue specificity, iii) their novelty (gene or putative orthologs not studied before) – for instance in clades either « specific » of woody plants and/or expanded in Eucalyptus, (iv) their co-expression with lignin genes or other known SCW-related genes including transcription factors, (v) their responses to one or more abiotic stresses among those tested i.e. drought, cold, nitrogen status, mechanical stress.
We selected a total of 16 CG for functional characterization including 9 MYBs (EgMYB1, MYB2, MYB20, MYB36, MYB64, MYB68, MYB80, MYB88, MYB137), 4 Aux/IAAs (EgrIAA4, IAA9A, IAA13, IAA20) 2 ARFs (ARF10, ARF19.2) and 1 NAC (EgNAC64) (see Task 1.4)
Fig 6. The schema showing the procedure to identify new regulators involved in wood formation
Poplar
A list of more than 150 CGs was built based on bibliographic data and both in-house microarray and RNAseq expression data from tension wood (TW), opposite wood (OW) and
straight wood (CW). P2 integrated these data into PathwayStudio ® database in order to select candidates genes based on their expression patterns in poplar tissues, mainly focusing on genes differentially expressed between TW as compared to opposite or straight wood and focusing on transcription factors (Figure 7). Some transcription factors have been chosen also based on known function in secondary cell wall (SCW) formation in Arabidopsis or Eucalyptus; however, in a more risky approach some genes with unknown function in SCW formation have also been selected.
Fig 7. Example of biological knowledge for KNAT7 (top) and WLIM1 (bottom) from Pathway Studio® database in which sRNA data, degradome sequencing, poplar annotation, and expression data have been incorporated (view of RNAseq data on this example). We can notice KNAT7 interactors such as PtrWIN2B (NAC domain protein), BLH6, PtrMYW021 (MYB46 ortholog), diagrams showing expression values and one microRNA (miR1446) predicted (psRNA target prediction) to target KNAT7. NB: degradome sequencing analysis have not confirmed that miR1446 targeted KNAT7 in poplar. For WLIM1, degradome analysis and sRNA sequencing identified one miRNA (agpf_2444) targeting this gene.
Task1.3 Identification of transcriptional interactome
Objective: to identify protein partners of the most interesting TF
P1 constructed and screened a Eucalyptus xylem yeast-two-hybrid library using
EgMBY1, a SCW repressor previously characterized by P1 (Legay et al., 2010) as a bait.
Several candidates arose from this screening but the most abundant were a Histone linker (EgH1) and an ovate protein. We showed that EgH1 and EgOvate co-localize with EgMYB1 in the nucleus of transiently transformed cells. We further validated this interaction in planta using the powerful FRET-FLIM technology and confirmed the specificity of the interaction in
planta (Figure 8. Soler et al, in preparation + Soler et al, com IUFRO, 2015).
Fig 8. Yeast two hybrid interaction and co-localization of EgMYB1 with a Histone linker (EgH1.3) protein. A. Specific interaction of EgMYB1 with EgH1.3 in yeast cells. Specificity of the interaction was assessed with another MYB gene from Arabidopsis not expressed in xylem (AtMYB30) and with another MYB gene from Eucalytpus highly expressed in xylem (EgrMYB137), showing in both cases negative results. B. Co-localization of EgMYB1 and EgH1.3, transiently expressed in tobacco leaves, in the nuclei of epidermal cells.
These two partners of EgMYB1 have been added to our list of 16 CGs (task 1.2) coming up to 18 CG and functionally characterized in Arabidopsis as well as in Eucalyptus hairy roots. It is worth saying that the yeast-two-hybrid Eucalyptus xylem library is a unique tool available for the Eucalyptus community and we acquired the expertise to identify and validate further proteic partners of other genes involved in SCW formation.
Task 1.4 Functional characterization of a limited number of selected CGs
A new homologous stable transformation system for Eucalyptus
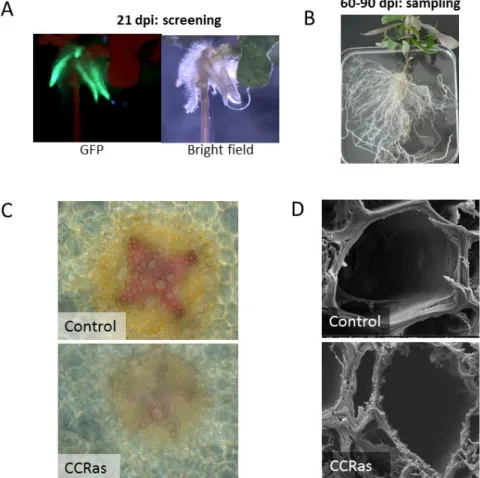
As we did not succeed to obtain transgenic calli expressing in poplar the GFP tag fused to transcription factors, the grafting method allowing transgenic wood sectors initially planned could not be used and we decided instead to transform Arabidopsis and poplar plants for phenotyping. This change induced a big delay in the project and many transgenic lines generated could not be fully characterized at the end of the project. For Eucalyptus, transformation and regeneration are too long and fastidious, and are not appropriate for functional characterization of many candidate genes within relatively short research projects (3-4 years). To overcome this difficulty we developed a fast system allowing to high throughput characterization of candidate genes by producing transformed Eucalyptus hairy roots using Agrobacterium rhizogenes (Plasencia et al, com IUFRO 2015, paper in preparation). Composite plants, containing transformed hairy roots and non-transformed aerial stems were obtained in less than 3 months. We demonstrated that this homologous transformation system is suitable to study the function of SCW- related genes using as a proof of concept the down-regulation of the CCR gene encoding the first enzyme committed to the lignin specific pathway. The phenotype of the transformed roots with reduced lignin levels and irregular vessels shape was identical to that of stems of other transgenic plants downregulated for the CCR gene (Figure 9. Plasencia et al, com IUFRO, paper in preparation).
Fig 9. Development and validation of a fast system for functional characterization of candidate genes in a homolog system of Eucalyptus using hairy roots. A. Eucalyptus plants transformed with A. rhizogenes harbouring a plasmid with 35S:GFP were detected under fluorescence 21 days after infection. B. Composite plants resulting of the A. rhizogenes transformation were hardened in pots with inert substrate and are ready to be harvested after 60-90 days after infection. C. Suitability of this system was assessed by transforming Eucalyptus with the antisense construct of the CCR gene, showing hairy roots section stained with phloroglucinol reagent with thinner xylem ell walls and lower lignin content. D. Deeper analysis using Scanning Electron Microscopy demonstrated thinner xylem cell walls with a phenotype resembling to irregular xylem, as previously observed (Piquemal et al. 1998).
Constructs and transformation for Eucalyptus candidate genes
P1 selected 19 Eucalyptus CG: 2 ARF, 4 Aux/IAA, 1 NAC and 10 R2R3-MYB, 1
Histone linker, 1 ovate genes (see Table 1). Some of these genes were characterized for
their activating or repressing activity in transient transactivation assays (Yu et al., 2014; Yu et
al., 2015). A total of 26 constructs were made (22 by P1 and 4 by P11) including
overexpression of a native of mutated version (OEm) and/or dominant repression and transferred in Arabidopsis and/or poplar, and more recently in Eucalyptus hairy roots. In addition constructs overexpressing individually or in combination the two interacting partners of EgMYB1 (ovate and H1) were transformed in Arabidopsis and in Eucalyptus hairy roots. Because of the high number of genes and constructs, P1 collaborated with P5a, P11 and P 12 for poplar transformation (see Table 1).
Table 1. Table of constructs (overexpression (OE), dominant repression (DR), promoter GUS fusion) of selected Eucalyptus candidate TFs and status of transformation in either Arabidopsis and/or in poplar, and/or in Eucalyptus hairy roots.
Construction Transformation
Gene name Accession number Arabidopsis Poplar Eucalyptus roots
MYB
1 EgMYB1 Eucgr.G01774 DR 35S EAR X EgMYB1 Eucgr.G01774 OE 35S Legay et al. 2010 Legay et al. 2010 (P1) EgMYB1 Eucgr.G01774 Promoter Prom::GFP-‐GUS X X
2 EgMYB2 Eucgr.G03385 DR 35S EAR X X 3 EgrMYB20 Eucgr.B00866 OE 35S X expression clone sent to P5a 4 EgrMYB36 Eucgr.C00721 DR 35S EAR EgrMYB36 Eucgr.C00721 OE 35S 5 EgrMYB64 Eucgr.D02390 OE 35S ENTRY clone sent to P11 X EgrMYB64 Eucgr.D02390 Promoter Prom::GFP-‐GUS X 6 EgrMYB68 Eucgr.E01031 OE 35S expression clone sent to P5a EgrMYB68 Eucgr.E01031 Promoter Prom::GFP-‐GUS X X
7 EgrMYB80 Eucgr.F02756 OE 35S expression clone sent to P5a X EgrMYB80 Eucgr.F02756 Promoter Prom::GFP-‐GUS X 8 EgrMYB88 Eucgr.F04423 OE 35S X X EgrMYB88 Eucgr.F04423 DR 35S EAR X X 9 EgrMYB135 Eucgr.K02297 OE 35S EgrMYB135 Eucgr.K02297 Promoter Prom::GFP-‐GUS X
10 EgrMYB137 Eucgr.K02806 OE 35S X Not able to regenerate X EgrMYB137 Eucgr.K02806 DR 35S EAR X X EgrMYB137 Eucgr.K02806 Promoter Prom::GFP-‐GUS X
Auxin signaling
11 EgrmIAA4 Eucgr.H04336 OE m 35S X ENTRY clone sent to P11 12 EgrmIAA9 Eucgr.H02407 OE m 35S X 13 EgrmIAA13 Eucgr.H02914 OE m 35S X ENTRY clone sent to P11 14 EgrIAA20 Eucgr.K00561 OE 35S X 15 EgrmARF10 Eucgr.J00923 OE m 35S X 16 EgrARF19.2 Eucgr.C03293 OE 35S X EgrARF19.2 Eucgr.C03293 DR 35S EAR X
Others
17 EgHISTONE Eucgr.I02364 OE 35S X EgHISTONE Eucgr.I02364 Promoter Prom::GFP-‐GUS X X 18 EgOVATE Eucgr.J01842 OE 35S X EgOVATE Eucgr.J01842 DR 35S EAR X EgOVATE Eucgr.J01842 Promoter Prom::GFP-‐GUS X X
EgMYB1 + EgH1 OE 35S X EgMYB1 + EgOv OE 35S X
NACs
Up to five different lines were selected for each construct and transcript levels were assessed to further choose three them for in depth characterization of their wood-related phenotypes using
(1) histochemistry (Figure 10.)
Fig 10. Stem section of poplar and Arabidopsis plants harboring the Dominant Repression construct of EgrMYB137. A. Section of stems from WT and EgrMYB137-DR poplar plants stained with phloroglucinol, showing that xylem cells from transgenic lines have lower lignin content, as indicated by fainter staining. B. Section of inflorescence stems from WT and EgrMYB137-DR Arabidopsis plants stained with phloroglucinol, showing thinner xylem cell walls with lower lignin in the transgenic lines.
(2) different methods to characterize the SCW content and composition including
-Wet chemistry: Klason lignin, and thioacidolysis (P1 for poplar and in collaboration with Prof C Lapierre INRA Versailles for Arabidopsis)
-NIRS for poplar samples (P9, José Rodrigues),
-Analytical Pyrolysis by P9 for poplar samples and in collaboration with Dr E Pesquet (Umea Plant Science Center, Sweden) for Arabidopsis.
-Saccharification (P1)
Some transgenic plants showed distinct clear wood-related phenotypes (Table 2) and the phenotypic characterization of one gene (EgrIAA4) is already published (Yu et al., 2014; Yu et al., 2015) (Yu Hong PhD). Others are in preparation.
Although not all transgenics could be completely characterized before the end of the project, clearly some candidates seem very promising with for instance a lower lignin content and an improved saccharification efficiency, without showing detrimental phenotypes.
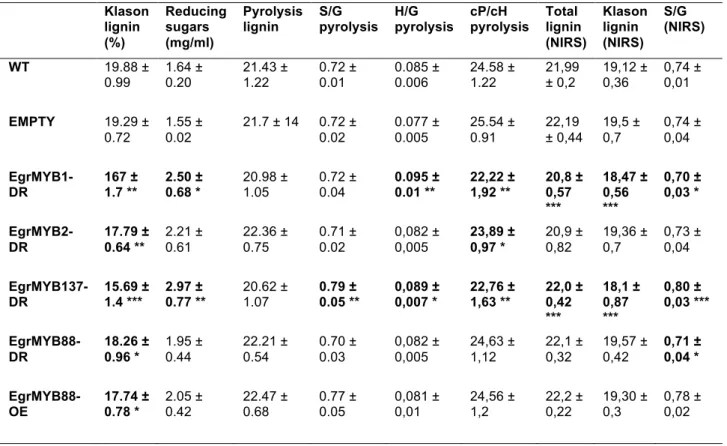
Table 2. Biochemical data for poplar transgenic lines harboring Eucalyptus MYB genes. Klason lignin and total reducing sugars were experimentally measured by wet chemistry methods. Lignin content, S/G, H/G and cP/cH (pentoses vs hexoses carbohydrates) ratio were measured by pyrolysis coupled to GC-MS (P9). Total lignin, Klason lignin and S/G ratio were also predicted using NIRS. Statistical analyses were
performed by T test (* < 0.05, ** < 0.01, *** < 0.001). Klason lignin (%) Reducing sugars (mg/ml) Pyrolysis lignin S/G pyrolysis H/G pyrolysis cP/cH pyrolysis Total lignin (NIRS) Klason lignin (NIRS) S/G (NIRS) WT 19.88 ± 0.99 1.64 ± 0.20 21.43 ± 1.22 0.72 ± 0.01 0.085 ± 0.006 24.58 ± 1.22 21,99 ± 0,2 19,12 ± 0,36 0,74 ± 0,01 EMPTY 19.29 ± 0.72 1.55 ± 0.02 21.7 ± 14 0.72 ± 0.02 0.077 ± 0.005 25.54 ± 0.91 22,19 ± 0,44 19,5 ± 0,7 0,74 ± 0,04 EgrMYB1-DR 167 ± 1.7 ** 2.50 ± 0.68 * 20.98 ± 1.05 0.72 ± 0.04 0.095 ± 0.01 ** 22,22 ± 1,92 ** 20,8 ± 0,57 *** 18,47 ± 0,56 *** 0,70 ± 0,03 * EgrMYB2-DR 17.79 ± 0.64 ** 2.21 ± 0.61 22.36 ± 0.75 0.71 ± 0.02 0,082 ± 0,005 23,89 ± 0,97 * 20,9 ± 0,82 19,36 ± 0,7 0,73 ± 0,04 EgrMYB137-DR 15.69 ± 1.4 *** 2.97 ± 0.77 ** 20.62 ± 1.07 0.79 ± 0.05 ** 0,089 ± 0,007 * 22,76 ± 1,63 ** 22,0 ± 0,42 *** 18,1 ± 0,87 *** 0,80 ± 0,03 *** EgrMYB88-DR 18.26 ± 0.96 * 1.95 ± 0.44 22.21 ± 0.54 0.70 ± 0.03 0,082 ± 0,005 24,63 ± 1,12 22,1 ± 0,32 19,57 ± 0,42 0,71 ± 0,04 * EgrMYB88-OE 17.74 ± 0.78 * 2.05 ± 0.42 22.47 ± 0.68 0.77 ± 0.05 0,081 ± 0,01 24,56 ± 1,2 22,2 ± 0,22 19,30 ± 0,3 0,78 ± 0,02
Constructs and transformation for Poplar candidate genes
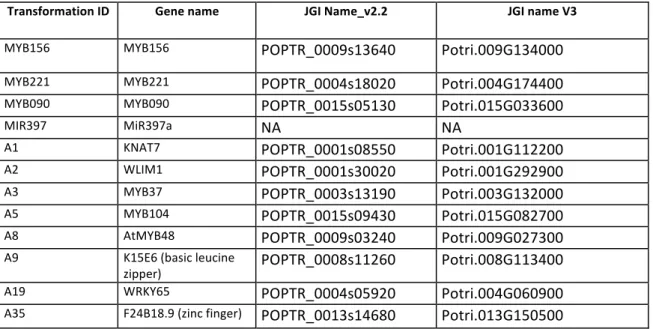
P2 selected 12 candidate genes including one microRNA (miR397a) for functional analysis (see Table 3 below). Constructions were made to overexpress (OE) CG in their native form or fused to a dominant repression (DR) motif. We present below fully characterized OE transgenic lines from MYB156, MYB221, MYB090, miR397a and KNAT7. For the other transgenic lines greenhouse material have been produced, phenotypic alterations have been monitored but lignin analyses need to be done. Between 3 and 32 transgenic lines were produced and acclimatized depending on the transformation.
Table 3: Candidate genes selected by P2 for functional analysis.
Transformation ID Gene name JGI Name_v2.2 JGI name V3
MYB156
MYB156 POPTR_0009s13640 Potri.009G134000 MYB221 MYB221 POPTR_0004s18020 Potri.004G174400 MYB090 MYB090 POPTR_0015s05130 Potri.015G033600 MIR397 MiR397a NA NA
A1 KNAT7 POPTR_0001s08550 Potri.001G112200 A2 WLIM1 POPTR_0001s30020 Potri.001G292900 A3 MYB37 POPTR_0003s13190 Potri.003G132000 A5 MYB104 POPTR_0015s09430 Potri.015G082700 A8 AtMYB48 POPTR_0009s03240 Potri.009G027300 A9 K15E6 (basic leucine
zipper) POPTR_0008s11260 Potri.008G113400 A19 WRKY65 POPTR_0004s05920 Potri.004G060900 A35 F24B18.9 (zinc finger) POPTR_0013s14680 Potri.013G150500
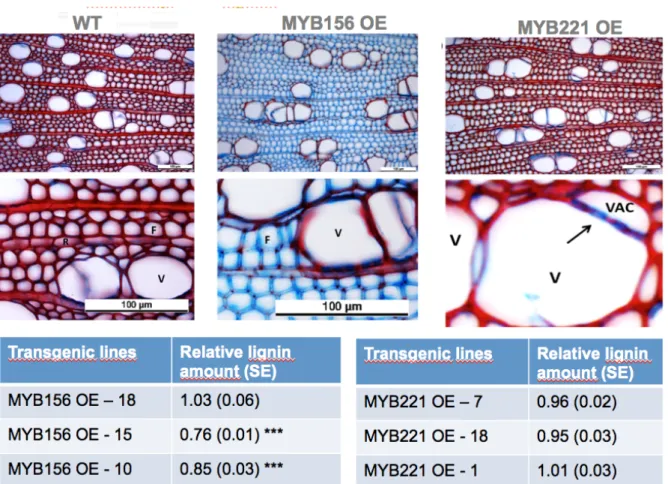
Poplar MYB156 or MYB221 are a co-orthologs pair of the Eucalyptus EgMYB1 and the
Arabidopsis AtMYB4 which have been shown to be repressor of lignification in these respective
species. Respectively, 22 and 24 transgenic lines have been produced and finally 2 lines were selected for MYB156 and 3 lines for MYB221. These lines were grown for 3 months and analyzed for lignin content. We did not observe any growth defect in these lines except more sylleptic branches in MYB221 OE lines and cup-shaped leaves in MYB156 OE lines. A significant decrease in lignin content was observed in two MYB156 OE lines (Figure 11). Histological inspection of wood stem cross sections showed that secondary cell wall fibers of MYB156 OE (lines 10&15) are depleted in lignin and enriched in cellulose (less colored by safranin but more by astra blue). MYB221 OE lines showed more intense blue coloration in the perforation plate between vessels indicating a decreased lignin content of this cell wall. In conclusion, these 2
MYB transcription factors appear also to be repressors of lignification as for their orthologs EgMYB1 / AtMYB4. However, some functionalization occurred between the poplar paralogs as the overexpressing lines did not give the same phenotype, although effects of transgene insertion site or level of transgene expression cannot be completely ruled out.
Fig 11. Wood anatomy and lignin content of most affected transgenic lines over expressing either
MYB156 or MYB221. WT: wild type poplar.
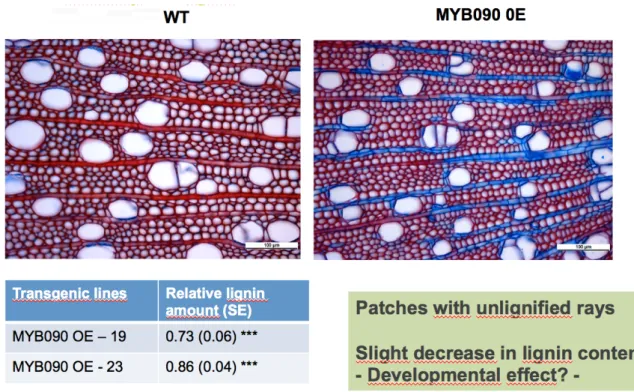
PtaMYB090 is the putative ortholog of AtMYB52 / AtMYB54 that has not clear function. 24
transgenic MYB090 OE lines were obtained and two (lines 19 & 23) were further analyzed. The two lines presented 30%-40% reduction in growth, shorter internodes and aberrant leaf shapes. Chemical analysis revealed a slight reduction in lignin content relative to the control and histological investigations showed that ray parenchyma cell walls were poorly lignified (Figure 12; Lakhal et al., in preparation).
Fig 12. Wood anatomy and lignin content of MYB090 OE lines and wild type poplar (WT)
MIR397a - Sequence of the stem-loop sequence of ptc-miR397a was overexpressed with the aim to down-regulate the expression of laccases potentially important for lignin polymerization. 32 transgenic lines were produced and screened first for pre-miR397a expression and second for the expression of 3 laccase genes. 4 lines (MIR397-A1, A3, A7 & A25) were selected and further analyzed for lignin and cell wall sugars content and composition, and saccharification potential. Transcriptomics (RNAseq) and metabolomics analysis have also been done but results are currently being analyzed. All analyses have been done on 5-month-old plant in order to have sufficient amount of material for all the chemical analyses. No growth defect was observed. A slight reduction in total lignin of 9-10% was determined on the transgenic lines, line MIR397-A1 being the most affected followed by MIR397-A7, MIR397-A3 & MIR397-A25. Thioacidolysis analyses showed a significant 12% increase in S/G ratio for line MIR397-A1. Overexpression of pre-miR397a also slightly impacted the cell wall sugar composition. Interestingly, all these cell wall modifications have a beneficial impact of the saccharification potential of the wood of these transgenic lines (Figure 13 &14; Ayangma et al., in preparation).
Fig 13. Cell wall sugar composition of MIR397-OE lines.
Fig 14. Saccharification potential of MIR397-OE lines.
The Class II KNOX gene KNAT7 negatively regulates secondary wall formation in
Arabidopsis and is functionally conserved in Populus (Li et al., 2012). In poplar, KNAT7
(Potri.001G112200) was strongly expressed in concert with secondary wall formation and up regulated in TW compared to OW (up to 16 fold higher in TW). Other research groupshave tried to overexpress KNAT7 in poplar without success. Indeed, we only obtained 3 transgenic lines
over 8 transformations which represent a frequency of 0,4% compared to transformation efficiency of about 100% when using an empty control vector (average of one transgenic line per stem explant used in the experiment). This low frequency of recovery could be due to detrimental effect of KNAT7 over expression on organogenesis and regeneration. The 3 transgenic lines (named KT1, KT2 and KT3) presented an overexpression of KNAT7 relative to the wild type (13.6, 8.4 and 1 fold for KT1, KT2 & KT3, respectively), an increase in growth resulting in an increase in biomass yield with a gradual phenotype (Figures 15).
Fig 15. Growth characteristics or KNAT7 overexpressing lines.
Alterations in leaf size and leaf veins were also noted as well as the absence of nectaries on the most affected line KT1 (Figure 16.).
Fig. 16 Leaf phenotypes observed on KNAT7 over expressing lines. Severity of phenotypes
ranges from KT1 to KT3.
Lignin content analysis was not significantly different between transgenic lines and controls but thioacidolysis analysis of lignin composition pointed 9% significant increase in S/G ratio for the most affected lines KT1 and KT2. Cell wall sugar analysis revealed a significant increase in glucose content and decrease in Mannose and Uronic acids, even the differences were quite low. A saccharification assay showed up to 22.9% significant increase in glucose release from the transgenic lines compared to the wild type poplar (Figure 17; Gourcilleau et al., in preparation).
Fig 17. Saccharification potential of KNAT7-OE lines.
In conclusion,
several good candidates have been identified (KNAT7 OE lines 1 & 2,MYB156 OE lines 10 & 15, MIR397-A1, A3 & A7) for a future field trial evaluation.
P5 has chosen 13 candidate genes (including NAC, LIM, KNOX and MYB transcription factors) probably regulating wood properties for testing via stable transformation (knockdown and over-expression lines). Constructs comprising nine overexpression constructs, three RNAi-constructs and one amiRNA-construct have been produced and transformed into Populus. Transgenic lines have been transferred to the greenhouse. Four of these transgenic lines representing two different constructs show apparent phenotypic aberrations, including dwarfing or reduced growth and/or bended stems and stronger and irregular leaf serration or brown spotted and crumpled leaves. Transgenic lines old enough for relevant wood production, have been harvested for wood property analysis.
Further, P5a transformed five constructs comprising candidate genes for wood properties from Eucalyptus grandis (produced by P1), into poplar. Transgenic lines have been provided to P1 for further analyses.
Set up of a cryopreservation protocol for Eucalyptus and poplar transgenic lines
In order to enable securing valuable transgenic lines as soon as possible after their identification/selection, P4 setup a new cryopreservation protocol for in vitro axillary buds and shoot tips from a wide range of Eucalyptus and Populus species to be used for transgenics from P1, P2, P8, P11. It was shown to work with many broadleaved species, irrespectively of their cold hardiness (Table 4 below). The new protocol prove faster (cheaper) to use and enabling higher and faster plantlet regrowth (Figure 18. Harvengt et al, 2015 - IUFRO Tree Biotechnology meeting, Florence, Italy; paper in preparation).
Fig 18. Results from cryopreservation with the new protocol: (A) = regrowth (withish parts) of dissected Eucalyptus gunnii x dalrympleana shoot tip one week after thawing from cryopreserved sample; (B) kinetics of regrowth of one hybrid poplar axillary bud (GUS transgenic line from P2, INRA 717-1-B4 clone) at 1, 5 and 10 days after thawing. The scale bar is representing 1 mm (A) and 3 mm (B).
Table 4. Summary of our preliminary results on various plant material already in commercial
plantation or used for upstream or basic studies
The cryopreservation service was opened for free in the frame of the project to the 34J partners by mid-2013 but the availability of transgenic lines for which cryopreservation was needed took time. Some previous Eucalyptus lines from P1 and all poplar lines provided were cryopreserved (Table 4). This service is continuing in the frame of the Xylobiotech platform ran by P2 and P4 (coordinated by P4; http://biotech.xyloforest.org/). The service includes actual survival ability checking to be sure that the frozen plant material is enough for many successful regrowth attempts.
Task 1.5 Environmental regulation of CGs and impact on biomass production and wood
quality
Objective:
To provide insights into the environmental effects on the expression of CGs (selected in task 1/1.2) and assess how environmental conditions impact the production of wood biomass and quality.Subtask 1.5 Selection of Eucalyptus and poplar genotypes
Genotypes of interest for Spain based on their potential for bioenergy and growth under non-optimal or stress conditions (Figure 19; Populus alba L. clone, Hybrid P. x canadensis ‘Oudemberg’, Hybrid P.tremula x P.alba INRA 7171-B4, E. urograndis, E. camaldulensis, E.
globulus) were selected by P10 (ENCE) and P13 (CIFOR-INIA) and provided to P11 (UMA) and
Fig 19. Eucalyptus and poplar genotypes selected and treatments applied
Subtask 1.5.2 Effect of environmental factors on CGs expression
A-‐Nitrogen fertilization assay (P11):
Acclimated plantlets of Eucalyptus spp and Populus spp were cultivated in the presence of 0 (Low nitrogen), 1 (Control) or 10 mM (High nitrogen) of ammonium nitrate for 1 month. Different growth and developmental parameters were evaluated in treated and control plants: stem length, number of internodes, leaf surface, dry weight, histological analysis of xylem morphology and development. Samples from the nitrogen fertilization assay were also analyzed for changes in C:N ratio. Changes in extractive content, S/G ratios and Klason lignin were determined by Partner P9 (IICT) as described in Task 2. Transcript levels for wood-related genes encoding enzymes involved in cellulose and lignin synthesis and several transcription factors were quantified by qRTPCR using a Fluidigm BioMark HD System in P1 lab.
Overall, the four Eucalyptus genotypes responded in a similar way to the nitrogen treatments. They show a general decrease in growth and development parameters and xylem extractives contents under low nitrogen treatment and an increase of those parameters under high nitrogen treatment (Figure 20). These data negatively correlate with transcript levels of both sets of wood-related genes (Figure 21), as a general induction in transcript levels was observed
under low nitrogen whereas high nitrogen conditions caused a reduction in transcript levels. These results suggest that the genus Eucalyptus has a wider dynamic range to assimilate nitrogen than the genus Populus for the tested range (0 to 10 mM ammonium nitrate), since poplar genotypes did not show significant changes under high nitrogen treatment regarding the control condition (Figure 22).
Fig 20. Effects of nitrogen nutrition in growth and development parameters and xylem extractives contents in Eucalyptus genotypes. Values represent the log ratio of data from plants under the nitrogen treatment and data from plants under control conditions [Log 2 (low or high nitrogen/control)]. A. Data were obtained from stem regions developed during the treatment period and compared to equivalent regions of plants in control growth condition. B. Extractives contents were measured in xylem from stem regions between nodes 11 to 21 (counting from the apex). Low nitrogen (0 mM NH4NO3), high nitrogen (10 mM NH4NO3), control (1 mM NH4NO3). Values with significant differences with the control plants, according to a t-test (p< 0.05), are labelled with a star.
Fig 21. Effects of nitrogen nutrition on expression of genes related to wood formation in Eucalyptus genotypes. Values represent the log ratio of data from plants under the nitrogen treatment and data from plants under control conditions [Log 2 (low or high nitrogen/control)]. Data were obtained from stem regions developed during the treatment period and compared to equivalent regions of plants in control growth condition. Top panels show changes in transcript levels of genes encoding enzymes involved in cellulose and lignin synthesis, and bottom panels show idem for transcription factors related to wood formation. Low nitrogen (0 mM NH4NO3), high nitrogen (10 mM NH4NO3), control (1 mM NH4NO3). Values with significant differences with the control plants, according to a t-test (p< 0.05), are labelled with a star.
Fig 22. Effects of nitrogen nutrition in growth and development parameters and xylem extractives contents in Poplar genotypes. Values represent the log ratio of data from plants under the nitrogen treatment and data from plants under control conditions [Log 2 (low or high nitrogen/control)]. Data were obtained from stem regions developed during the treatment period and compared to equivalent regions of plants in control growth condition. Low
nitrogen (0 mM NH4NO3), high nitrogen (10 mM NH4NO3), control (1 mM NH4NO3). Values with significant differences with the control plants, according to a t-test (p< 0.05), are labelled with a star.
B-‐ Drought assay (P11).
Eucalyptus and Populus plantlets were full watered (control) or watered to reach 50% of
full capacity of water retention by the river sand substrate. Plantlets were maintained under drought stress until they showed clear stress symptoms.
Different growth and developmental parameters were evaluated in treated and control plants: stem length, number of internodes, leaf surface, dry weight, histological analysis of xylem morphology and development. Changes in extractive content, S/G ratios and Klason lignin were determined by Partner P9 (IICT) as described in Task 2. Transcript levels for wood-related genes encoding enzymes involved in cellulose and lignin synthesis and several transcription factors were quantified by qRTPCR using a Fluidigm BioMark HD System.
The hybrids, P. x c “Oud” and P. t x a “TxA”, showed greater repression in growth (height) than the two P. alba during the last week of drought treatment suggesting a relatively higher sensitivity to drought in the hybrids (Figure 23). Drought treatment caused a significant reduction in leaf area in the hybrids, while the P. alba genotypes showed the opposite trend, i. e. increases in leaf areas in response to drought, revealing important differences between these genotypes in the regulation of leaf development in response to drought stress. P. a. “J-1-3-18” showed the greatest reduction in the generation of internodes and total net growth during drought. “J-1-3-18” showed significant increases in the area of transversal sections of stem, including significant reductions in total area and area of the xylem. On the contrary, the other P. a. (“PO”) showed reductions in these parameters. The two P. a. genotypes, not only showed opposite trends in parameters regarding the stem section areas, but also in transcript levels when compared to their controls. “J-1-3-18” showed the greatest reduction among the four genotypes in transcript levels of the wood related genes and transcription factors, while “PO” showed an increment in the level of transcripts encoding transcription factors. These facts reveal clear differences between the two
P. alba genotypes.
With regard to the Eucalyptus genus, drought caused a moderate decrease in the different growth and developmental parameters. However, no remarkable differences or a clear differential trend were observed among genotypes in response to the treatment both in growth/developmental parameters or in transcript levels.
Fig 23. Effects of the drought stress in growth and development parameters, xylem extractives contents and expression of genes related to wood formation in Populus genotypes. Values represent the log ratio of data from plants under the stress and data from plants under control conditions [Log 2 (Dro/WW)]. A. Data were obtained from stem regions developed during the treatment period and compared to equivalent regions of plants in control growth condition. B. Extractive contents were measured in xylem from stem regions between nodes 11 to 21 (counting from the apex). C. The top panel shows changes in transcript levels of genes encoding enzymes involved in cellulose and lignin synthesis, and the bottom panel shows idem for transcription factors related to wood formation. Values with significant differences with the control plants, according to a t-test (p< 0.05), are labelled with a star.
C. Saline stress assay (P11/P13).
Acclimated plantlets of Eucalyptus spp and Populus spp, were subjected to two saline treatments. These consisted of two concentrations of NaCl (50 and 125 mM) with electric conductivity of 7 and 14 dSm-1 respectively, which are considered optimum for testing response differences in this genus. The concentration of salt was gradually increased, watering manually twice a week over the trial period. Once the final concentrations had been reached, exposure to salt stress lasted twelve weeks in the case of the Eucalyptus as opposed to six weeks in the case of the poplar as the growth rate in the later was much greater. A control treatment was included (water alone or water + half concentration of Hocking nutrient solution once a week). The effect of the saline stress was evaluated in genotypes of both genera by measuring different parameters: a) survival and leaf scorch expression, b) growth rate relative to height and diameter and volume c) production in volume (mm3), d) dry biomass, e) differentiating between the aboveground woody biomass fraction and the root biomass, f) the number of sylleptic branches produced, g) Rate of net photosynthesis (A, µmol.m-2.s-1) and stomatal conductance (gs, mol.m-2.s-1), h) specific leaf area (SLA, m2.kg-1) inferred as the area of a leaf disc divided by its oven-dry mass
per area, i) Chlorophyll content index (ICC), j) Isotope discrimination (∆,‰) and k) macro and microelements content. Changes in extractive content, S/G ratios and Klason lignin were determined by Partner P9 (IICT) as described in Task 2. Transcript levels for wood-related genes encoding enzymes involved in cellulose and lignin synthesis and several transcription factors were quantified by qRTPCR using a Fluidigm BioMark HD System.
Our assays have shown interspecific variability in the response to salt stress both for
Populus and Eucalyptus spp., both in relation to survival and production variables, as well as for
functional, morphological and biochemical parameters. For poplar, we found significant differences between the species. P. alba genotypes proved to be very tolerant for both moderate and severe salt dose, with very high rates of survival and absence of leaf damages. Opposite, the two hybrids ‘Oudemberg’ (P. x canadensis) and ‘TxA’ (P. tremula x P. alba) showed higher sensitivity, higher percentage of dead plants, and a lot of leaf damages as necrosis, highlighting less capacity of adaptation of these genotypes to cope with salinity stress (Table 5 and Table 6). These differences were also apparent in terms of transcript levels of wood-related genes (Figure 24). Both treatments (moderate and severe) caused a reduction in transcript levels for both functional group of genes (encoding enzymes involved in cellulose and lignin biosynthesis or transcriptional factors). However, the impact in both P. alba genotypes was clearly lower compared with the two hybrids (P. x canadensis and P.tremula x P. alba), with P. alba
‘PO-10-10-20’ showing the lowest effect of salt treatments on transcript levels. Therefore, this phenotype at
molecular level correlates with the higher performance and survival of these genotypes compared to the others.
Regarding Eucalyptus spp., all the tested genotypes showed a very high tolerance (100 % of survival) to grow under conditions of salt stress, both for moderate and severe dose, and with no symptoms of foliar damages. Despite the high percentage of survival displayed by all the
Eucalyptus genotypes, a general reduction in growth and therefore in biomass production was
observed for them when salt treatments were applied (Table 7). Concomitantly, a reduction in transcript levels for most of the tested genes were also observed in both stress conditions (Figure 25), although the impact was lower compared to poplar (compare scales of the X axis). The genotypes of the species E. urograndis and E. camaldulensis showed the highest values of woody and root biomass both in absence of salt and after treatments, being therefore more productive compared to E. globulus genotypes (Table 1.5.3). However, the most productive genotype, i.e. E. urograndis, was the one which suffered the more relevant decrease in production under saline treatments, followed by E. globulus ('Odiel'), and being E. camaldulensis and especially E. globulus 'Anselmo' the ones with lower biomass reductions. However, no remarkable differences were observed at an overall level in the transcript levels. In conclusion, we observe less tolerance to salt stress of the most productive genotypes with respect to those
with lower amount of biomass in absence of salt. Regarding Populus spp., a similar patter was observed, where the genotypes of P. alba, which were less productive than the hybrids in the control treatment, were the only ones which showed a tolerance behavior to deal with salinity stress, being both hybrids P. x canadensis and P. tremula x P. alba much more sensitive, despite being more productive in absence of salt.
Table 5. Average values and standard deviation for different genotypes of Populus spp. under salt treatments (control, 50 and 125 mM of NaCl) in relation to their aboveground woody biomass (WB), root biomass (RB) and the ratio (WB/RB)
Table 6. Survival percentage, confidence interval (CI, P=0.95) and response, after salt treatment (control,
Fig 24. Effects of exposure to six weeks of saline stress on expression of genes related to wood formation in Populus genotypes. Values represent the log ratio of data from plants under the salt treatment (50mM or 125 mM NaCl) and data from plants under control conditions [Log 2 (salt stressed/control)]. Data were obtained from stem regions developed during the treatment period and compared to equivalent regions of plants in control growth condition. A and B, changes in transcript levels of genes encoding enzymes involved in cellulose and lignin synthesis C and D, changes in transcript levels of genes encoding transcription factors related to wood formation. The NaCl concentrations in the watering solutions were 50 mM (A and C) or 125 mM (B and D). Values with significant differences with the control plants, according to a t-test (p< 0.05), are labelled with a star.
Table 7. Average values and standard deviation for different genotypes of Eucalyptus spp. under salt treatments (control, 50 and 125 mM of NaCl) in relation to their aboveground woody biomass (WB), root biomass (RB) and the ratio (WB/RB)
Fig 25. Effects of exposure to twelve weeks of saline stress on expression of genes related to wood formation in Eucalyptus genotypes. Values represent the log ratio of data from plants under the salt treatment (50mM or 125 mM NaCl) and data from plants under control conditions [Log 2 (salt stressed/control)]. Data were obtained from stem regions developed during the treatment period and compared to equivalent regions of plants in control growth condition. A and B, changes in transcript levels of genes encoding enzymes involved in cellulose and lignin synthesis C and D, changes in transcript levels of genes encoding transcription factors related to wood formation. The NaCl concentrations in the watering solutions were 50 mM (A and C) or 125 mM (B and D). Values with significant differences with the control plants, according to a t-test (p< 0.05), are labelled with a star.
D-‐ Cold Treatment and seasonal variation
D1. Plant material and treatments
- CBGP-UPM (Spain, P12):
To obtain the plant material for the cold experiment we collaborated with partners P10 (ENCE, Spain) and P13 (INIA, Spain). Plant material for the seasonal variation experiment was obtained in collaboration with P8 (IBET, Portugal) and P7 (ALTRI, Portugal).Cold treatments were performed in a cold room (4-7°C) keeping the same photoperiod as in the greenhouse. Three samples were collected per genotype, each with 3 plants. The samples were collected between the 3 and 4 hours after sunrise: t = 0, samples collected in the greenhouse; t = 24 h, collected in the cold room; t = 4 weeks, collected in the cold room. For the cold experiment, we used 4 genotypes of Eucalyptus: E. globulus Odiel, E. globulus Anselmo, E.