HAL Id: lirmm-01938883
https://hal-lirmm.ccsd.cnrs.fr/lirmm-01938883
Submitted on 7 Feb 2019
HAL is a multi-disciplinary open access
archive for the deposit and dissemination of
sci-entific research documents, whether they are
pub-lished or not. The documents may come from
teaching and research institutions in France or
abroad, or from public or private research centers.
L’archive ouverte pluridisciplinaire HAL, est
destinée au dépôt et à la diffusion de documents
scientifiques de niveau recherche, publiés ou non,
émanant des établissements d’enseignement et de
recherche français ou étrangers, des laboratoires
publics ou privés.
Effects of extraction method and storage of dry tissue on
marine lipids and fatty acids
Fany Sardenne, Nathalie Bodin, Luisa Métral, Anaïs Crottier, Fabienne Le
Grand, Antoine Bideau, Blandine Brisset, Jérôme Bourjea, Claire Saraux,
Sylvain Bonhommeau, et al.
To cite this version:
Fany Sardenne, Nathalie Bodin, Luisa Métral, Anaïs Crottier, Fabienne Le Grand, et al.. Effects of
extraction method and storage of dry tissue on marine lipids and fatty acids. Analytica Chimica Acta,
Elsevier Masson, 2019, 1051, pp.82-93. �10.1016/j.aca.2018.11.012�. �lirmm-01938883�
1
Analytica Chimica Acta XX (2018) XX-XX
https://doi.org/10.1016/j.aca.2018.11.012
Effects of extraction method and storage of dry tissue on marine lipids and fatty acids
Fany Sardenne
1*, Nathalie Bodin
2, Luisa Metral
1, Anaïs Crottier
1, Fabienne Le Grand
3, Antoine Bideau
3, Blandine Brisset
1,
Jérôme Bourjea
1, Claire Saraux
1, Sylvain Bonhommeau
4, Vincent Kerzérho
5, Serge Bernard
5, Tristan Rouyer
11 Ifremer, MARBEC Univ. Montpellier, CNRS, Ifremer, IRD, Sète, France 2
Seychelles Fishing Authority, Victoria, Seychelles
3 UBO, LEMAR CNRS, UBO, IRD, Ifremer, Brest, France 4 Ifremer DOI, Le Port, La Réunion
5 LIRMM Univ. Montpellier, CNRS, Montpellier, France
Keywords Degradation Freeze-drying Lyophilization Lipid class Marine animal Protocol A b s t r a c t
Various protocols are currently used to study marine lipids, but there is a growing interest in working on dry samples that are easier to transport. However, reference protocols are still lacking for dry samples. In order to make recommendations on this use, lipid classes and fatty acids (FA) obtained from six analytical protocols using two different tissue states (dry vs wet) and three extraction methods (automat vs manual potter vs leaving the solvent to work on tissue) were compared. Three dry storage modes of tissue (freezer vs gas nitrogen vs dry room) during one and three months were also compared. These comparisons were made on seven marine species with different lipid profiles, including fishes, crustaceans and mollusks. Lipid classes and FA obtained from wet and dry tissues were similar, but they were affected by the extraction methods. Regardless of tissue state, “Leave to work” methods obtained the highest lipid quantities, followed by manual potter and automat methods (ca. 90% and 80% of “Leave to work” methods, respectively). Linear relationships allowed correction for lipid classes and FA concentrations obtained from different protocols. The repeatability of all protocols still needs to be improved, especially for fish species. Increasing the replicate number for each sample might be an indirect way to improve lipid quantification. Our results show that storing dry tissues in the freezer for more than one month was associated with a decrease in lipids, which is also observed for other storage methods. For qualitative studies of FA (expressed in %), a three-month storage of dry tissue in freezer did not affect the relative composition of species/tissues with a lipid content below 20% of dry weight.
1. INTRODUCTION
Lipids are extensively studied in marine ecology for three main reasons: (i) they constitute the main energy storage form and are associated with energy allocation strategies [1,2]; (ii) they act as ecological tracers as some fatty acids (FA) are conserved during trophic transfers [3,4]; (iii) they are the main component of the cell membrane and involved in physiological processes such as the homeostasis, the immune response, and the hormone biosynthesis [5,6]. Lipids are grouped into classes with FA as building blocks for most complex lipids. FA are carbon chains differing in length and double bond number and position: from zero (saturated FA; SFA) to several double bonds (polyunsaturated FA; PUFA). Among lipid classes, TriAcylGlycerols (TAG) consist of three FA esterified to a glycerol backbone. Animals store TAG when dietary lipids and energy intake exceed demands. Phospholipids (PL) consist of one or two FA esterified to a phosphoric acid and constitute cell membranes. Free sterols (ST) contain no FA, but play an important role for
* Present address: Fisheries and Oceans Canada, Maurice Lamontagne Institute, Mont-Joli, Québec, Canada; fany.sardenne@hotmail.fr
the cell membrane, as well as for lipoproteins and hormone biosynthesis. Beyond these general aspects, the lipid metabolism of animals is linked to taxonomy. For instance, crustaceans are incapable of de novo ST synthesis and depend on dietary ST sources [7]. Bivalve mollusks synthesize unusual ‘non-methylene interrupted’ (NMI) FA which can be used as tracers for bivalves in food chains [8]. Tunas are among the richest species in PUFA docosahexaenoic acid content (DHA; 22:6n-3) [1].
Marine lipids are commonly extracted with the solvent mixture of Folch et al. [9] (chloroform:methanol; 2:1, v/v) using different methods. The most popular methods use automats such as Soxhlet and Accelerated Solvent Extraction (e.g., [10–12]), potter homogenizers (e.g., [13–15]) or leave the solvent to work on ground tissue (e.g., [16–18]). Each extraction method has its own advantages and limitations: automats generally improve repeatability [19,20], manual devices such as potter homogenizers are cheaper than automats, and leaving solvent to work reduces handling steps that generate variability [21].
2
Marine ecologists also deal with the constraint of storing tissue when lipids cannot be chemically-extracted immediately after sampling. Tissues can be stored frozen without degradation of marine lipids for several months to several years at -80°C (deep-frozen) [16,22] and at -20°C for some species [20,23,24]. However, the recommended deep-frozen storage is constraining over the long term as it requires suitable infrastructure and logistics; it also proves problematic when transportation is needed from remote areas, as maintaining samples at such temperature is complex. Storage into lipid-adapted solvent is not suitable for aircraft transport, neither for samples intended to be used for various types of complementary analyses such as stable isotopes [25,26] and DNA [27]. Freeze-drying (or lyophilization; a low temperature dehydration process) is a good alternative for marine ecologists as it is compatible with analyses of stable isotopes [28], metallic and organic contaminants [29] and metabolomic analyses such as Nuclear Magnetic Resonance [30]. Few studies have however looked into the effect of drying tissue on subsequent lipid analyses. Dunstan et al. [31] and Murphy et al. [32] conducted tests on the oyster Crassostera gigas and the green-lipped mussel Perna canaliculus, respectively, and found no significant influence of freeze-drying on lipid composition compared to frozen tissue. Caution seems required for the long-term storage of dry tissues as lipid degradation might have occurred (see [33] on rat liver after nine-month storage). For most marine taxa, the lack of comparison to suitable reference points (e.g., before/after drying and before/after dry storage) lead labs to work on frozen (e.g., [14,15]) as well as on freeze-dried tissues (e.g., [34–36]).
In this study, lipid class and FA compositions obtained from six extraction protocols were compared on a quantitative (concentration) and qualitative basis (percentage). These protocols differed in term of tissue state (wet vs dry) and extraction method (automat vs manual potter vs leave solvent to work). Statistical differences, reproducibility and repeatability were the main criteria used to compare the six protocols, all tested in the same laboratory. Reproducibility was defined as the agreement between test results obtained with different protocols and repeatability as the agreement of replicate tests carried out for each protocol. For dry samples, the effects of storage mode (freezer vs gas nitrogen vs dry room) and duration (t0 reference vs t+1 month vs
t+3 months) were tested. The loss in lipid classes and FA was used as the criteria
to assess storage modes, regardless of the lipid degradation products. All protocols for marine lipid extraction and tissue storage were tested on seven species from different phylum and biomes, including temperate, tropical and cultured fish, crustacean, cephalopod, and shellfish, to account for diverse marine lipid profiles.
2. MATERIAL AND METHODS 2.1. Tissue homogenates
Around 40 g of tissue were sampled from each of the seven selected marine species. Tissue samples were collected from (i) a single individual for the emperor red snapper Lutjanus sebae (dorsal muscle), the common octopus Octopus vulgaris (muscle), and the painted spiny lobster Panulirus versicolor (tail muscle), three tropical species from coastal waters of Mahé Island (Seychelles, Indian Ocean); (ii) a pool of individuals for the blue mussel Mytilus edulis (n=40; mantle), the European pilchard Sardina pilchardus (n=15; dorsal and ventral muscle), the cultured gilthead sea bream Sparus aurata (n=4; dorsal muscle), and the Atlantic bluefin tuna Thunnus thynnus (n=10; pectoral white muscle). Blue mussels were obtained from coastal waters of western Brittany (France, Atlantic Ocean), European pilchard and Atlantic bluefin tuna were collected in the Gulf of Lions (Mediterranean Sea), and cultured gilthead sea bream were obtained from the Ifremer marine station of Palavas, France. Wild species were collected during research programs, in collaboration with local fishermen. For each species, deep-frozen tissues were homogenized, i.e. minced in small pieces of ca. 3-5 mg over ice packs covered with a sheet of foil to avoid defrost and contamination.
Homogenates were not pulverized into a thinner powder so that the grinding performance of the potter homogenizer could be assessed afterwards. Finally, the seven species homogenates were stored in polyethylene bottles at -80°C until further analyses.
2.2. Freeze-drying and water content
Thirty-six sub-samples were freeze-dried from each of the seven species homogenates previously minced (12 and 24 sub-samples for lipid extraction and storage comparison, respectively). For each sub-sample, about 1 g of frozen homogenate was weighted in a cryotube to the nearest 0.1 mg on an Adventurer pro balance (OHAUS, Nänikon, Swiss) and freeze-dried for 48 hours in the dark using an Alpha 1-4 freeze-dryer (Christ, Osterode am Harz, Germany). For each species, 12 dry sub-samples were weighted to gravimetrically measure the water content and lipids were chemically extracted in less than 24 hours after freeze-drying (see 2.3. Lipid extraction protocols). The 24 remaining dry sub-samples were stored using different methods (see 2.4. Storage of dry tissues).
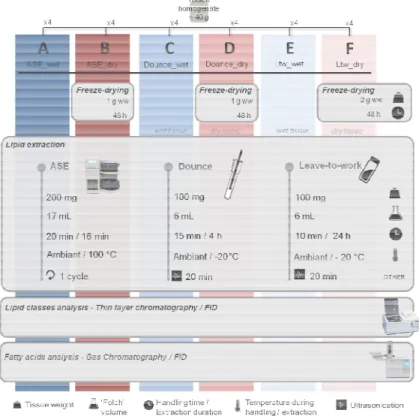
2.3. Lipid extraction protocols
For each specie homogenate, six protocols for lipid extraction (numbered from A to F) were tested over four replicates. Tissues used for lipid extraction were either frozen at -80°C [protocols A, C, E] or freeze-dried [protocols B, D, F] (Fig. 1). Lipids were extracted from tissues with different processing: a pressurized automat [protocols A and B], a Dounce potter homogenizer [protocols C and D], or a ‘leave-to-work’ period of 24 hours [protocols E and F] (Fig. 1). Before extraction, all tissues were weighted to the nearest 0.1 µg on a XP6 analytical balance (Metler-Toledo, Viroflay, France). Lipids were extracted using a modified solvent mixture of Folch et al. [9] (dichloromethane:methanol; CH2Cl2:MeOH; 2:1, v/v) [37,38] with butylated
hydroxytoluene as an antioxidant (0.01%; w/w). Tissue and solvent quantities were adapted to each method in such a way that the ratio of modified Folch mixture to sample was 50:1 (w/w) to insure a complete lipid extraction [39].
2.3.1 Protocols A and B [ASE]
An automated pressurized liquid extraction technique of trade name ASE 200 for Accelerated Solvent Extractor (Dionex, Voisins de Bretonneux, France) was used. The ASE program was set to a cycle that includes 5 min preheat and 10 min of static phase heat at 100 °C and pressurized to 130 psi. This program consumes 16-17 mL of the modified Folch mixture. ASE cells contained ca. 300 mg (frozen) or 100 mg (dry) of tissue homogenate mixed with glass beads. For protocol A, ASE cells were assembled and placed into the rack progressively to avoid tissue defrost before extraction. Extracts were flushed with nitrogen and stored 2 to 4 hours at -20°C as they arrived to the end of the ASE cycle.
2.3.2 Protocols C and D [Dounce]
A 15-cm3 Dounce potter homogenizer (glass/Teflon; Fischer Scientific,
Illkirch, France) was used. Lipids were extracted from ca. 120 mg (frozen) or 80 mg (dry) of tissue homogenate with 6 mL of the modified Folch mixture (3 rinses with 2 mL) and transferred into glass vials. Extracts were flushed with nitrogen, vortexed, sonicated for 20 minutes (ultrasound bath in +20 °C-water), and stored 2 to 4 hours at -20°C.
2.3.3 Protocols E and F [Ltw]
The solvent was left to work on the tissue homogenate for 24 hours. Lipids were extracted from ca. 120 mg (frozen) or 80 mg (dry) of tissue with 6 mL of the modified Folch mixture directly added into glass vial. Extracts were flushed with nitrogen, vortexed, sonicated for 20 minutes (ultrasound bath in +20 °C-water), and stored 24 hours at -20°C. This protocol applied on dry samples (protocol-F) was set by Cruz et al. [40] as a reference for lipid extraction from O. vulgaris and S. pilchardus, and it provided similar results to the AOAC Official Method 996.06 on flaxseed [41]. For the present study, Protocol-F was therefore used as the reference protocol.
Fig. 1. Outline of the six protocols used for lipid extraction (A to F) compared across seven marine species (see Material & Methods for details). Comparisons are based upon lipid class and fatty acid analyses. Methods using deep-frozen wet tissues ( 80°C) are in blue, those using freeze-dried tissues are in red. Weights, volumes and handling time are given for one sample. Logos legend is at the bottom.
Extracts were brought back to room temperature, mix
potassium chloride (0.88%; m/v) to obtain the final ratio of 8:4:3 CH2Cl2:MeOH:Water (v/v/v) [9], and were then centrifuge
rpm and 15°C. The lower organic layers containing dissolved transferred into glass vials using Pasteur pipette and evaporated with nitrogen using an N-Evap 111 extractor (OA-SYS, Berlin, USA) extracts were then stored in CH2Cl2 and nitrogen at -20°C
before analyses.
2.4. Storage of dry tissues
For each species, the 24 freeze-dried sub-samples were storage modes and two durations, in four replicates. Immediate drying, cryotubes containing dry tissues were stored: (i)
(ii) in dry room (28°C and 30% air humidity), sealed with paraffin nitrogen (inert gas) or; (iii) straight in dry room (28°C and 30% air humidity) These samples were stored for either one or three
(‘Leave-to-work’) was used for lipid extraction. For comparison (reference), lipid classes were analyzed after both storage
and t+3months) and fatty acids were analyzed at t+3months because of time and
financial constraints. Seven of the 168 replicates were lost during preparation (glass vial broken).
2.5. Lipid class quantification
Lipid extracts in CH2Cl2 were spotted on quartz chromarods S5 (i.e. rods
covered with silica; Bionis, St Georges Motel, France) using a glass syringe. They were separated into lipid classes in a development system: (i) 40 minutes in 80:20:1 hexane/diet
acid; and (ii) 15 minutes in pure acetone, followed by two times 10 minutes in 5:4:1 chloroform/methanol/water [42]. Lipid classes were quantified afte each separation phase using an Iatroscan MK-6s (Iatron Laboratories Mitsubishi Chemical Medience, Tokyo, Japan
chromatography − flame ionization detector analyzer (TLC
hydrogen flow set to 160-170 mL.min-1. The signal was detected in millivolts
and quantified using lipid standards (Cholesteryl palmi tripalmitate, cholesterol, oleic acid, Diglyceryl palmitate,
phosphatidil choline; Sigma-Aldrich, St Quentin Fallavier, France PeakSimple 3.93 software (SRI Instruments, Earl St. Torrance, USA minimum peak area considered was 0.1 mV.mm-1. Concentrations in
Outline of the six protocols used for lipid extraction (A to seven marine species (see Material & on lipid classes frozen wet tissues (-dried tissues are in red. are given for one sample.
mixed with aqueous the final ratio of 8:4:3 centrifuged for 8 min at 1000 dissolved lipids were evaporated to dryness SYS, Berlin, USA). Lipid 20°C for one to five days
samples were assigned to three Immediately after
freeze-) in a -20°C-freezer; sealed with paraffin and (28°C and 30% air humidity). months. Protocol-F For comparisons with t0
storage durations (t+1month
because of time and replicates were lost during preparation
chromarods S5 (i.e. rods ) using a 5 µL airtight separated into lipid classes in a two-phase ) 40 minutes in 80:20:1 hexane/diethyl-ether/formic in pure acetone, followed by two times 10 minutes in . Lipid classes were quantified after 6s (Iatron Laboratories, Mitsubishi Chemical Medience, Tokyo, Japan) thin-layer flame ionization detector analyzer (TLC−FID) with . The signal was detected in millivolts and quantified using lipid standards (Cholesteryl palmitate, glyceryl ryl palmitate, DL-palmitine and , St Quentin Fallavier, France) with Earl St. Torrance, USA). The Concentrations in six lipid
classes were determined (from least to most polar (TAG), free fatty acid (FFA), sterols (ST),
mobile polar lipids (AMPL, including monoacylglycerol, glycolipids) and phospholipids (PL). The mean
quantification method was 17% (see section 3.2
classes) based on 20 measurements of laboratory standards achieved over different days.
2.6. Fatty acid analysis
For FA quantification, tricosanoic acid (23:0 standard to 250 µl of lipid extract. Lipids were H2SO4 (3.8 % in MeOH) at 100 °C for 10 min
with 1.5 mL of hexane-saturated distilled water. F (FAME) were separated and quantified by gas chromatography FID (Varian CP8400 gas chromatograph; Agilent,
LEMAR Lipidocean facility (Brest, France). splitless mode at an oven temperature of 60
simultaneously in two columns to improve FAME identification ZB-WAX and apolar ZB-5HT columns, both
diameter, 0.25 µm film thickness; Phenomenex temperature was raised to 150 °C at 50 °C.min 185 °C at 1.5 °C.min-1, to 225 °C at 2.4 °C
5.5 °C.min-1. FAME were identified by comparing sample retention times to
those of commercial standard mixture (37-components FAME Mix; Sigma Aldrich) using Galaxie 1.9.3.2 software (Agilent
converted into µg of FA based on the standard
variability for FA quantification was 8.1% based on five standard mixture achieved on different days
20:1n-7 and 22:2i and between 21:5n-3 and 22:3nmi in mussel samples. Thirty-one FA > 0.8% of total FA in at least one sample were ke
analysis.
2.7. Data analysis
In the subsequent sections, “wet tissue” refer tissue to freeze-dried tissue. All results are weight basis (dw) for comparison across protocols ± SD. For protocols based on wet tissues (A, C and E measured before/after freeze-drying was used to convert
3
(from least to most polar lipid class): triacylglycerols sterols (ST), diacylglycerols (DAG), acetone monoacylglycerol, pigments, and mean analytical variability for this section 3.2 for details on each lipid laboratory standards achieved over
(23:0; 2.3 µg) was added as internal ipids were transesterified with 800 µL of min [43] and washed three times led water. Fatty acid methyl esters gas chromatography coupled with a ; Agilent, Les Ulis, France) at the LEMAR Lipidocean facility (Brest, France). Samples (2 µL) were injected in splitless mode at an oven temperature of 60 °C and carried by helium gas FAME identification (polar Zebron 5HT columns, both 30 m in length, 0.25 mm internal diameter, 0.25 µm film thickness; Phenomenex, Le Pecq, France). The oven .min-1, to 170 °C at 3.5 °C.min-1, to , to 225 °C at 2.4 °C.min-1and then to 250 °C at
FAME were identified by comparing sample retention times to components FAME Mix; Sigma-Agilent). FAME peak area was standard peak area. The mean analytical % based on five measurements of the achieved on different days. Co-elution occurs between 3 and 22:3nmi in mussel samples. in at least one sample were kept for data
refers to frozen wet tissue and dry results are expressed in µg.mg-1 on a dry
protocols and are presented as mean (A, C and E), the water content used to convert tissue wet mass into
4
tissue dry mass. Species were grouped into “Lean” and “Fat” species for visualization purpose, the threshold was arbitrary set at 120 µg.mg-1 dw (Lean
species: L. sebae, M. edulis, O. vulgaris and P. versicolor, and fat species: S. pilchardus, S. aurata and T. thynnus).
Lipid class and FA concentrations (log and square root transformed to achieved normality of residuals in the analysis, respectively) were compared among lipid extraction protocols (three factors: tissue state, extraction method and interaction) and among dry storage (three factors: storage mode, duration and interaction) using MANOVAs (multivariate analyses of variance; F-test). The higher the F value, the stronger the influence of the factor. Normality of residuals was tested with the univariate Shapiro-Wilk test. When residuals were not normally distributed, a non-parametric Scheirer-Ray-Hare test (H-test) was used instead of a MANOVA. Post-hoc tests (parametric TukeyHSD or non-parametric Dunn Holm-adjusted test) were applied to refine differences among the factors’ modalities of the lipid extraction protocols and the storage modes factors. Principal Component Analyses (PCA) and PERMANOVAs (multivariate analyses of variance with 999 permutations based on Euclidian distance matrix; Pseudo-F test) were applied on square root transformed % FA to compare FA profiles among lipid extraction protocols and dry storages. PERMANOVA is an analogous to non-parametric MANOVA: it partitions sums of squares of a multivariate dataset among factors and uses a permutation test.
Reproducibility and repeatability were assessed for each species homogenate. Reproducibility was defined for major lipid classes and FAs as the ratio between the quantity obtained with a given protocol to the quantity obtained with the reference protocol-F [40]. The reproducibility of each protocol was considered acceptable when comprised between 90-110%. Repeatability was assessed for each compound with replicate samples through the coefficient of variation (CV), defined as the ratio of SD to the mean. The higher the CV, the lower the repeatability. Repeatability was considered acceptable when CV was below 10%. All statistical analyses were performed using R 3.5.0 software [44], ‘MVN’, ‘vegan’ and ‘dunn.test’ packages.
3. RESULTS
3.1. Influence of lipid extraction protocols
The tissue state had little impact on lipid classes and FA concentrations, aside from AMPL that were higher when extracted from wet tissue for all species (Fig. 2; Table S1). However, some species-specific differences were observed. For L. sebae, the tissue state only affected lipid classes, especially the minor ones such as DAG (0.8±0.6 and 2.0±1.3 µg.mg-1 in dry and wet tissues, respectively; p<0.001) and ST (1.6±0.3 and 2.0±0.3 µg.mg-1; p<0.01,
in dry and wet tissues, respectively). For M. edulis, dry tissue was associated with higher TAG (20.4±6.3 and 9.6±7.7 µg.mg-1 in dry and wet tissues,
respectively; p<0.001) and ST contents (4.9±1.3 and 3.7±1.1 µg.mg-1 in dry
and wet tissues, respectively; p<0.01), but had no influence on FA concentrations (quantitative) (Table 1). For O. vulgaris, no impact of the tissue state was observed, excepted for DAG (0.2±0.4 and 2.6±2.2 µg.mg-1 in
dry and wet tissues, respectively; p<0.001). For P. versicolor, while most lipid classes and FA concentrations were affected by tissue state (MANOVAs, Table 1) post-hoc tests detected no difference between dry and wet tissues (DAG: p=0.13; ST: p=0.08; PL: p=0.22; TLC: p=0.28). For S. pilchardus, no effect of tissue state was detected, with the exception of some MUFA concentrations being higher in wet tissues, such as cetoleic acid 22:1n-11 (1.8±0.6 and 3.2±1.5 µg.mg-1 in dry and wet tissues, respectively;
p<0.01). The tissue state had no impact on FA concentrations and lipid classes of T. thynnus and only affected ST in S. aurata (2.2±0.4 and 2.9±0.7 µg.mg-1 in dry and wet tissues, respectively; p<0.01).
The extraction method had a greater influence than tissue state on the quantity of extracted lipids, with higher levels obtained with the Ltw methods, as revealed by the MANOVAs F-values (data not shown). Among lean species, this tendency was particularly evident for M. edulis, with TAG ranking 8.8±9.6 < 15.1±4.7 < 21.2±7.3 µg.mg-1 and PL ranking 32.0±10.7 < 43.2±4.6 < 49.4±11.2 µg.mg-1 with ASE, Dounce and Ltw methods, respectively. For
the three other lean species, ASE provided a good extraction for PL, but results were highly variable due to an interaction with the tissue state
(see last paragraph below) and FA concentrations were not affected by this pattern, most FA being higher when extracted with the Ltw methods (Fig. 3). For fat species, the extraction method influenced differently lipid classes and FA concentrations. For instance, the extraction method had no effect on the most important lipid class of S. aurata (TAG: 205±49.5 µg.mg-1; F=3.0,
p=0.07) but most of FA concentrations were higher with Ltw extraction methods such as PUFA (PUFA=32.2±3.6 µg.mg-1 with ASE and Dounce extraction methods and 38.1±4.6 µg.mg-1 with Ltw methods). Only FA
concentrations from S. pilchardus and T. thynnus were unaffected by the extraction method, despite the higher TAG concentrations obtained with the ASE and Ltw extraction methods, respectively (Table 1).
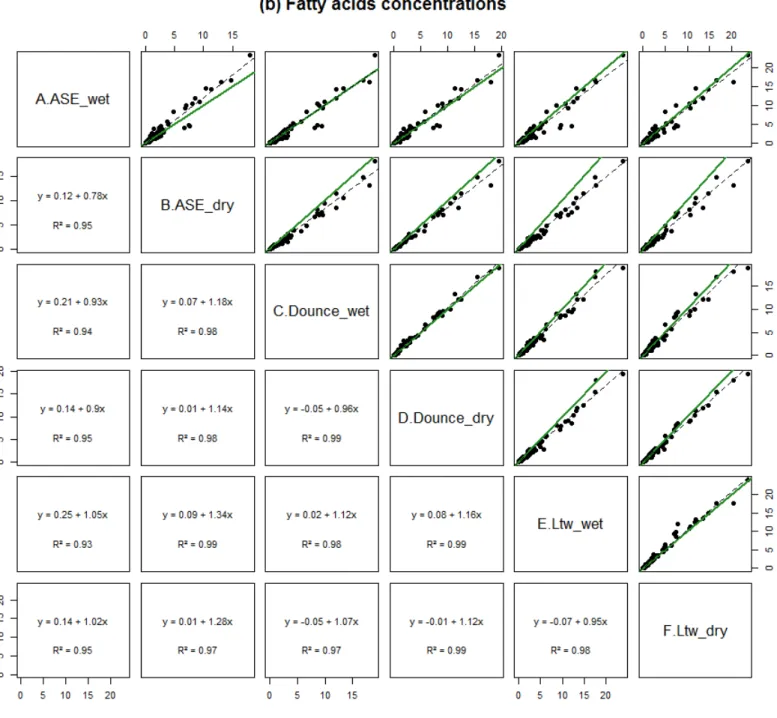
The interaction between tissue state and extraction method (i.e. the six protocols) affected the lipid classes of most species and the FA of M. edulis, O. vulgaris, and P. versicolor. Regarding lipid classes, PL contents were higher by 52-57% for L. sebae, O. vulgaris, and P. versicolor using protocol-B and TAG contents were higher by 116-138% for S. pilchardus and S. aurata using protocol-A rather than the five other protocols (Table S1). Regarding FA, protocol-A lead to the lowest concentrations for the lean species whereas no difference was observed across the six protocols for the three fat species (Fig. 3). Regardless of species, significant and strong linear relationships (r² around 0.9) between extraction protocols would permit a correction for lipid classes and FA concentrations (Fig. S2). The qualitative FA profiles, expressed in percent, were however similar between the six protocols for each species (Fig. 4a), with no effect of tissue state (Pseudo-F=0.1, p=0.9), extraction method (Pseudo-F=0.1, p=0.9) and their interaction (Pseudo-F=0.1, p=0.9).
3.2. Reproducibility & repeatability of extraction protocols
The reproducibility of the five tested protocols compared to the reference protocol-F varied across species: it was particularly low for L. sebae (less than 70% reproducibility for FA, except for protocol-E) and good for S. pilchardus (87-120% for FA concentrations across all protocols) (Table 2a). Protocol-D provided similar results to protocol-F with most lipid contents comprised within 90-110% of those obtained with protocol-F, except for L. sebae (Table 2a). Protocol-E was also in good agreement with protocol-F for most species, but led to higher lipid classes and FA quantities in lean species. For instance, the maximal overestimation yielded by protocol-E was obtained for 18:1n-9 from M. edulis (161% higher, with 0.9±0.2 and 0.6±0.2 µg.mg-1 obtained with
protocol-E and -F, respectively). In contrast, protocol-A was the most dissimilar to protocol-F due to a lower amount of lipid classes and FA extracted, with an average reproducibility of 86% (min-max=44-198%) for lipid classes and of 78% (min-max=39-155%) for FA across all species. Protocol-B and protocol-C also showed poor reproducibility compared to protocol-F, with lower lipid classes and FA quantities obtained for L. sebae, P. versicolor, S. aurata and T. thynnus (Table 2a).
Overall, the repeatability did not fall within the range of the analytical variability (TAG: 21%; FFA: 26%; ST: 8%; DAG: 9%; AMPL: 29%; PL: 10%, and FA: 8%) and was attributable to the extraction protocols (Table 4b). The repeatability also varied across species: T. thynnus showed the lowest repeatability among the six protocols (mean CV=39%; min-max=19-67%) and S. aurata and P. versicolor the best one (CV<10% in most protocols; Table 2b). For lipid classes, the best repeatability was obtained with protocol-E (mean CV=18%; min-max CV=6-36%) and the lowest with protocol-F (mean CV=26%; min-max CV=10-117%). For FA concentrations, the mean repeatability ranked protocol-B (mean CV=11%; min-max CV=1-44%) > protocol-D (mean CV=14%; min-max=1-45%) > protocol-E (mean CV=18%, min-max=3-42%) > protocol-F (mean CV=20%; min-max CV=2-68%) > protocol-A (mean CV=23%; min-max CV=2-45%) and protocol-C (mean CV=23%; min-max CV=1-67%). However, the repeatability of each protocol was also variable across species. For example, protocol-B provided an acceptable repeatability for FA of M. edulis (mean CV=4%; min-max=1-9%) but an unacceptable one for T. thynnus (mean CV=36%; min-max=24-44 %). No general difference between lean and fat species was noticed for reproducibility and repeatability.
5
Tissue state Method Tissue state × Method Tissue state Method Tissue state × Method Tissue state Method Tissue state × Method Tissue state Method Tissue state × Method Tissue state Method Tissue state × Method Tissue state Method Tissue state × Method Tissue state Method Tissue state × Method Lipid classes TAG ns ns ns *** *** *** ns ns ns _ _ _ ns ** ** ns ns *** ns ** ns DAG *** * ** ns ns *** *** ns ns ** *** *** * *** *** ns *** ** ns *** ns FFA *** ns ns *** ns ns ns ns ns ns *** ns ns *** ns ns ns * ns ** ns ST ** ** ns ** ** ns ns ns * ** *** *** ns ns ns ** ns ns ns * ns AMPL *** *** *** *** ns * *** ** * *** * ns *** *** ns * *** ** *** *** *** PL * *** *** ns *** * ns ns *** * ns *** ns ns ns ns * ns ns *** ns Total lipid * *** *** ns ** * * ns *** ** ns *** ns ns *** ns ns *** * *** ns Fatty acids 14:0 ns ns ns ns ** ** _ _ _ _ _ _ * ns ns ns ns ns ns ns ns 15:0 _ _ _ ns *** ** _ _ _ _ _ _ _ _ _ _ _ _ _ _ _ 16:0 ns *** ns ns *** * * *** *** * *** ** * ns ns ns ** ns ns ns ns 17:0 ns ** ns ns *** ns ns *** * ns *** ns ns ns ns _ _ _ ns ns ns 18:0 ns ns ns ns *** ns ns ** ** ns *** *** ns ns ns ns *** ns ns ns ns 16:1n-7 ns ns ns ns * * ns *** *** ns *** *** * ns ns ns * ns ns ns ns 18:1n-9 ns ** ns ns * ** ns *** *** * *** * ns ns ns ns * ns ns ns ns 18:1n-7 ns *** ns ns *** ns ns *** ** ns *** *** ns ns ns * ** ns ns ns ns 20:1n-9 _ _ _ ns *** * _ _ _ _ _ _ ** ns ns ns * * ns ns ns 20:1n-7 _ _ _ ns *** ** ns * ns _ _ _ _ _ _ _ _ _ _ _ _ 22:1n-11 _ _ _ _ _ _ _ _ _ _ _ _ ** ns ns ns * * ns * ns 24:1n-9 ns *** ns _ _ _ _ _ _ _ _ _ ns ns ns _ _ _ ns ns ns 16:4n-3 ns *** ns ns *** ns _ _ _ _ _ _ * ns ns _ _ _ _ _ _ 18:2n-6 ns ** ns ns ** ** _ _ _ * *** * ns ns ns ns * ns ns ns ns 18:3n-3 _ _ _ ns ** *** _ _ _ * *** ns ns ns ns ns * * ns ns ns 18:4n-3 _ _ _ _ _ _ _ _ _ * ** *** ** ns ns ns ns * ns *** ns 20:2i _ _ _ ns ** ** _ _ _ _ _ _ _ _ _ _ _ _ _ _ _ 20:2j _ _ _ ns ** * _ _ _ _ _ _ _ _ _ _ _ _ _ _ _ 20:4n-6 ns *** ** ns *** * ns *** *** * *** * ns ns ns _ _ _ _ _ _ 20:4n-3 _ _ _ _ _ _ _ _ _ _ _ _ ns ns ns ns * ns ns ns ns 20:5n-3 ns *** ns ns *** * ns *** *** * *** * ns ns ns ns ** ns ns ns ns 22:3nmi _ _ _ ns *** * _ _ _ _ _ _ _ _ _ _ _ _ _ _ _ 22:4n-6 ns *** ns _ _ _ ns *** *** ** *** *** _ _ _ ns *** ns ns ns ns 22:5n-6 ns *** ns _ _ _ ns *** *** * *** ns ns ns ns _ _ _ ns ns ns 22:5n-3 ns * ns ns *** * * *** *** * *** *** ns ns ns ns ** ns ns ns ns 22:6n-3 ns *** ns ns *** *** ns *** *** * *** *** ns ns ns ns *** ns ns ns ns 18:0DMA _ _ _ ns *** * ns *** *** ns *** * _ _ _ _ _ _ _ _ _ n-3 PUFA ns *** ns ns *** ** ns *** *** * *** * ns ns ns ns ** ns ns ns ns n-6 PUFA ns *** ns ns *** * ns *** *** * *** * ns ns ns ns * ns ns ns ns SFA ns *** ns ns *** * ns *** *** ns *** *** * ns ns ns ** ns ns ns ns MUFA ns * ns ns *** * ns *** *** * *** * * ns ns ns * ns ns ns ns PUFA ns *** ns ns *** * ns *** *** * *** * ns ns ns ns ** ns ns ns ns Total FA ns *** ns ns *** * ns *** *** * *** * * ns ns ns * ns ns ns nsSardina pilchardus Sparus aurata (cultured) Thunnus thynnus Lutjanus sebae Mytilus edulis Octopus vulgaris Panulirus versicolor
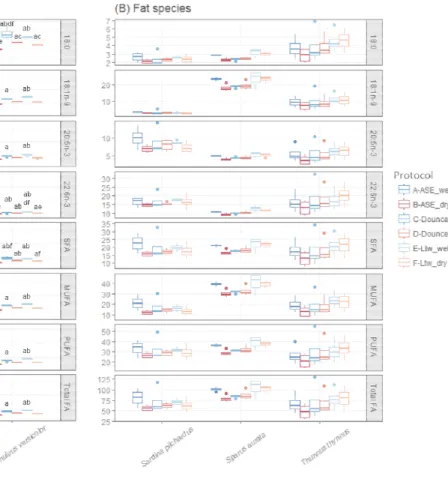
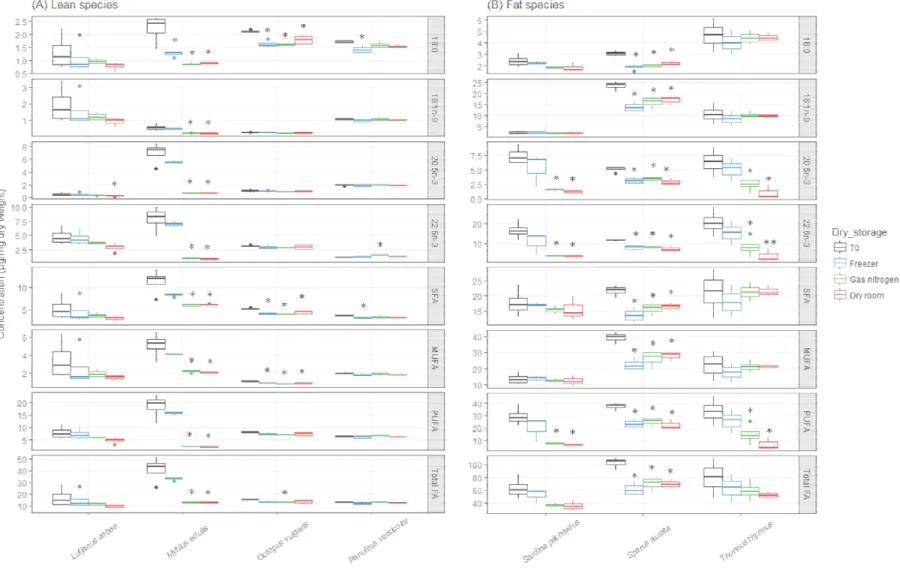
Fig 2. Distribution of lipid classes (triacylglycerols (TAG), diacylglycerols (DAG), free fatty acids (FFA), sterols (ST), acetone mobile polar lipids (AMPL) and phospholipids (PL)) and the total lipid content (TLC) of (A) lean species (TLC < 120 µg.mg-1 dry weight) and (B) fat species according to six protocols for lipid
extraction (A to F, blue and red based colors for wet and dry tissue, respectively see Material and Methods for details). Thick bar is the median value, points are outliers of four replicates, and the box contains 50% of the data.
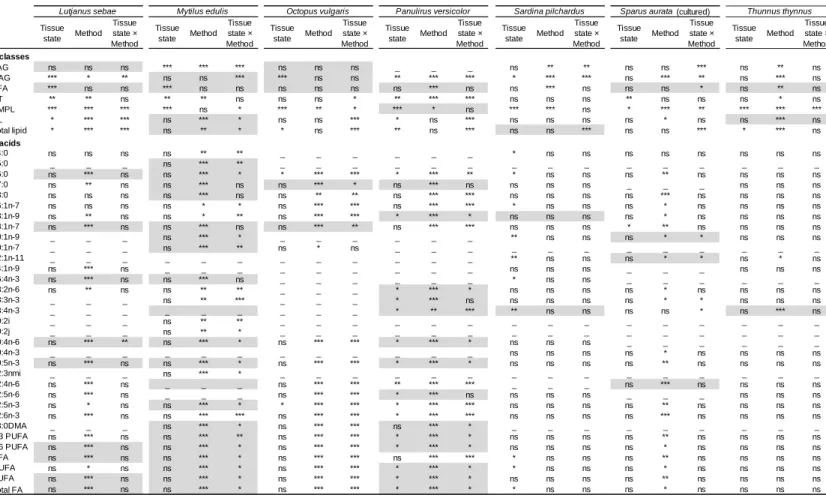
Table 1. Probabilities from MANOVA (F-test) or Scheirer-Ray-Hare test (H-test; grey lines) testing the effects of tissue state (dry and wet), method (ASE, Dounce potter and Ltw) and their interaction on lipid class (TAG: triacylglycerols, DAG: diacylglycerols, FFA: free fatty acids, ST: sterols, AMPL: acetone mobile polar lipids, PL: phospholipids) and total lipid content (TLC) and fatty acid concentrations (SFA=Saturated FA; MUFA=Monounsaturated FA; PUFA=Polyunsaturated FA) determined in seven marine species. Codes: ns not significant, * p<0.05, ** p<0.01, *** p<0.001. _ denotes FA <0.8% of total FA.
Fig 3. Distribution of four specific fatty acids (Stearic acid and FA families (SFA=Saturated FA; MUFA=Monounsaturated FA;
protocols (A to F, blue and red based colors for wet and dry tissue, respectively; outliers of four replicates, and the box contains 50% of the data. Letters indicate b=different from protocol B...).
3.3. Influence of dry storage
The storage of dry tissue had contrasted effects on marine lipid and among species (Table 3). One month of freezer storage ha lipid classes, aside from ST in O. vulgaris and P. versicolor storage modes led to lower values of lipid classes, especially for For instance, the TAG content of M. edulis was 25.4±8.1 µg.mg and decreased to 2.0±0.4 and 2.3±0.7 µg.mg-1 after one-month
room and with nitrogen, respectively (Fig. 5a). No decrease in lipid class concentrations was however observed after one-month storage
after nitrogen flushing for T. thynnus (Fig. 5b).
After three months, a species-specific decrease in lipid class and FA concentrations was observed regardless of the storage mode.
the less affected species for both lipid classes and FA concentrations three months of freezer storage, P. versicolor was the most affect class concentrations and S. aurata the most affected for FA
For instance, the 18:1n-9 in S. aurata ranked 23.6±2.1 (reference) > 17.1± (dry room) > 16.2±2.8 (nitrogen) > 14.0±2.2 µg.mg-1 (freezer) (Fig.
S2f). For the other species, after three months most FA concentrations as: reference ~ freezer > nitrogen > dry room. Some differences between reference and freezer storage were however observed, mostly for
but they corresponded to minor losses: e.g. 22:6n-3 was the
FA of O. vulgaris and it ranked 3.1±0.1 (reference) > 2.9±0.3 (freezer) > 2.9±0.4 (dry room) > 2.8±0.0 (nitrogen) (Table S2c). Finally,
concentrations decreased for all FA (including SFA, MUFA and PUFA FA profiles expressed in percent were the same between reference and storage (Pseudo-F=0.1, p=1.0), and between dry room and nitrogen storages (Pseudo-F=0.3, p=0.05) (Fig. 4b and Table S2). FA profiles were different between reference and dry room storage (Pseudo-F=4.7, p<0.01), reference and nitrogen storage (Pseudo-F=3.0, p<0.01).
Stearic acid 18:0; Oleic acid 18:1n-9; Eicosapentaenoic acid (EPA) 20:5n-3; Docosahexaenoic (DHA) 22:6n (SFA=Saturated FA; MUFA=Monounsaturated FA; PUFA=Polyunsaturated FA) of (A) lean species and (B) fat species according to six
blue and red based colors for wet and dry tissue, respectively; see Material and Methods for details). Thick bar is the median value, points are f four replicates, and the box contains 50% of the data. Letters indicate significant difference among methods at p<0.05 (i.e. a=different from
marine lipid compounds One month of freezer storage had no effect on versicolor. The two other , especially for M. edulis. 25.4±8.1 µg.mg-1 (reference)
month storage in dry No decrease in lipid class storage in dry room or
specific decrease in lipid class and FA de. T. thynnus was concentrations after the most affected for lipid FA concentrations. ranked 23.6±2.1 (reference) > 17.1±2.1 reezer) (Fig. 6; Table concentrations ranked ifferences between reference and freezer storage were however observed, mostly for O. vulgaris, the most important 2.9±0.3 (freezer) > Finally, although the (including SFA, MUFA and PUFA), the eference and freezer nitrogen storages FA profiles were different F=4.7, p<0.01), and
4. DISCUSSION
Six lipid extraction protocols, including different methods, and three storage modes of dry tissue
recommendations for protocols of lipid analysis in marine animals extraction, the tissue state (frozen or freeze-dried)
but the extraction method did. Linear corrections permitted to correct this effect. For the storage of dry tissues, one-month
was found acceptable for quantitative studies, while storage modes led to lipid loss. Three-month storage in satisfactory results for qualitative studies of FA.
4.1. How to extract lipids from marine tissues?
Except for P. versicolor, no difference was observed between dry and wet tissues while the extraction method affected the
studied marine species. Dounce (potter homogenizer) and methods provided more reproducible results than the ASE ones. ASE methods, an increase in the extraction temperature
a solution to extract all lipids and improve the reproducibility highest lipid class and FA concentrations were obtained with the
to-work” protocols (protocol-E and -F). These two protocols had however a low repeatability, especially protocol-F (chosen
has been detrimental to the assessment of reproducibility. between protocols is however predictable and the reproducibility improved by applying a correction on concentration results
of the six protocols was low but of the same order of magnitude as the repeatability obtained with other protocols on frozen fish species (13 [20]. Quadruplicating the samples was probably not enough
extraction variability and could explain this low repeatability. Considering the high variability of the method used for lipid class
6
3; Docosahexaenoic (DHA) 22:6n-3) of (A) lean species and (B) fat species according to six see Material and Methods for details). Thick bar is the median value, points are
(i.e. a=different from protocol A,
different tissue states and extraction , and three storage modes of dry tissues, were compared to make lipid analysis in marine animals. For lipid dried) did not affect the results, Linear corrections permitted to correct this month storage in a -20°C-freezer while longer storage or other storage in a -20°C-freezer gave
o difference was observed between dry and wet the lipid composition of all Dounce (potter homogenizer) and Leave-to-work results than the ASE ones. Regarding the extraction temperature up to 120°C might be to extract all lipids and improve the reproducibility [19]. The were obtained with the two “Leave-F). These two protocols had however a
as reference protocol), which reproducibility. The difference between protocols is however predictable and the reproducibility might be improved by applying a correction on concentration results. The repeatability same order of magnitude as the ined with other protocols on frozen fish species (13-18%) the samples was probably not enough to assess the this low repeatability. Considering the ipid class quantification (mean
7
CV=17%), 10 replicates would have provided a better overview of the repeatability of each protocol. The mincing of the initial homogenates was ruled out as being responsible for the low repeatability because (i) protocols C and -D included a fine grinding and were also associated with low repeatability, and (ii) some homogenates were obtained from a single individual and a single tissue type without any improvement in repeatability (L. sebae, O. vulgaris and P. versicolor).
Leave the solvent to work on tissue (regardless of tissue state) was the simplest protocol to implement, requiring little handling and preparation (ca. 10 min per sample). In this study, tissue homogenates were minced in small pieces (ca. 3-5 mg). Such a preparation was required for protocols –E and -F to work properly. Several teams already used a similar protocol after ball grinding frozen tissues (e.g. [18]) but it involves handling liquid nitrogen with care (-195°C) and to carefully clean equipment between samples to avoid cross-contamination. A safer and faster processing as the protocol-E might be sufficient to extract lipids but its repeatability should be improved for some species, especially L. sebae, M. edulis and T. thynnus.
A continuous agitation during the extraction and a temperature increase (e.g. ambient temperature instead of -20°C) might be beneficial [45]. For the oyster C. gigas, Dunstan et al. [31] increased the lipid recovery by rehydrating dry tissue, but this result was not confirmed [46]. When lipid analyses are cheap such as TLC-FID, a compromise could be to use the simplest and fastest extraction protocol (e.g. protocol-E) but to extract lipids in duplicate or triplicate to overcome the low repeatability and the tissue heterogeneity. Such an approach is already used for some contaminant analysis when precision and accuracy tolerances are difficult to achieve (e.g. three replicates of each sample tissue were analyzed for a precise quantification of polycyclic aromatic hydrocarbon and total mercury in fish [47,48]).
Finally, the “Bligh and Dyer” extraction method [49], mainly consisting in a reduction of the solvent to sample ratio from the Folch method, would probably not be affected by the tissue state either. However, this method might have a reduced extraction efficiency for fat dry tissues, as observed on wet tissues [50].
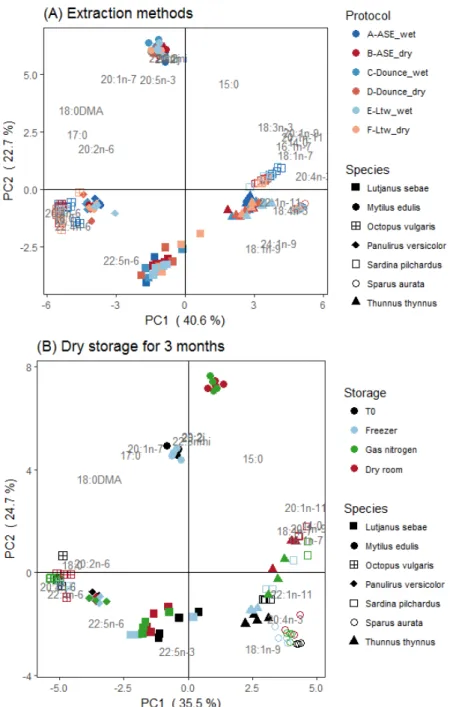
Fig 4. Principal component analyses (PCA) of total fatty acid (FA) percentage composition for seven marine species: (A) according to six lipid extraction protocols (A to F) and (B) three storage modes of dry tissues. Thirty-one FA >0.8% are considered for the PCA but only FA with cos² > 0.35 were represented to improve readability.
8
L . s e b a e M . e d u li s O . v u lg a ri s P . v e rs ic o lo r S . p il c h a rd u s S . a u ra ta T . th y n n u s L . s e b a e M . e d u li s O . v u lg a ri s P . v e rs ic o lo r S . p il c h a rd u s S . a u ra ta T . th y n n u s L . s e b a e M . e d u li s O . v u lg a ri s P . v e rs ic o lo r S . p il c h a rd u s S . a u ra ta T . th y n n u s L . s e b a e M . e d u li s O . v u lg a ri s P . v e rs ic o lo r S . p il c h a rd u s S . a u ra ta T . th y n n u s L . s e b a e M . e d u li s O . v u lg a ri s P . v e rs ic o lo r S . p il c h a rd u s S . a u ra ta T . th y n n u s L . s e b a e M . e d u li s O . v u lg a ri s P . v e rs ic o lo r S . p il c h a rd u s S . a u ra ta T . th y n n u s (B) Repeatability (% ) Lipid class TAG _ _ _ _ 18 14 23 _ 38 _ _ 31 12 47 _ 23 _ _ 51 21 40 129 17 _ _ 21 30 40 _ 25 _ _ 36 22 24 117 52 _ _ 19 26 51 ST 10 36 23 27 13 34 11 18 25 14 15 7 27 35 4 33 23 25 11 14 37 21 14 54 6 5 19 37 10 21 23 8 18 11 15 17 20 14 12 16 15 24 PL 8 43 17 29 14 14 24 13 26 26 21 20 20 24 5 32 17 24 8 21 40 8 15 10 9 13 21 50 9 18 19 10 26 23 12 21 18 22 12 20 12 23 TLC 8 25 10 27 12 14 19 11 25 17 19 23 12 41 4 19 12 23 33 20 32 16 8 3 9 11 27 29 7 15 13 6 13 18 19 31 27 18 10 16 24 45 Fatty acids 16:0 16 39 14 25 23 3 33 8 1 5 4 10 10 36 44 7 5 10 39 5 59 18 7 6 3 9 11 41 38 20 14 6 11 19 33 47 26 2 4 26 7 32 18:0 13 41 25 27 22 2 33 3 7 6 4 10 10 31 29 8 4 13 36 6 52 18 4 6 2 13 6 30 36 13 12 4 5 16 30 51 25 3 2 20 7 27 18:1n-9 19 25 13 27 25 5 32 8 9 5 4 14 12 41 46 14 12 4 53 4 67 18 12 5 3 21 14 41 38 20 10 6 7 21 29 56 34 7 3 25 9 39 18:1n-7 23 44 13 28 26 5 40 11 3 4 5 16 13 39 57 10 6 1 42 5 61 20 8 6 3 22 12 42 42 12 12 7 6 20 37 68 25 4 5 18 8 35 20:4n-6 9 44 12 30 19 4 34 2 3 3 4 10 12 24 17 10 9 8 34 5 37 25 1 6 3 11 6 20 35 14 11 6 7 11 27 25 29 3 2 20 6 19 20:5n-3 14 44 13 32 28 4 42 7 2 3 5 16 10 38 40 9 8 8 41 6 58 23 7 7 3 21 12 45 38 15 11 3 7 16 35 50 24 4 2 20 9 35 22:5n-3 20 44 10 28 26 4 45 11 6 2 5 16 12 44 51 9 10 8 34 4 65 26 7 5 3 19 13 44 40 17 10 6 9 18 38 58 27 2 4 18 8 39 22:6n-3 10 41 11 32 17 4 34 3 7 3 4 8 8 33 21 8 10 9 27 3 55 29 7 5 3 7 8 37 36 20 10 7 5 13 32 31 28 3 3 26 4 30 n-3 10 42 11 31 22 4 35 3 5 3 4 11 9 35 24 8 10 8 34 4 57 26 7 6 4 11 11 41 36 18 10 5 6 15 33 33 26 4 2 24 7 32 n-6 11 42 11 30 22 4 34 3 4 3 4 10 11 28 22 8 9 7 43 4 47 19 6 6 3 8 14 31 35 19 11 6 9 19 30 33 29 3 3 26 9 24 SFA 16 40 19 26 25 4 35 7 2 5 4 11 11 37 41 6 4 12 41 5 60 19 6 6 4 11 12 41 37 18 13 4 12 19 33 51 26 2 3 25 8 32 MUFA 22 42 16 28 32 5 34 11 6 9 4 16 12 42 54 10 6 3 48 4 64 20 8 4 3 16 15 42 39 12 8 6 20 23 30 63 28 6 4 25 8 37 PUFA 11 42 11 31 22 4 35 3 4 3 4 11 10 34 23 8 10 8 35 4 56 24 7 6 3 11 12 40 36 18 10 5 6 16 33 33 26 3 2 24 7 31 Total FA 14 42 12 29 25 4 34 6 2 3 4 12 11 37 35 7 8 4 41 4 60 16 6 6 2 12 13 41 37 17 11 5 11 20 32 46 27 3 3 25 8 33 Legend 1-10 11-15 16-20 >20A-ASE_wet B-ASE_dry C-Dounce_wet D-Dounce_dry E-Ltw_wet F-Ltw_dry
Table 2a. Percentage of reproducibility for the lipid extraction protocols A to E compared to protocol-F (used as reference) estimated from the results of lipid class (TAG: triacylglycerols, ST: sterols, PL: phospholipids) and total lipid content (TLC) and fatty acid concentrations (SFA=Saturated FA; MUFA=Monounsaturated FA; PUFA=Polyunsaturated FA). Green intensity denotes acceptability (90-110%).
Table 2b. Percentage of repeatability for the six lipid extraction protocols (A to F) corresponding to the coefficient of variation (CV) lipid class (TAG: triacylglycerols, ST: sterols, PL: phospholipids) and total lipid content (TLC) and fatty acid concentrations (SFA=Saturated FA; MUFA=Monounsaturated FA; PUFA=Polyunsaturated FA) estimated from four replicates of each marine species. Green intensity indicates different levels of CV (see legend). Values in bold did not fall within the range of analytical variability (TAG: 21%, ST: 8%, PL: 10%, individual FA: 8%). Note the analytical variability was not assessed for TLC and FA families.
L . s e b a e M . e d u li s O . v u lg a ri s P . v e rs ic o lo r S . p il c h a rd u s S . a u ra ta T . th y n n u s L . s e b a e M . e d u li s O . v u lg a ri s P . v e rs ic o lo r S . p il c h a rd u s S . a u ra ta T . th y n n u s L . s e b a e M . e d u li s O . v u lg a ri s P . v e rs ic o lo r S . p il c h a rd u s S . a u ra ta T . th y n n u s L . s e b a e M . e d u li s O . v u lg a ri s P . v e rs ic o lo r S . p il c h a rd u s S . a u ra ta T . th y n n u s L . s e b a e M . e d u li s O . v u lg a ri s P . v e rs ic o lo r S . p il c h a rd u s S . a u ra ta T . th y n n u s
(A) Reproducibility of protocol F ( % ) Lipid class TAG _ _ _ _ 198 136 88 _ 69 _ _ 105 79 51 _ 47 _ _ 147 103 54 27 72 _ _ 105 121 64 _ 67 _ _ 59 84 143 ST 88 44 59 46 89 122 66 75 76 75 81 92 79 90 106 72 78 87 92 101 94 79 86 53 73 90 99 75 115 82 71 82 107 145 112 PL 88 52 65 74 94 92 52 203 89 163 187 91 89 79 107 89 106 129 73 85 70 87 101 79 102 101 100 78 141 118 111 124 96 117 107 TLC 48 57 89 59 147 122 81 119 90 143 150 91 75 53 60 97 138 103 114 93 57 85 100 85 96 100 112 67 145 125 155 149 88 93 138 Fatty acids 16:0 55 61 64 70 123 98 87 63 99 88 83 89 77 63 66 116 104 125 113 82 89 64 105 91 101 96 85 88 98 130 96 124 112 101 99 18:0 62 71 78 64 110 93 80 72 97 96 86 88 75 61 79 122 120 135 98 78 84 75 108 99 107 96 82 85 106 95 103 123 108 105 97 18:1n-9 47 79 73 65 128 99 87 54 117 97 82 96 76 65 57 135 126 119 112 80 90 52 114 92 102 110 82 85 88 161 109 132 103 101 106 18:1n-7 39 62 66 65 127 103 87 45 97 90 82 92 79 58 50 118 113 123 113 83 88 46 102 90 101 107 86 85 76 124 101 128 110 108 103 20:4n-6 69 56 61 67 111 92 72 83 92 90 85 90 75 66 86 124 113 127 108 83 88 69 100 93 107 99 86 87 145 128 113 141 109 108 80 20:5n-3 50 58 62 64 135 97 87 62 96 95 80 94 77 58 65 117 120 124 120 86 88 53 103 96 104 108 86 88 104 135 119 138 117 103 97 22:5n-3 49 55 56 62 128 98 86 54 91 83 79 88 78 57 63 114 100 117 111 84 87 61 102 90 102 105 84 81 93 140 108 139 107 105 103 22:6n-3 58 56 56 62 100 93 79 69 96 85 78 89 79 64 70 119 105 119 102 84 89 59 107 89 101 93 88 88 121 154 109 140 106 106 87 n-3 57 58 59 64 114 96 80 67 97 87 79 90 78 62 68 119 108 121 110 84 89 57 106 90 103 98 87 88 120 145 111 139 110 105 91 n-6 61 58 61 66 113 98 78 72 97 88 84 87 77 63 76 123 110 126 110 83 88 64 105 92 106 96 85 89 129 146 114 140 108 103 87 SFA 55 63 71 68 127 97 85 63 99 92 85 89 77 60 67 117 112 132 114 81 86 65 106 95 106 97 85 85 96 122 99 121 112 101 99 MUFA 42 62 65 64 155 100 87 50 99 88 82 88 77 59 54 118 110 119 130 81 85 50 105 85 103 105 83 82 82 129 99 131 118 102 109 PUFA 58 58 60 65 114 97 79 68 97 88 81 90 77 62 70 119 109 123 110 84 89 59 105 91 104 98 86 88 122 146 113 140 110 104 90 Total FA 53 60 63 66 128 98 83 62 97 90 82 89 77 61 65 119 111 123 116 82 87 59 105 92 104 99 85 85 104 137 109 133 112 103 98 E-Ltw_wet >120
A-ASE_wet B-ASE_dry C-Dounce_wet D-Dounce_dry
Table 3. Probabilities from MANOVA (F-test) or Scheirer-Ray-Hare test (H-test; grey lines) testing the effect
interaction on lipid class concentrations (TAG: triacylglycerols, DAG: diacylglycerols, FFA: free fatty acids, ST: sterols, AMPL: acetone mobile polar lipids, PL: phospholip marine species. Codes: ns not significant, * p<0.05, ** p<0.01, *** p<0.001.
Storage mode Duration Storage mode × Duration Storage mode Duration Storage mode × Duration Storage mode Duration
Lipid class concentration
TAG ** ** * *** *** *** ns ns DAG ns ns ns *** ns ns ns * FFA * ns * *** ns ns * * ST *** *** ns *** *** ns *** *** AMPL ns * ns ** ** * * ** PL ** *** *** ** *** ns * ** Total lipid ** ns *** *** *** ns ns ***
Lutjanus sebae Mytilus edulis Octopus vulgaris
Fig 5. Distribution of lipid classes (triacylglycerols (TAG), diacylglycerols (DAG), free fatty acid (FFA), sterols (ST), acetone mobile polar lipids (AMPL) and phospholipids (PL)) and total lipid content (TLC) in dry tissues of (A) lean species and (B) fat species according to storage duration after freeze-drying (t+1month, t+3months) and storage mode
(freezer, nitrogen, dry room). Reference (t0) is in
black. The thick bar represents the median value and the points are outliers. * denotes difference from t0
at p<0.05.
test; grey lines) testing the effects storage duration after freeze-drying (t0, t+1month, t+3months) and storage mode (freezer,
triacylglycerols, DAG: diacylglycerols, FFA: free fatty acids, ST: sterols, AMPL: acetone mobile polar lipids, PL: phospholipids) and total lipid content (TLC)
Duration Storage mode × Duration Storage mode Duration Storage mode × Duration Storage mode Duration Storage mode × Duration Storage mode Duration Storage mode × Duration ns ns _ _ _ *** ** ns ns ** * ns *** ** ns *** * ns *** ns * * *** ns ns *** *** ns *** *** *** *** *** *** ** ** *** ns ns *** ** ns * ** ns ns ** ns *** ** ** ns *** *** *** ns *** *** *** *** *** *** *** *** *** *** *** ns * **
Sardina pilchardus Sparus aurata (cultured) Octopus vulgaris Panulirus versicolor
9
storage mode (freezer, nitrogen, dry room) and their nd total lipid content (TLC) determined in seven
Storage mode × Duration Storage mode Duration Storage mode × Duration ns *** * ns ** *** ns ns ** *** *** ns ns ** ns ns ns ** *** ns ns ns ** * ns *** ** ns
Fig. 6. Distribution of four specific fatty acids (Stearic acid 18:0; Oleic acid 18:1n-9; Eicosapentaenoic PUFA=Polyunsaturated FA) in dry tissues of (A) lean species and (B) fat species, after three
points are outliers. * denotes difference from t0 at p<0.05 (see Table S2 for results on all FA).
9; Eicosapentaenoic acid (EPA) 20:5n-3; Docosahexaenoic (DHA) 22:6n-3) and FA families (SFA=Saturated FA; MUFA=Monounsaturated FA; after three-month storage in three modes (freezer, nitrogen, dry room). Reference (t0) is in black. The t
p<0.05 (see Table S2 for results on all FA).
10
(SFA=Saturated FA; MUFA=Monounsaturated FA; The thick bar represents the median value and the
11
4.2. How to store dry tissues?
No loss after one-month storage in -20°C-freezer was found for the different lipid classes. The other storage modes (dry room and nitrogen) were ineffective to prevent lipid class degradation. After a three-month storage, FA were more resistant to degradation than lipid classes in lean species such as L. sebae and P. versicolor, as little degradation was observed on their dry tissue in freezer. The freezer storage of dry tissue was however ineffective for the cultured S. aurata, probably because of its high lipid and FA contents sensitive to oxidation (> 200 µg.mg-1 dw). Sensitivity to oxidation varied with
FA in this species, e.g. 22:6n-3 losses were lower than for 18:1n-9 (the main FA with 24 µg.mg-1 dw). As for lipid classes, storage modes other than
freezer were not efficient to prevent FA oxidation.
Although they did not contain water, dry tissues were better preserved at low temperature (except for FA from S. aurata). Considering the two main pathways of lipid oxidation (i.e. enzyme initiated or reaction with oxygen [51]), this result suggested that lipase enzymes might remain active without water, or that lipid reaction with oxygen was slowed down at low temperature (through reduction of molecular excitation).
Lipid degradation also occurred before storage: Rudy et al. [22] found FA degradation for fat species holding on ice before frozen storage. Consequently, a careful attention should be given to tissue conservation from sampling to storage, especially for fat tissues. The best practices remained to collect samples on fresh individuals and to quickly cool them (ideally in liquid nitrogen) before a deep-frozen storage (-80°C) [22]. The removal of the outermost edge of sample before lipid extraction might also reduce the oxidation due to oxygen contact. When samples cannot be kept frozen, because of transport for example, they might be freeze-dried. If they are transported at ambient temperature, dry samples should be immersed into solvent directly on arrival: the total duration between the freeze-drying end and the solvent immersion should not exceed four days at +20°C [24]. If dry tissues can be transported at -20°C (e.g. few hours with ice packs inside an insulated box before being stored again in freezer), the total duration between the freeze-drying and the immersion should not exceed one month. FA profile express in percentage (qualitative) did not differ before/after the freezer storage of dry tissue, except for cultured S. aurata (Fig. 4b), suggesting a short-term storage (< three months) of dry tissue is suitable for trophic ecology or qualitative studies of FA in species with lipid content below 20% dw. FA profiles can be compared between wet frozen tissues and three-month dry frozen tissues.
4.3. Checking for lipid oxidation
DAG and FFA are commonly used as a degradation marker for lipid classes [52,14]. Here, except for FFA of M. edulis, the DAG and FFA contents did not increase during storage when TAG or PL contents decreased. Meyer et al. [24] obtained similar result on shark lean tissues. This suggests that TAG and PL oxidation did not only lead to DAG or FFA formation but to other compounds undetected here (e.g. malondialdehyde), and DAG and FFA oxidation markers might not be relevant for all marine species.
FA quantities tended to decrease after three-month storage in poor conditions (with gas nitrogen and in dry room) including the SFA which are little subjected to oxidation in comparison to PUFA [53]. SFA loss was also observed in poor condition storage of frozen fishes [22,24]. However, for species with total FA content > 20 µg.mg-1 (fat species and M. edulis in our
study), PUFA were oxidized faster than SFA in poor storage conditions of dry tissues. Consequently, the FA ratio 22:6n-3/16:0 could be used to assess the extent of FA degradation from a reference point as suggested by Young et al. [17] on swordfish preys. For instance, in our study, 22:6n-3/16:0 ratios lower than 1.0±0.1, 1.4±0.1, 0.8±0.1 and 1.5±0.1 indicated lipid oxidation for M. edulis, S. pilchardus, cultured S. aurata and T. thynnus, respectively.
Conclusions
Lipid compositions were not affected by freeze-drying but the extraction method did influence the results for lipid classes. The highest quantity of lipids extracted was obtained from the homogenates of wet tissues left into solvent mixture for 24 hours. Extractions with manual potter homogenizer led
to a lower but reproducible lipid content for most species (ca. 90% reproducibility) while extractions with ASE would require more protocol adjustments. Increasing the number of replicates might help to improve the repeatability of each protocol. Differences among the six protocols were however predictable, allowing to correct concentration results for comparisons among studies using different extraction protocols. One-month storage in freezer might be acceptable for dry tissue (no significant decrease in lipid quantities) whereas storage into a dry room or with gas nitrogen did not prevent lipid degradation. For qualitative studies of FA (in %), a three-month storage in the freezer did not alter the FA profile for species with total lipid <20% dw. The fast oxidation of some FA however requires caution for longer storage durations.
Acknowledgements
We are grateful to Margaux Mathieu-Resuge (LEMAR, Brest, France) for help in fatty acid determination and to Pierre-Yves Carval (Ecloserie du Tinduff, Plougastel, France) for assistance in mussel sampling. We thank our colleagues from Ifremer/REM/RDT and RBE, CNRS, UM and IRD who provided insight and expertise that greatly assisted the research. We warmly thank two anonymous reviewers for their suggestions that greatly improved the manuscript. This research was part of the MERLIN-POPSTAR project funded by Ifremer, France.
REFERENCES
[1] D.R. Tocher, Metabolism and functions of lipids and fatty acids in teleost fish, Rev. Fish. Sci. 11 (2003) 107–184. doi:10.1080/713610925. [2] B.T. Martin, R. Heintz, E.M. Danner, R.M. Nisbet, Integrating lipid storage into general representations of fish energetics, J. Anim. Ecol. 86 (2017) 812–825. doi:10.1111/1365-2656.12667.
[3] J. Dalsgaard, M.S. John, G. Kattner, D. Müller-Navarra, W. Hagen, Fatty acid trophic markers in the pelagic marine environment, Adv. Mar. Biol. 46 (2003) 225–340.
[4] J.M. Nielsen, E.L. Clare, B. Hayden, M.T. Brett, P. Kratina, Diet tracing in ecology: Method comparison and selection, Methods Ecol. Evol. 9 (2017) 278–291. doi:10.1111/2041-210X.12869.
[5] J.I. Erdal, Ø. Evensen, O.K. Kaurstad, A. Lillehaug, R. Solbakken, K. Thorud, Relationship between diet and immune response in Atlantic salmon (Salmo salar L.) after feeding various levels of ascorbic acid and omega-3 fatty acids, Aquaculture. 98 (1991) 363–379. doi:10.1016/0044-8486(91)90319-3.
[6] M.T. Arts, R.G. Ackman, B.J. Holub, “Essential fatty acids” in aquatic ecosystems: a crucial link between diet and human health and evolution, Can. J. Fish. Aquat. Sci. 58 (2001) 122–137. doi:10.1139/f00-224. [7] S.-I. Teshima, A. Kanazawa, Biosynthesis of sterols in the lobster, Panulirus japonica, the prawn, Penaeus japonicus, and the crab, Portunus trituberculatus, Comp. Biochem. Physiol. Part B Comp. Biochem. 38 (1971) 597–602. doi:10.1016/0305-0491(71)90314-2.
[8] S.M. Budge, A.M. Springer, S.J. Iverson, G. Sheffield, Fatty acid biomarkers reveal niche separation in an Arctic benthic food web, Mar. Ecol. Prog. Ser. 336 (2007) 305–309.
[9] J. Folch, M. Lees, G.H. Stanley, A simple method for the isolation and purification of total lipids from animal tissues, J. Biol. Chem. 226 (1957) 497–509.
[10] E.D. Dodds, M.R. McCoy, A. Geldenhuys, L.D. Rea, J.M. Kennish, Microscale recovery of total lipids from fish tissue by accelerated solvent extraction, J. Am. Oil Chem. Soc. 81 (2004) 835–840.
doi:10.1007/s11746-004-0988-2.
[11] M.A. Litzow, K.M. Bailey, F.G. Prahl, R. Heintz, Climate regime shifts and reorganization of fish communities: the essential fatty acid limitation hypothesis, Mar. Ecol. Prog. Ser. 315 (2006) 1–11. doi:10.3354/meps315001.
[12] M. Vagner, T. Lacoue-Labarthe, J.-L. Zambonino Infante, D. Mazurais, E. Dubillot, H. Le Delliou, P. Quazuguel, C. Lefrançois, Depletion of Essential Fatty Acids in the Food Source Affects Aerobic Capacities of the