HAL Id: hal-02908236
https://hal.inrae.fr/hal-02908236
Submitted on 28 Jul 2020
HAL is a multi-disciplinary open access
archive for the deposit and dissemination of
sci-entific research documents, whether they are
pub-lished or not. The documents may come from
teaching and research institutions in France or
abroad, or from public or private research centers.
L’archive ouverte pluridisciplinaire HAL, est
destinée au dépôt et à la diffusion de documents
scientifiques de niveau recherche, publiés ou non,
émanant des établissements d’enseignement et de
recherche français ou étrangers, des laboratoires
publics ou privés.
Distributed under a Creative Commons Attribution - NonCommercial| 4.0 International
License
in blue tit populations
Charles Perrier, Quentin Rougemont, Anne Charmantier
To cite this version:
Charles Perrier, Quentin Rougemont, Anne Charmantier. Demographic history and genomics of local
adaptation in blue tit populations. Evolutionary Applications, Blackwell, 2020, 13 (6), pp.1145 - 1165.
�10.1111/eva.13035�. �hal-02908236�
Evolutionary Applications. 2020;13:1145–1165. wileyonlinelibrary.com/journal/eva
|
1145 Received: 4 December 2019|
Revised: 11 May 2020|
Accepted: 18 May 2020DOI: 10.1111/eva.13035
S P E C I A L I S S U E O R I G I N A L A R T I C L E
Demographic history and genomics of local adaptation in blue
tit populations
Charles Perrier
1,2| Quentin Rougemont
3| Anne Charmantier
1This is an open access article under the terms of the Creative Commons Attribution License, which permits use, distribution and reproduction in any medium, provided the original work is properly cited.
© 2020 The Authors. Evolutionary Applications published by John Wiley & Sons Ltd 1Centre d’Ecologie Fonctionnelle et
Evolutive UMR 5175 , CNRS , Univ Montpellier, CNRS , EPHE , IRD , Univ Paul Valéry Montpellier 3, Montpellier, France 2Centre de Biologie pour la Gestion des Populations, UMR CBGP, INRAE, CIRAD, IRD, Montpellier SupAgro, Univ Montpellier, Montpellier, France
3Département de Biologie, Institut de Biologie Intégrative et des Systèmes (IBIS), Université Laval, Québec, Québec, Canada Correspondence
Centre de Biologie pour la Gestion des Populations|UMR CBGP, INRAE|CIRAD|IRD|Montpellier SupAgro|Univ Montpellier. Email: charles5perrier@icloud.com Funding information
European Research Council, Grant/Award Number: ERC-2013-StG-337365-SHE
Abstract
Understanding the genomic processes underlying local adaptation is a central aim of modern evolutionary biology. This task requires identifying footprints of local selection but also estimating spatio-temporal variations in population demography and variations in recombination rate and in diversity along the genome. Here, we investigated these parameters in blue tit populations inhabiting deciduous versus evergreen forests, and insular versus mainland areas, in the context of a previously described strong phenotypic differentiation. Neighboring population pairs of decidu-ous and evergreen habitats were weakly genetically differentiated (FST = 0.003 on average), nevertheless with a statistically significant effect of habitat type on the overall genetic structure. This low differentiation was consistent with the strong and long-lasting gene flow between populations inferred by demographic modeling. In turn, insular and mainland populations were moderately differentiated (FST = 0.08 on average), in line with the inference of moderate ancestral migration, followed by isolation since the end of the last glaciation. Effective population sizes were large, yet smaller on the island than on the mainland. Weak and nonparallel footprints of divergent selection between deciduous and evergreen populations were consistent with their high connectivity and the probable polygenic nature of local adaptation in these habitats. In turn, stronger footprints of divergent selection were identified between long isolated insular versus mainland birds and were more often found in re-gions of low recombination, as expected from theory. Lastly, we identified a genomic inversion on the mainland, spanning 2.8 Mb. These results provide insights into the demographic history and genetic architecture of local adaptation in blue tit popula-tions at multiple geographic scales.
K E Y W O R D S
1 | INTRODUCTION
Local adaptation in heterogeneous environments imposing diver-gent selection on counterparts of a same species has fascinated scientists for decades (Blanquart, Kaltz, Nuismer, & Gandon, 2013; Kawecki & Ebert, 2004). However, it is only with the recent advance in sequencing technologies that numerous recent empirical studies started discovering the genomic features and processes underlying local adaptation in heterogeneous environments (Hoban et al., 2016; Manel et al., 2016; Savolainen, Lascoux, & Merilä, 2013; Tiffin & Ross-Ibarra, 2014). Especially, many studies used so-called FST ge-nome scans between populations (Excoffier, Hofer, & Foll, 2009; Narum & Hess, 2011; de Villemereuil, Frichot, Bazin, François, & Gaggiotti, 2014) to detect genes under selection, and potentially im-plicated in local adaptations (Hohenlohe et al., 2010; Lamichhaney et al., 2016; Perrier, Ferchaud, Sirois, Thibault, & Bernatchez, 2017; Reid et al., 2016). Nonetheless, genome scans need improvements, for example, for studying polygenic variation (Rockman, 2012; Wellenreuther & Hansson, 2016). Genome scans also need to be in-terpreted in the light of recombination variation along the genome (Booker, Yeaman, & Whitlock, 2020; Stapley, Feulner, Johnston, Santure, & Smadja, 2017) since it shapes the potential extent of di-versity and of differentiation in the different regions of the genome (Burri et al., 2015; Cutter & Payseur, 2013; Rougemont et al., 2019; Tine et al., 2014). Genome scans results need to be interpreted in the light of the demographic history of populations since (a) spa-tio-temporal variation in gene flow and of effective population size affect the possibility of local adaptations (Lenormand, 2002) and the level of false positive due to genetic drift and (b) regions implicated
in reproductive isolation accumulated during allopatry showing in-creased differentiation upon secondary contacts (SC) can be mis-interpreted as genuine footprints of recent divergent selection (Bierne, Roze, & Welch, 2013; Bierne, Welch, Loire, Bonhomme, & David, 2011). Lastly, structural variants such as inversions also re-quire special attention, since they have the potential to protect adap-tive gene sets from recombination (Kirkpatrick, 2006, 2010; Stapley et al., 2017; Wellenreuther, Merot, Berdan, & Bernatchez, 2019) and hence enable their persistence and rapid redeployment in heteroge-neous environments despite high gene flow (Lowry & Willis, 2010; Sinclair-Waters et al., 2017; Todesco et al., 2019).
Here, we aimed at investigating various demographic and ge-nomic aspects of the adaptive divergence of a well-studied pas-serine bird, the Blue tit (Cyanistes caeruleus). Populations of small insectivorous passerines have long been used to study local adap-tation, in both quantitative genetics and population genetics frame-works (Broggi, Hohtola, Orell, & Nilsson, 2005; Carbonell, Perez-Tris, & Telleria, 2003; Laaksonen, Sirkiä, & Calhim, 2015). In particular, several blue tit populations breeding in heterogeneous habitats in Southern France (Figure 1a) offer an ideal context to study local ad-aptation. Four of them (two deciduous and two evergreen, circled in black in Figure 1a) have been subject to a long-term project spanning more than 40 years (Blondel et al., 2006; Charmantier, Doutrelant, Dubuc-Messier, Fargevieille, & Szulkin, 2016). These populations show marked quantitative phenotypic differences (Figure 1b,c), no-tably in morphological (e.g., tarsus length and body mass), life-his-tory (lay date and clutch size), and behavioral traits (e.g., song characteristics and handling aggression) (Charmantier et al., 2016). These phenotypic differences were found at two spatial scales. First,
F I G U R E 1 Map of the sampling locations of blue tit populations on the mainland and in Corsica (a) and phenotypic differences (b). In
red, habitats dominated by deciduous oaks and in green, habitats dominated by evergreen oaks. Sites with long-term monitoring are circled in black on the map (A1D corresponds to D-Rouvière in Charmantier et al. 2016, B3E to D-Pirio, B4D to D-Muro and B4E to E-Muro). On figures b & c are presented illustrative phenotypic differences (with standard deviations) between the four main populations with long-term monitoring. Are shown laying date (days), clutch size and male tarsus length (mm) (data from table 1 in Charmantier et al., 2016 Evol Appl, see this reference for detailed information for these measures and for differences in many other traits)
(a) (b)
birds breeding in deciduous forest habitats are taller, more aggres-sive, and lay larger and earlier broods than birds in evergreen forests (see table 1 in Charmantier et al., 2016). Strikingly, neighboring pop-ulations in deciduous and evergreen habitats are weakly genetically differentiated (Dubuc-Messier et al., 2018; Porlier, Garant, Perret, & Charmantier, 2012; Szulkin, Gagnaire, Bierne, & Charmantier, 2016) despite the short spatial scale, which questioned the mechanisms of persistence of the observed phenotypic differentiation against presumably large gene flow. Second, insular blue tits from Corsica, that might have been isolated since the sea level rise after the last glacial maximum (the sea level raised of 120 m from 17,000 to 5,000 years ago [Jouet et al., 2006; Lambeck & Bard, 2000]), are smaller and more colorful than their mainland counterparts (again, see table 1 in Charmantier et al., 2016) and are listed as a separate subspecies (Cyanistes caeruleus caeruleus on mainland Europe and
Cyanistes caeruleus ogliastrae mainly in Corsica and Sardinia). Overall,
traits displaying these strong phenotypic differences had heritabil-ities ranging from 0.20–0.43 (e.g., for lay date, [Caro et al., 2009]) to 0.42–0.60 (e.g., for tarsus length, [Delahaie et al., 2017; Perrier, Delahaie, & Charmantier, 2018; Teplitsky et al., 2014]), are classi-cally related with fitness, and hence could be involved in a local ad-aptation process. In particular, the heritability of lay date and the breeding time gap between populations could result in reproductive isolation by breeding time, limiting gene flow, and favoring local ad-aptation. The studied traits were typically quantitative (Charmantier et al., 2016), hence probably controlled by a polygenic architecture (Perrier et al., 2018) composed of many loci with small individual effects, as found in similar traits for other passerine birds (Bosse et al., 2017; Hansson et al., 2018; Lundregan et al., 2018; Santure et al., 2013). Overall, given their phenotypic, demographic, and genetic characteristics, these blue tit populations provide an ideal framework to study the genomic architecture of polygenic adapta-tion in heterogeneous environments.
We investigated genome-wide patterns of genetic diversity and differentiation and the demographic history between several pop-ulations of blue tits from Southern France, in heterogeneous forest habitats (deciduous vs. evergreen) and in insular (Corsica island) and mainland areas (Mainland France) in order to better understand the determinants of their local adaptation. The analysis was based on Resequencing of birds sampled in four sites studied in the context of a long-term project (Blondel et al., 2006; Charmantier et al., 2016) together with three additional pairs of deciduous and evergreen forests in order to test for parallel evolution (see Figure 1a). First, we investigated variation in genetic diversity and differentiation in order to verify that habitat type and geographic distance explained a significant proportion of the genetic structure between popula-tions (Szulkin et al., 2016). Second, we investigated the historical and contemporary demography of each deciduous and evergreen popu-lation pair in order to better understand the origin of their differen-tiation, and the demography between the populations on mainland France and on Corsica Island in order to estimate their split time and their subsequent connectivity and effective population size. Third, we screened the genome for FST outlier loci and inversions TA
B LE 1 St ud y p op ul at io ns ’ n am es , a bb re vi at io ns , h ab ita t t yp es , l oc at io ns , a pp rox im at e f or es t a re a ( ha ), a lti tu de ( m ), a nd s am pl e s iz es N ame A bb re via tio n Re gi on Si te Ty pe o f o ak s La tit ud e Lo ng itu de Fo re st ar ea A ltit ud e N -G en er al D at as et N -Fil te re d D at as et D -R ou vi ere A 1D M ain la nd Ro uv ier e D ec id uo us 43 .6 64 000 3. 66 8000 465 24 8 20 3 60 D -Q ui ss ac A 2D M ain la nd Q ui ss ac D ec id uo us 43 .8 910 36 3. 9969 31 23 10 4 35 27 E-Q ui ss ac A 2E M ain la nd Q ui ss ac Ev er gr een 43 .9 26 67 3 3. 98 9759 41 5 11 6 31 24 E-Pi rio B 3E C or si ca Pi rio Ev er gr een 42 .3 76 000 8. 75 0000 40 0 14 5 18 0 60 D -M uro B 4D C or si ca M uro D ec id uo us 42 .5 51 000 8. 92 3000 18 8 28 3 21 5 60 E-M uro B 4E C or si ca M uro Ev er gr een 42 .5 89 000 8. 96 7000 80 99 11 6 60 D -Z ili a B5 D C or si ca Zili a D ec id uo us 42 .52 36 85 8.8 73 68 9 13 10 2 42 38 E-Zili a B5 E C or si ca Zili a Ev er gr een 42 .5 2063 3 8.8 84 05 7 17 267 38 38 D -O lmi C ap pe lla B 6D C or si ca O lmi C ap pe lla D ec id uo us 42 .5 40 07 8 8. 993 915 20 1, 027 44 44 E-O lmi C ap pe lla B 6E C or si ca O lmi C ap pe lla Ev er gr een 42 .5 294 14 9. 02 16 52 25 881 43 43 Tot al/ av er age 947 45 4
potentially implicated in adaptation in the two habitat types and between Corsica and Mainland France. Rather than identifying the genes under selection, we wanted to test whether the adaptation had a polygenic or oligogenic architecture and whether outlier loci would be more frequent in regions with low recombination rate. We discuss our results in the light of the recent literature in population genomics, to decipher the role of genomic and demographic varia-tions on the genetic and phenotypic divergence between blue tits in deciduous versus evergreen habitats and in mainland versus insular contexts.
2 | METHODS
2.1 | Sites and sampling
Nine hundred forty seven blue tits (Cyanistes caeruleus) were cap-tured in 10 locations (Figure 1a, Table 1). Three locations are located in the South of mainland France (codes staring with “A”: A1D, A2D, A2E) and seven in Corsica (staring with “B”: B3E, B4D, B4E, B5D, B5E, B6D, B6E). The numbers from 1 to 6 indicated the sampling area and hence the population pairs. Half of these sites were domi-nated by the deciduous downy oak Quercus pubescens (indicated by “D” in the code), and the other half are dominated by the evergreen holm oak Q. ilex (indicated by “E”). Four of these locations (A1D, B3E, B4D, B4E) are monitored as part of a long-term research program started in 1976 and have been described in previous studies (Blondel et al., 2006; Charmantier et al., 2016). The six other sites (A2D, A2E, B5D, B5E, B6D, and B6E) were sampled in order to obtain further replicates of neighboring deciduous and evergreen populations. Capture and handling of the birds was conducted under permits provided by the Centre de Recherches sur la Biologie des Populations
d'Oiseaux (CRBPO) and by the Direction Départementale des Services Vétérinaires (DDSV). Birds were captured during the reproductive
period, from early April to late June, on their nesting territory. Birds were captured either in nest boxes during the feeding of their young (in the four sites studied on the long term) or using nets in the vicin-ity of their nest (in the other sites). Birds were banded with a unique metal ring provided by the CRBPO. Five to 20 μl of blood was sam-pled from a neck or a wing vein from breeding blue tits. Blood was stored at 4°C in Queen's buffer (Seutin, White, & Boag, 1991).
2.2 | Molecular biology and sequencing
DNA extractions were achieved using Qiagen DNeasy Blood & Tissue kits and were randomized across sites. DNA was quantified using first a NanoDrop ND8000 spectrophotometer and then a Qubit 2.0 fluorometer with the DNA HS assay kit (Life Technologies). DNA quality was examined on agarose gels. Library preparation using RAD-seq (restriction-site-associated DNA sequencing; (Baird et al., 2008)) with the enzyme SbfI was done by Montpellier GenomiX (MGX) platform (CNRS, Montpellier). Each individual was identified
using a unique six nucleotides tag, individuals were multiplexed in equimolar proportions by libraries of 36 individuals, and each library was sequenced on a lane of an Illumina HiSeq 2000. Single-end se-quencing was used to produce 100 bp reads. This design was used to obtain an average read depth of 50x. The DNA of three individuals was extracted twice and processed in different libraries to test for reliability of the genotyping process.
2.3 | Bioinformatics and data filtering
Raw sequences were inspected with FastQC (Andrews, 2010) for quality controls. Potential fragments of Illumina adapters were trimmed with Cutadapt (Martin 2011), allowing for a 10% mismatch in the adapter sequence. Reads were filtered for overall quality, demul-tiplexed, and trimmed to 85bp using process_radtags, from the Stacks
software pipeline 1.39 (Catchen, Hohenlohe, Bassham, Amores, &
Cresko, 2013), allowing for one mismatch in the barcode sequence. Sequencing RAD-tags resulted in a median value of 5,449,564 reads per individual. BWA-MEM 0.7.13 (Li & Durbin, 2009) was used to map individual sequences against the reference genome of the great tit
Parus major (Laine et al., 2016) and to produce sam files using
de-fault options. Indeed, although great tit and blue tit diverged about 7–14 Ma (Päckert et al., 2007), the use of a reference genome over a de-novo approach is very often highly recommended (see, e.g., Rochette & Catchen, 2017). It is also interesting to note that synteny is typically highly conserved in birds (Backström et al., 2008), sug-gesting that aligning reads on a divergent species would still allow analyses based on SNP position along the genome. On average, 93% of the raw reads were mapped against the genome (Table S1).
Samtools 0.1.19 (Li et al., 2009) was used to build and sort bam files.
We used pstacks to treat bam files, align the reads as assembled loci, and call SNPs in each locus. We used a minimum depth of coverage (m) of 5, the SNP model, and alpha = 0.05 (chi-square significance level required to call a heterozygote or homozygote). cstacks was used to build the catalog of loci, allowing three mismatches between sample loci when building the catalog. sstacks was used to match loci against the catalog. Lastly, populations program in Stacks was used to genotype individuals. In this program, relatively permissive filters were applied, to retain SNP genotyped in at least 50% of individu-als (all individuindividu-als from all sites grouped) and with a minimum read depth of 4. 350,941 SNP and 947 individuals were obtained in this “GeneralDataset.”
We hence applied additional filters to this GeneralDataset using the programs VCFtools (Danecek et al., 2011) and Plink (Purcell et al., 2007). We filtered for a minimum average read depth of 10 and a maximum average read depth of 100 (corresponding approx-imately to the 5%–95% distribution of read depth). SNP genotyped in <80% of the individuals were removed. We removed SNPs with observed heterozygosity ≥0.65 among individuals on Corsica or on mainland to reduce the potential occurrence of stacked paralogues. Individuals below 85% genotyping rate were removed. Identity-by-state (IBS) was estimated for three replicated individuals (from the
DNA extraction to SNP calling) in order to investigate reliability of the entire genotyping process. The IBS measured between replicates was high, ranging from 0.9989 to 0.9999, indicating very low geno-typing error rate. These replicates were then removed from the data-set. Using the R packages gdsfmt and SNPRelate (Zheng et al., 2012), we measured the realized genomic relatedness (GRM) between in-dividuals in order to remove highly related inin-dividuals (i.e., full-sibs and parent–offspring). For each pair of individuals with relatedness ≥0.35, we removed one individual. This procedure was applied in order to limit biases due to highly related individuals. Indeed, since we sampled breeding birds at their nests for the four sites studied on the long term and that they tend to disperse relatively close to their nests, we expected a higher percentage of related individuals than there actually is in the population. We then limited the number of individuals to 60, chosen at random, in populations (A1D, B3E, B4D, & B4E) in which a large number of individuals were genotyped. This limitation was achieved in order to limit differences in analyses precision between populations due to unequal sample sizes (all indi-viduals will be used in another ongoing study of the genomic archi-tecture of quantitative adaptive traits). We hence removed potential monomorphic SNPs and created the dataset “FilteredDataset.” 454 individuals (Table 1) and 144,773 SNPs were kept in this final data-set used for all the genomic analyses excepted analyses of demo-graphic history using ABC. The median genotyping rate across all SNPs for these individuals was 0.981. The median read depth across genotypes (SNPs × Individual) was 49.2x. The number of SNPs per chromosome ranged from 143 (LGE22) to 15,738 (chromosome 2). Further filtering (e.g., MAF) was often operated, depending on the analyses, and thereafter mentioned if it was the case. To perform analyses of demographic history using ABC analyses, we produced a haplotype VCF file for these 454 aforementioned individuals with the populations module of Stacks and we filtered it as explained in the Note S1.
2.4 | Analysis of genetic structure and effects of
environmental variables
We used PCAs with the function snpgdsPCA from snprelate to depict genetic structure between individuals. PCAs were run for the en-tire dataset, for mainland and Corsican populations separately and for each pairs of deciduous and evergreen populations. We inferred admixture proportions for each individual using Admixture 1.23 (Alexander, Novembre, & Lange, 2009) with K-values ranging from 1 to 12 and 1,000 bootstraps. The different clustering solutions were inferred by plotting cross-validations errors and by plotting indi-vidual admixture proportion. The effect of environmental variables, forest phenology (E vs. D), geographic distance (latitude and longi-tude), and altitude, on genomic differentiation, was measured using a redundancy analysis (RDA) (Forester, Jones, Joost, Landguth, & Lasky, 2015; Legendre & Fortin, 2010) as implemented in the R pack-age Vegan (Oksanen et al., 2007). We investigated the proportion of genetic variability explained by a constraining covariance matrix
consisting of phenology, latitude, longitude, and altitude for each in-dividual. We tested the global significance of the model using 1,000 permutations. We ran marginal effects permutations to address the significance of each variable. Then, we focused on the effect of phe-nology alone, using partial RDA to take into account the effect of lat-itude, longlat-itude, and altitude. Significance was tested running 1,000 permutations. For the PCA, the admixture analysis and the RDA, we selected from the FilteredDataset the SNPs with more than 95% genotyping rate, MAF >0.05, retaining one SNP per locus and we re-move SNP in linkage disequilibrium using the Plink command “indep 50 5 2.” Genome-wide differentiation between each sampling loca-tion was measured with Weir and Cockerham's FST estimator (Weir
& Cockerham, 1984) implemented in StAMPP (Pembleton, Cogan, & Forster, 2013). FST was estimated for all the SNPs, the ones on
the autosomes and the ones on the sex chromosome Z separately. Significance was assessed using 1,000 bootstraps replicates.
2.5 | Analysis of demographic history
Alternative models of divergence history including the effects of se-lection at linked sites affecting Ne and of differential introgression (m) were compared using an ABC framework modified from Roux et al. (2016). Linked selection either under the form of hitchhiking of neutral loci linked to a selective sweep (Maynard Haigh & Smith, 1974) or under the form of background selection (Charlesworth, Morgan, & Charlesworth, 1993) has strong effects in regions of low recombina-tion and have been shown to influence model choice and parameter estimates (Ewing & Jensen, 2016; Schrider, Shanku, & Kern, 2016). The same is true when populations accumulate reproductive incompat-ibilities during the divergence process: The resulting barrier to gene flow reduces the effective migration rate along the genome (Barton & Bengtsson, 1986) and not accounting for it can affect demographic model choice and parameter estimates (Roux, Tsagkogeorga, Bierne, & Galtier, 2013; Sousa, Carneiro, Ferrand, & Hey, 2013). Moreover, in-cluding selected loci in demographic inferences can reveal the deeper origins of population divergence (Bierne et al., 2013). Six scenarios were compared for the four pairs of deciduous and evergreen popula-tions in order to test whether the divergence between different habi-tats was not due to a divergence in different historical refugia but to a contemporary ecological divergence. We included a model of panmixia (PAN), a model of equilibrium corresponding to the island model with two populations (EQ), a model of isolation with migration (IM), a model of SC, a model of divergence with migration during the first genera-tions, that is, ancestral migration (AM), and a model of strict isolation (SI). The prior and details of the simulation pipeline are fully described in the Note S1. The PAN model assumes that the two focal populations descent from a single panmictic population characterized by its effec-tive size (Ne). The EQ model (equivalent to the island model) assumes that the population is subdivided into two discrete populations of sizes
Npop1 and Npop2 that are connected by continuous gene flow at a con-stant rate each generation. In this model, the divergence time is not a parameter. The IM, SI, SC, and AM models all assume that an ancestral
population of size NANC splits at Tsplit into two daughter populations of sizes Npop1 and Npop2. Under SI, no subsequent gene flow occurs.
Under AM model, gene flow occurs from Tsplit to Tam and is followed by a period without gene flow. Under IM, gene flow is continuous after
Tsplit. Under, the SC model, Tsplit is followed by a period of SI, after which
a SC starts Tsc generations. The EQ, IM, AM, and SC models included
migration as M = 4 N0.m, with M1←2 being the number of migrants from population 2 to population 1 and M2←1 being the reverse. The effect
of linked selection and barriers to gene flow were accounted for, by modeling heterogeneous population size (Ne) and heterogeneous mi-gration (m), respectively. Such heterogeneity was modeled using beta distributions as hyper-prior on each of these two parameters. These resulted in four alternative versions for models with gene flow EQ, AM, IM, and SC (NhomoMhomo, NhomoMhetero, NheteroMhomo, and NheteroMhetero) and two versions for PAN and SI (Nhomo and Nhetero). We used a modified ABC (Csilléry, Blum, Gaggiotti, & François, 2010) pipeline from Rougemont and Bernatchez (2018) to perform model selectionand to estimate posterior probabilities of parameters.
We also investigated the historical demography of the popula-tions from Corsica as compared to the ones from the mainland. Gene flow has probably been impossible since the last deglaciation and sea level rise. Therefore, we compared models of ancient migration (AM) and SI. The pipeline described in the above section, integrating linked selection and barriers to gene flow, was run between the A1D samples (chosen on the mainland because it had the largest sample size) and B4D (chosen in Corsica because it had both a large sam-ple size and was from the same habitat as A1D). We used the same ABC pipeline for the model selection procedure and parameter es-timation as described in the above section. Finally, we attempted to convert demographic parameter into biological units assuming a mutation rate of 1e-8 mutations/bp/generations.
2.6 | Genomic diversity
Genome-wide genetic diversity was inferred for each sampling loca-tion in the dataset by measuring observed heterozygosity (Ho), pro-portion of polymorphic loci, and MAF spectrums. For each population and chromosome, and subsequently on average for the entire ge-nome, linkage disequilibrium (LD) decay was measured with Plink and smoothed in R. To contrast with long-term Ne estimates from coales-cent simulation in our ABC modeling (see “Analysis of demographic history”), we also inferred recent Ne for each population using SNeP V1.1 (Barbato, Orozco-terWengel, Tapio, & Bruford, 2015), which uses LD data, with a MAF ≥0.05 filter per population. We investigated the nature of SNP variation, that is, synonymous or nonsynonymous, blast-ing all RAD sequences on the reference genome and the transcriptome of the great tit (ftp://ftp.ncbi.nih.gov/genom es/Parus_major/; Santure, Gratten, Mossman, Sheldon, & Slate, 2011) using blastx (McGinnis & Madden, 2004). We kept hits with at least 90% similarity and a mini-mum amino acid sequence length alignment of 25. We kept only SNPs for which both the alternative and reference allele yields the same
score. Finally, we tested for differences in the distribution of run of homozygosity (ROH) between the mainland and Corsica that may have resulted from smaller Ne and larger inbreeding in Corsica versus the mainland. We used plink 1.9 to estimate the length and number of ROH. We required a window of 500 kb to be homozyguous in order to be considered as a ROH, and with a maximum of 100 SNP.
2.7 | Identification of genomic
footprints of selection
We used three methods to search for outlier SNPs potentially under divergent selection between blue tit populations. First, we used
Bayescan V2.1 (Foll & Gaggiotti, 2008) to search for SNPs
poten-tially under divergent selection at two geographic levels: (a) between the mainland and Corsican populations and (b) between each local pairs of evergreen (E) and deciduous (D) populations, that is, A2D versus A2E, B4D versus B4E, B5D versus B5E, B6D versus B6E. We filtered each of the five datasets for a minimum MAF of 0.05. We used default parameters except for prior odds that were set at 10,000 in order to limit false positives. We investigated the paral-lelism across pairs of D–E environments. Second, we estimated FST
along the genome using either a 200 kb sliding average with VCFtools or the function “snpgdsSlidingWindow” from the package SNPrelate to estimate FST in blocks of 50 SNPs moving by 5 SNPs. The sec-ond window strategy was used in order to compensate for lower SNP density in regions of low recombination that tend to exaggerate the contribution of individual SNPs in these regions and to dilute the individual SNP contribution in regions of high recombination (see Perrier & Charmantier, 2019 for a broader comment on this). Third, we used an RDA as an alternative method to search for SNPs putatively implicated in multilocus adaptation (a) between popula-tions in deciduous and evergreen habitats, and (b) between popu-lations in Corsica and on the mainland. As suggested by Forester, Lasky, Wagner, and Urban (2018), such a multivariate method may be more suitable than univariate ones to detect weaker footprints of adaptation that are expected in polygenic adaptations in response to complex environmental heterogeneity. Using a similar procedure as described earlier in the methods, we used two RDAs constrained to investigate the effect of phenology (a) or of the geography (b). We then used a three standard deviation cutoff as suggested by Forester et al. (2018) to list loci with outlier loading scores on the first RDA axes. We compared the loci found using these different methods. We reported in which genes these outliers were found (the list of genes can be found together with the genome published by Laine et al., 2016 on NCBI).
2.8 | Variation of genomic differentiation with
recombination rate
We investigated variation of FST with local recombination rate and
recombination than elsewhere in the genome. We estimated local recombination rates using a coalescent method implemented in
Ldhat (McVean, 2004) using linkage disequilibrium signal. Following
these authors’ recommendation, the dataset was split in blocks of 2,000 SNPs with 500 overlapping SNPs. A MAF of 0.05 and a maxi-mum of 5% of missing data were allowed. The local recombination rate, ρ = 4Ne r, was then estimated in each block independently with the Bayesian reversible jump MCMC scheme implemented in inter-val. We used a block penalty of 5, with 30 million MCMC iterations sampled every 5,000 iterations. The first 250,000 iterations were discarded. To speed up computations, we used the precomputed two locus likelihood table for n = 190 and assuming theta = 0.001. We estimated ρ in a composite dataset with individuals from every population, habitats, and sex. We tested for correlations between SNP FST and recombination rate using linear models, for Corsica– mainland and for deciduous–evergreen differentiation, indepen-dently, and we represented the correlation using a LOESS fit. We tested whether outliers found using Bayescan and the RDA method for both Corsica–mainland and deciduous–evergreen differentiation were more often found in regions of low recombination than else-where in the genome using chi-square (χ2) tests, and we represented
the pattern using histograms.
2.9 | Detection of genomic inversions
We searched for potential genomic inversions using a variety of de-scriptive statistics. First, we searched for genomic regions having a particularly low recombination rate and large long-distance link-age disequilibrium, nevertheless associated with a high density of SNPs and therefore unlikely to correspond to peri-centromeric re-gions but rather to local suppression of recombination that may be due to inversions. Second, we implemented a PCA sliding window analysis in order to identify portions of the genome with individuals carrying an inversion at the homozygous or heterozygous state or individuals exempt from the inversion (Ma & Amos, 2012). We first used 10Mb windows sliding by 1 Mb and then 1 Mb windows sliding by 100 kb, in order to use enough SNPs to perform PCAs. We then used Lostruct (Li & Ralph, 2019), with k = 2, sliding by 100 SNPs, to identify particular blocks of linked SNPs explaining an abnormally high proportion of variance between two groups of individuals (e.g., inverted and noninverted).
We detected one putative inversion. We verified, using admix-ture with K = 2 for analyzing SNPs from the inversion, that putative heterozygous individuals had an admixture ratio close to 1:1 of both putative inverted and noninverted homozygous clusters. We then inspected variations of FST (per SNP) and π (per 10kb window, using
vcftools) along the genome between individuals that were inverted
homozygous, noninverted homozygous, and heterozygous for the inversion, looking for potentially reduced diversity and increased differentiation at the inversion. We looked for potential salient variations in read depth in and around the putative inversion. We also tested whether the detected inversion was at Hardy–Weinberg
equilibrium (using a common χ2 test) and whether the frequency of
the inversion varied geographically and between evergreen and de-ciduous habitats.
To study the history of the putative inversion identified, we aimed at measuring intra- and interspecific genetic distance and ab-solute divergence, at the inversion and for the entire genome, for several blue tits and great tits. To do that, we first generated a new SNP dataset by running stacks with the same pipeline and param-eters as explained earlier, with two mainland great tits, two insu-lar great tits, four mainland blue tits homozygous for the inversion, four mainland blue tits not carrying the inversion, and four Corsican blue tits not carrying the inversion (the inversion was not found in Corsica). Second, we selected the SNPs from the region of the in-version. Third, Da was measured between the five aforementioned groups of individuals using PopGenome (Pfeifer, Wittelsbürger, Ramos-Onsins, & Lercher, 2014). Using this measure of Da, we esti-mated approximately the inversion apparition time using T = Da/2µ (Hudson, Kreitma, Aguadé, 1987), assuming a standard mutation rate of 1e-8 and with the simplifying assumption of no gene flow and no introgression. Lastly, we represented the divergence between these individuals using an UPGMA tree of bitwise distance using the R package poppr 1.1.1 (Kamvar, Tabima, & Grünwald, 2014).
2.10 | Gene ontology
We used the R package topGO (Alexa & Rahnenführer, 2009) to in-vestigate the potential gene ontologies (GO) that were statistically enriched for the sets of genes identified among outliers and the in-version, compared to the entire list of genes in which all the SNPs from the entire dataset were found. For the outlier tests, we used GO analyses for each gene list obtained using the different outlier identification methods but also for aggregated lists of all of the gene identified for deciduous–evergreen tests or for Corsica–mainland tests. We used the GO referenced for the zebra finch, T. Guttata (tguttata_gene_ensembl). We report a Fisher enrichment test p-value and a p-p-value after applying a Benjamini and Hochberg correc-tion for multiple testing to control for false discovery rate.
3 | RESULTS
3.1 | Genetic structure and effects of environmental
variables
The admixture analysis suggested the existence of two main distinct genetic groups corresponding to mainland and island populations (Figure 2a). Increasing K values contributed to delineate the popula-tions, showing the existence of a weak structure between the six main sampling areas. However, the coefficient of variation increased with K. There was very little evidence for genetic structure within each of the four pairs of D- and E- populations. PCAs revealed a clear structure between individuals from the mainland and the island
but little structure within each of these two groups (Figure S1). The full RDA model was significant (p < .001, Table S2, Figure 2b), as well as the effects of each variable tested in the model: phenology (i.e., E vs. D, p = .006), latitude (p < .001), longitude (p < .001), and altitude (p < .001). The first axis of the global RDA explained 4.54% of the variance and was correlated mainly with latitude (−0.987) and longitude (+0.999). The fourth axis of this global RDA displayed the strongest correlation with phenology (−0.856) and explained 0.27% of the variance. The partial RDA model conditioning for the effects of latitude, longitude, and altitude was globally significant (p < .001), as well as the effect of phenology (p < .001). The axis of the partial RDA explained 0.29% of the variance and was correlated with phe-nology (0.922).
All pairwise FST comparisons were significantly different from
zero (Table 2). Average FST calculated between island and mainland populations was 0.081. It was on average 0.003 between close pop-ulations within the mainland and 0.005 within the island. FST was low, on average 0.003, for each of the four pairs of D- and E- populations, ranging from 0.0006 between B6D and B6E to 0.0079 between B4D and B4E. The FST estimated on the Z chromosome was on average
1.52 times higher than on the autosomes; 1.62 times higher when comparing populations from the mainland versus Corsica , and 1.44 times higher when comparing neighboring populations in the island or in the mainland.
3.2 | Demographic history
When deciphering the historical demography of deciduous and ev-ergreen population pairs, the hierarchical model choice procedure strongly rejected models of SI, ancient migration, and of PAN, which were associated with a posterior probability of 0 (Table S3). Instead, models with gene flow were highly supported. In three of the four
pairs, the equilibrium model (EQ) received the highest posterior probability with P(EQ) = 0.99 and 0.95, 0,94 in the B6D versus B6E, B5D versus B5E and B4D versus B4E comparisons, respectively. In the A2D versus A2E comparisons, the best supported model was the isolation with migration model, P(IM) = 0.74 with the second best model being SC, with P(SC) = 0.23. Comparing the two models against each other while excluding all remaining models yield un-ambiguous support for IM, with P(IM) = 0.99 (Table S3). Across all models, comparisons with heterogeneous gene flow and heteroge-neous effective population size were not supported, indicating that, if genetic barriers or linked selection were at play they could not be detected. Demographic parameters were estimated for each pair of populations under the best model (Table S4). Posterior distributions were well differentiated from their prior indicating that estimated parameters were confidently estimated (Figure S2). Effective popu-lation size (Ne) was slightly higher in deciduous than in evergreen
habitats (Ne-ABC in Table 2, Figure 3a, Table S4) and tended to be higher on the mainland than on the island. In a number of com-parisons, our migration estimates reached the prior upper bounds. Therefore, we ran a new set of simulations with wider priors (Note S1). Migration rates were not different between deciduous and ev-ergreen habitats: In two instances, the rate of migration was higher from the deciduous to the evergreen, and in two other instances, the reverse was true (Figure S3).
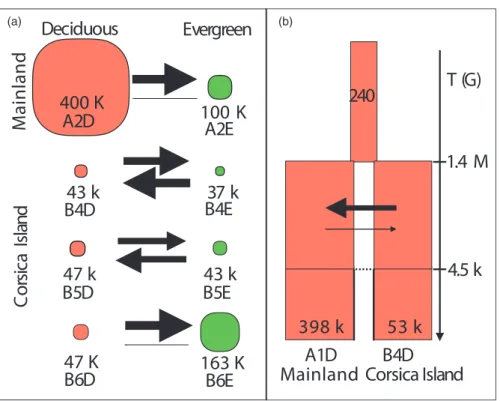
Deciphering the historical demography between Corsica and the mainland, the ancient migration models (AM) strongly outperformed the SI models, with p(AM) = 0.99 (Table S5). For the AM model, the simplest model without linked selection or barriers to gene flow was the best supported, with p = .76. Parameters estimates revealed posterior generally well differentiated from the prior providing in-creased confidence (Figure S4). Effective population size of the main-land was 397,685 [CI = 244,375–600,105], around 7.5 times greater than the one of the island, 52,990 [CI = 33,065–78,475] (Figure 3b,
F I G U R E 2 Population structure
between populations. (a) Admixture for
K = 2, 6 and 10 (Vertical lines correspond
to individual admixture; colors correspond to distinct genetic groups). (b) RDA showing the influence of latitude, longitude, altitude, and phenology on genetic structure
A2D A2E
A1D B3E B4D B4E B5D B5E B6D B6E
K = 2 K = 6 K = 10 CV = 0.302 CV = 0.307 CV = 0.314 (a) Admixture (b) RDA −2 −1 0 1 2 3 −2 −1 012 LATITUDE PHENOLOGY LONGITUDE ALTITUDE A1D A2D A2E B3E B4D B4E B5D B5E B6D B6E Mainland Corsica −2 −1 0 1 2 −2 −1 012 PHENOLOGY ALTITUDE RDA1 RDA2 RDA3 RDA4
Ne-ABC in Table 2, Table S6). Our analysis also indicated a strong population size change during the process of population isolation, since the ancestral Ne was estimated at only 240 [CI = 65–685]. Split time was estimated at 1,417,480 [CI = 740,000–2,394,000] gener-ations ago, hence around 3.2 Ma (assuming a 2.3 years generation time [Charmantier, Kruuk, Blondel, & Lambrechts, 2004]) and gene flow subsequently stopped 4,540 [CI = 2,500–6360] generations ago, hence around 10,000 years ago, corresponding closely with the end of the last glacial maximum. The AM rate between Corsica and the mainland, from the split in two populations to the end of the lat-est gene flow between these populations, was inferred asymmetric, with a five times larger migration rate from the island to the main-land (m ~ 1.9e-4) than the other way around (m ~ 3.8e-5). However, this asymmetry did not generate a strong difference in gene flow between the two groups, given the lower effective population size on the island compared to the mainland, (i.e., respective number of migrants of 10 and 15 from Corsica to the mainland and in the reverse direction, with overlapping credible intervals, see details in Table S6).
3.3 | Genetic diversity
The mainland populations displayed significantly higher patterns of observed heterozygosity (on average 0.169, Table 2) than Island popu-lations (on average 0.147), all t tests’ p-values <.001. On the contrary, there was no significant difference of observed heterozygosity at smaller spatial scale among populations within the island (either same or different tree phenology, E- and D-) or within the mainland (all t tests’ p-value >.05). More SNPs were polymorphic in mainland lations (77,306–80,616 SNPs for a MAF > 0.05) than in island popu-lations (62,728–65,876 SNPs for a MAF > 0.05). The MAF spectrum showed enrichment of variants with smaller frequencies in mainland populations versus island populations (Figure S5a). LD decayed rapidly in the first 5kb and was lower in populations from the mainland (espe-cially A1D) compared to island populations (Figure S5b). This pattern of rapid LD decay was similar between chromosomes (see, e.g., chromo-somes 1, 2, and Z, Figure S6). Contemporary Ne inferred from LD varied
from 142 (in A2E) to 355 (in A1D) (Ne-LD in Table 2, Figure S5c). Ne val-ues were rather similar within pairs of E- and D- populations, although Ne was on average smaller in evergreen populations (245 on average) than in deciduous ones (261 on average). The four largest Ne (with an
average of 318) were found for the four populations monitored on the long term in forest in which hundreds of artificial nest boxes have been installed for several decades (the Ne in the 6 other populations was on average of 210). In the entire dataset, 2,599 SNPs were identified as nonsynonymous while 6,751 SNPs were identified as synonymous. We observed 1.18 times lower allele frequencies for nonsynonymous variants (average MAF = 0.09) than for synonymous ones (average MAF = 0.11) (t test p-value < .000001). This overall lower frequency of nonsynonymous compared to synonymous mutations was similar between populations from Corsica (1.19) and the mainland (1.16), as well as between deciduous (1.18) and evergreen (1.19) habitats (see
T A B LE 2 D iv er si ty a nd d iff er en tia tio n a cr os s p op ul at io ns . F ix at io n i nd ex b et w ee n p op ul at io ns ( FST ), e ff ec tiv e p op ul at io n s iz e ( N e) e st im at ed w ith A B C ( N e-A B C ) u si ng m od el s fo r d ec id uo us –e ve rg re en p op ul at io n p ai rs o r f or C or si ca –m ai nl an d ( A 1D -B 4D ), N e e st im at ed w ith a L D m et ho d ( N e-LD ), a nd o bs er ve d h et er oz yg os ity ( H o) . C ol or g ra di en ts i nd ic at e di ff er en tia tio n i nt en si ty ( D ar ke r r ed f or h ig he r d iff er en tia tio n a nd d ar ke r b lu e f or l ow es t d iff er en tia tio n) . U nd er lin ed v al ue s i nd ic at e d ec id uo us a nd e ve rg re en p ai rs FST N e-A B C N e-LD H o A 1D A 2D A 2E B3 E B 4D B 4E B5 D B5 E B 6D B 6E D ec id uou s– Ev er gre en C or si ca– M ain la nd A 1D 0.0 04 5 0.0 04 3 0.0 81 2 0.0 83 0 0.0 85 3 0.0 79 6 0.0 80 4 0.0 78 5 0.0 78 4 N a 39 7,68 5 355 0. 17 1 A 2D 0.0 04 5 0.0 02 9 0.0 83 2 0.0 84 9 0.0 87 2 0.0 79 9 0.0 81 0 0.0 79 3 0.0 79 2 400 ,00 5 na 161 0. 167 A 2E 0.0 04 3 0.0 02 9 0. 082 8 0.0 84 6 0.0 87 1 0.0 79 6 0.0 80 7 0.0 79 0 0.0 78 7 10 0, 05 5 na 14 2 0.1 68 B 3E 0.0 81 2 0.0 83 2 0. 082 8 0.0 05 8 0.0 08 9 0.0 06 7 0.0 07 1 0.0 05 6 0.0 05 8 N a N a 33 4 0. 14 9 B 4D 0.0 83 0 0.0 84 9 0.0 84 6 0.0 05 8 0.0 07 9 0.0 06 3 0.0 06 7 0.0 06 1 0.0 06 2 43 ,07 0 52 ,9 90 310 0. 14 9 B 4E 0.0 85 3 0.0 87 2 0.0 87 1 0.0 08 9 0.0 07 9 0.0 09 3 0.0 09 7 0.0 08 3 0.0 08 5 37, 10 0 na 271 0. 14 8 B5 D 0.0 79 6 0.0 79 9 0.0 79 6 0.0 06 7 0.0 06 3 0.0 09 3 0.0 02 5 0.0 03 5 0.0 03 2 46 ,52 0 na 210 0. 14 5 B5 E 0.0 80 4 0.0 81 0 0.0 80 7 0.0 07 1 0.0 06 7 0.0 09 7 0.0 02 5 0.0 03 6 0.0 03 3 42 ,8 00 na 216 0. 14 6 B 6D 0.0 78 5 0.0 79 3 0.0 79 0 0.0 05 6 0.0 06 1 0.0 08 3 0.0 03 5 0.0 03 5 0.0 00 6 46, 88 5 na 26 8 0. 14 6 B 6E 0.0 78 4 0.0 79 2 0.0 78 7 0.0 05 8 0.0 06 2 0.0 08 5 0.0 03 2 0.0 03 3 0.0 00 6 16 2,9 40 na 26 0 0. 14 6
Table S7). The Z chromosome harbored a proportion of nonsynony-mous mutations 1.83 times higher than the average for the autosomes. Finally, we observed significantly slightly longer ROH on Corsica com-pared to mainland (meanisland = 44,769 kb vs. meanmainland = 41,586 kb,
Wilcoxon rank sum test W = 32,695, p < 2e-16, Figures S7&S8). We also observed significant differences in the count of ROH among populations from the mainland versus those from the island but not among populations within the mainland or the island (ANOVA p < 2e-16; Table S8 for Tukey HSD test).
3.4 | Footprints of selection
Manhattan plots of FST per SNP revealed no clear evidence for high
peaks of FST for the five comparisons considered (First panels of Figures 4 & 5). Throughout the five Bayescan tests (Corsica vs. main-land populations and the 4 D-4 population pairs), we identified 40 SNPs with a log10(BF)> 0 among which 18 SNPs had a log10(BF)> 1 (Table S9, Figure S9). None of these SNPs were detected twice among the different tests conducted with Bayescan. Among these 40 SNPs, 27 were found for the Corsica versus mainland test, 2 were found for A2D versus A2E, 9 were found for B4D versus B4E, 0 were found for B5 versus B5E, and 2 were found for B6D versus B6E. Among these 40 SNPs, 19 genes were identified (Table S9). Sliding windows of FST
along the genome showed a few outlier windows of modest intensities (last panels of Figures 4 & 5), with almost no parallelism between the tests (Table S10). Expectedly, outlier windows found for the Corsica versus mainland comparison depicted larger FST than for deciduous
versus evergreen comparisons. The outlier FST windows falling in the top 1% of the FST windows distribution are reported in Table S10. Using
the RDA to identify outlier SNPs with extreme loading values to axes,
we identified 229 outlier SNPs associated with habitat type (decidu-ous vs. evergreen) and 227 SNPs associated with geography (longitude and latitude, essentially representing a Corsica–mainland comparison) (Table S11, Figure S10). For the deciduous versus evergreen test, only one of the RDA outliers was also found outlier in Bayescan tests. For the Corsica–mainland test, eight of the RDA outliers were also found outliers in the Bayescan test. Genes in which the outliers were found are reported in the Table S13.
3.5 | Variation of genomic differentiation with
recombination rate
FST between mainland and Corsican populations was negatively
cor-related to recombination rate (Figure 6a, linear model p < 2e-16; Figure S11). In contrast, FST between each pair of deciduous and
ev-ergreen populations was not correlated to recombination rate. FST outlier SNPs between Corsica and the mainland populations and identified by Bayescan or by the RDA were more often found in re-gions of low recombination (χ2 test p-values <.01, Figure 6c) than
observed for the entire SNPs (Figure 6b). Average recombination rate was on average twice lower for these FST outlier SNPs
com-pared to the rest of the SNPs (t test p-values < 1e-6). In contrast, FST
outlier SNPs between deciduous and evergreen populations were not preferentially found in regions of low recombination (Figure 6d).
3.6 | Genomic inversions
We detected one putative inversion on chromosome 3, spanning 2.8 Mb, from position 11,838,789 to 14,661,550, and containing
F I G U R E 3 Demographic parameters
(a) for each of the four pairs of blue tit populations in deciduous and evergreen habitats, estimated using EQ, and (b) for the divergence between populations on the mainland and Corsica, estimated using an ancient migration model. In panel a, circle size is proportional to effective population size (Ne) and arrow width is proportional to migration rate. In panel b, rectangle width is proportional to log10 (effective population size), arrow width is proportional to migration rate, and split time and time of ancient migration are indicated in number of generations
390 SNPs. The estimated recombination rate was on average nine times lower (t test: p < 2.2e-16) in this region of the chromosome compared to the rest of the chromosome (Figure 7a). However, the SNP density did not appear reduced at the location of this putative inversion (Figure 7a), suggesting a recent drop of recombination (i.e., dissimilar to what is expected in a peri-centromeric location). We did not find evidence for an increase of read depth at specific loci in the putative inversion or its vicinity in inverted individuals compared to normal ones. We did however notice the absence (read depth = 0) of three loci from the inversion, in the four inverted individuals. The sliding PCA detected either two groups (individuals from Corsica and from mainland) outside of the putative inversion, or four groups at
the putative inversion location, separating individuals from Corsica and three groups for mainland individuals (Figure 7b). We assumed that the inverted segment was the one with the lower frequency on the mainland and that was absent from Corsica. The Lostruct analy-sis confirmed for this same region the presence of four successive blocks of 100 SNPs highly discriminating individuals (Figure 7c). The average FST between the three groups of mainland individuals was
much higher (t test: p < 2.2e-16, Figure 7d) for SNPs in the putative inversion (FST = 0.26) than for SNPs outside of this region (FST =
5.8e-4). π was lower (t test: p = 1.9e-5, Figure 7e) for SNPs located in the putative inversion for inverted homozygous individuals (π = 2.5e-5) compared to noninverted homozygous individuals (π = 5.3e-5). Both
F I G U R E 4 FST Manhattan plots between the four population pairs in deciduous and evergreen forests. FST are given either by SNP
(four first graphs), by 200 kb windows (graphs 5 & 6), or by 50 SNPs windows (graphs 7 & 8). For graphical simplicity, the three pairs of populations in Corsica were grouped for the sliding window FST Manhattan plots (BD vs. BE). Dots alternate colors between chromosomes. FST for unplaced loci are shown at the end of each of the first four Manhattan plots
0.0 0.2 0.0 0.2 0.0 0.2 0.0 0.2 A2D vs A2E B4D vs B4E B5D vs B5E B6D vs B6E FST 1 1A 2 3 4 4B 5 6 7 8 9 10 12 1417 20 Z per SNP per SNP per SNP per SNP 0. 00 .0 4 A2D vs A2 E per 50 SNPs 0. 0 0.01 BD vs BE per 50 SNPs 0. 0 0.15 A2D vs A2 E per 200k b BD vs BE per 200k b 0. 0 0.04
inverted and noninverted homozygous individuals had lower π at this inversion compared to heterozygous individuals at this region (π = 7.6e-5) and compared to the three types of individuals for the rest of the chromosome 3 (π ranging from 7.4e-5 to 7.6e-5). The PCA (Figure 7f) and the admixture analysis (Figure 7g) using the SNPs from the inversion clearly delineated inverted, noninverted, and heterozygous individuals, with heterozygous individuals falling at in-termediate eigenvalue between the two categories of homozygous individuals. LD was higher (Figure 7h) for the region of the putative inversion (little LD was found when only homozygous noninverted individuals were kept in the analysis). For the region of the inver-sion, Da was 0.0020 between normal blue tits from the mainland and from Corsica as well as between great tits from the mainland and from Corsica. Da was 0.0044 between inverted and normal blue tits from either the mainland or from Corsica, and ranged from 0.0149 to 0.0152 for interspecific comparisons. Using the formula T = Da/2µ, the inversion likely appeared approximately 220,000 generations ago (around 506,000 years ago). The tree of genetic distance illus-trated the divergence of inverted blue tits from noninverted blue tits from both mainland and Corsica (Figure 7i). This region contains 21 genes listed in Table S12. Out of 113 individuals from the mainland, we found 4 inverted homozygous, 23 heterozygous, and 86 nonin-verted homozygous, and hence, we observed no deviation from the Hardy–Weinberg equilibrium (χ2 test p-value > .1). The percentage
of each genotype was similar across all mainland locations and both habitat types (the inverted segment was at 11% in A1D, 16% in A2D, 17% in A2E, and 14% across these three locations).
3.7 | Gene ontology
None of the gene lists gathered with the different tests (each out-lier test among deciduous and evergreen environment and between Corsica and the mainland and the inversion test) yielded any sig-nificantly enriched GO term after correction multiple testing (Table
S14). The most promising GO (uncorrected p-value <.0025) in-cluded the following: (a) for the deciduous–evergreen outlier tests, GO:0060385, axonogenesis involved in innervation; GO:2001013, epithelial cell proliferation; GO:0007194, negative regulation of ade-nylate cyclase; GO:0090647, modulation of age-related behavioral; GO:1901379, regulation of potassium ion transmembrane transport, (b) for the Corsica–mainland outlier tests, GO:0008344, adult loco-motory behavior; GO:2001224, positive regulation of neuron migra-tion, (c) for the inversion, GO:0016446, somatic hypermutation of immunoglobulin; GO:0045910, negative regulation of DNA recom-bination; GO:0006298, mismatch repair; GO:0008340, determina-tion of adult lifespan.
4 | DISCUSSION
In this study, we investigated demographic history and genome-wide patterns of genetic diversity and differentiation between several populations of blue tits presenting strong phenotypic dif-ferences between deciduous versus evergreen forest habitats as well as insular versus mainland contexts. Between populations in deciduous and evergreen forest habitats, demographic modeling showed large gene flow and large effective population sizes (Ne), explaining the low genetic differentiation between these popu-lations. Demographic modeling also revealed that each pair of deciduous and evergreen populations most likely never diverged and maintained high connectivity through migration. We identi-fied slight and mostly unrepeated footprints of divergent selection across these evergreen and deciduous population pairs, which is consistent with their demography and the likely polygenic nature of several traits implicated in their local adaptation. In both insu-lar and mainland populations, we found insu-large Ne, although smaller for insular populations than mainland ones, resulting in different distributions and lengths of ROH. Gene flow between Corsica and the mainland most likely stopped at the end of the last glaciation.
F I G U R E 5 FST Manhattan plots between Corsica and the mainland. FST are given either by SNP, by 200kb windows or by 50 SNPs windows. Dots alternate colors between chromosomes. FST for unplaced loci are shown at the end of the first Manhattan plot
1 1A 2 3 4 4B 5 6 7 8 9 10 12 1417 20 Z 0. 4 0. 0 0. 2
Corsica vs mainland per 200Kb
per 50 SNPs FST 0.0 0.4 0.8 per SNP 0.3 0.0 0.15
Both large Ne and gene flow until the end of the last glaciation hence explained moderate genome-wide differentiation. We iden-tified several genomic footprints of selection, enriched in regions of low recombination only in the case of the mainland/island di-vergence. Finally, we identified a putative genomic inversion spanning 2.8 Mb, polymorphic in mainland populations only. We discuss these results in the context of the vast scientific knowl-edge acquired on these blue tit populations during the last four decades, and more generally in the context of genomics of adapta-tion with gene flow.
4.1 | Divergence between populations in deciduous
versus evergreen habitats
Although we found a significant effect of habitat on genetic struc-ture, the genetic differentiation between neighboring deciduous and evergreen populations was low (FST ranging from 0.0006 to
0.0079). This result is in line with the primary observations real-ized earlier on a smaller set of populations (Porlier, Garant, et al., 2012; Szulkin et al., 2016). Accordingly, we found high gene flow from deciduous to evergreen populations. Yet, this quantification of high gene flow and low genetic structure contrasted with the demo-graphic knowledge collected on the Blue tit. Indeed, demodemo-graphic studies suggested restricted dispersal between these populations, with four dispersal events observed between B4D and B4E (5.6 km apart) and none between the B3E and either B4D or B4E (24.1 km), among a total of 2,788 males, 2,672 females, and 25,158 nestling ringed in the three main Corsican sites between 1976 and 2018, with a mean recruitment rate of 6% (Charmantier, com pers). Our interpretation of this contrast between gene flow estimations gath-ered from population genomic versus recapture data is quadruple. First, dispersal estimation on the field using capture–mark–recap-ture is very challenging and may require more data than currently collected, to detect rare dispersal events, even though these af-fect population genetic parameters. Moreover, since natal disper-sal in the Blue tit classically ranges between 330 m and 4 km (see Ortego, García-Navas, Ferrer, & Sanz, 2011; Tufto, Ringsby, Dhondt, Adriaensen, & Matthysen, 2005), the long-term monitoring sites in Corsica equipped with nest boxes (black circled dots in Figure 1c) are not ideally spaced to identify the origin of immigrants and the destination of emigrants, and only a small fraction of the landscape favorable to blue tit breeding is covered. Second, only a few migrants are sufficient to decrease the genetic distance between populations, measured through the FST (Cayuela et al., 2018; Marko & Hart, 2011). In that regard, our results may be compatible with the few dispersal events recorded throughout the years. Third, it is important to note that the number of migrants estimated using demographic analyses represents an average over historical time scales on the order of Ne generations and may have varied widely during contemporary times. Fourth, the large effective population size found both using coales-cence and a LD method might be explained by the existence of large “meta-populations” connected by high gene flow and such large Ne
F I G U R E 6 Relationship between recombination rate and
divergence. (a) Correlation between local recombination rate and
FST between populations on the mainland and in Corsica; (b) SNP
frequency per class of recombination rate; (c) outlier SNP frequency for the mainland-Corsica comparison, per class of recombination rate; (d) outlier SNP frequency for the deciduous–evergreen comparisons, per class of recombination rate. In panels c & d, outliers are given for the Bayescan and the RDA tests
0 20 40 60 80 100 120 0.06 0.08 0.10 0.12 FST Corsica−mainland All SNPs Frequency 0 20 40 60 80 100 120 0.000 0.005 0.010 0.015 0.020
Corsica−mainland outliers frequency
0 20 40 60 80 100 120 0.00 0.0 2 0.0 4 0.06 0.08 Bayescan RDA Recombination rate Deciduous−Ev ergreen outliers frequency 0 20 40 60 80 100 120 0.00 0.01 0.02 0.03 0.0 4 Bayescan RDA (a) (b) (c) (d)
might largely contribute to limit the genetic divergence between populations.
Ne was on average slightly larger in deciduous than in evergreen populations. This could be explained by the higher productivity of deciduous forests compared to evergreen forests, resulting in larger clutches and more fledglings in deciduous habitats (table 1 in Charmantier et al., 2016). However, the very high gene flow be-tween deciduous and evergreen populations and the low genetic
differentiation between these populations limits further interpreta-tions. In addition, populations monitored on the long term, for which hundreds of artificial nest boxes have been installed, tended to have larger Ne than nonmonitored populations. Breeding density in the nest box areas studied (Figure 1a) was around 1–1.3 pairs per ha (Blondel et al., 2006), which is most probably 3–5 times higher than natural densities for blue tits when these secondary hole-nesting birds rely on natural cavities only. It is hence possible that the recent
F I G U R E 7 Detection and
characteristics of a putative inversion on chromosome 3. (a) Recombination rate and SNP density along chromosome 3; (b) individual values for eigenvector 1 of a PCA of all the blue tit individuals from Corsica and the mainland; (c) MDS 1 values from Lostruct analysis; (d) FST between inverted, noninverted,
and heterozygous individuals from the mainland; (e) nucleotide diversity for inverted (in red), noninverted (in green), and heterozygous individuals (in blue) from the mainland; (f) PCA results for the region of the putative inversion for all the blue tit individuals; (g) mainland blue tits’ admixture proportions for K = 2 for the region of the putative inversion (individual ordered by decreasing ancestry value for the inverted cluster); (h) linkage disequilibrium for SNPs found in the putative inversion (plus 1 Mb each side of the inversion), for mainland blue tits; (i) genetic distances at the inversion, between four inverted blue tits, eight noninverted blue tits, and four great tits (sites of capture are indicated for each individual)