A Smile is Just a Smile: But Only for Men. Sex Differences in Meaning of Faces Scales
13
0
0
Texte intégral
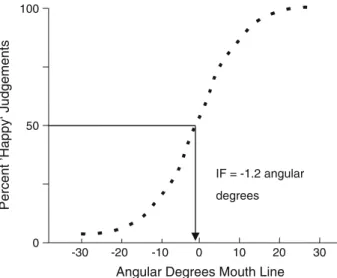
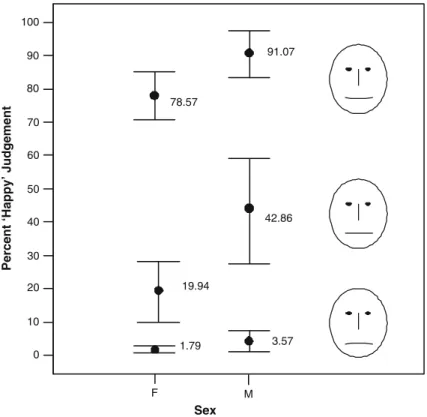
Figure


Documents relatifs