© The Author 2012. Published by Oxford University Press on behalf of the Society of Toxicology. All rights reserved. For permissions, please email: [email protected]
Mechanisms of Hepatocellular Toxicity Associated with
Dronedarone—A Comparison to Amiodarone
Andrea Felser,
*
,†
Kim Blum,
*
,†
Peter W. Lindinger,
*
,†
,‡
Jamal Bouitbir,
*
,†
,‡
and Stephan Krähenbühl
*
,†
,‡
,1*Department of Clinical Pharmacology & Toxicology, University Hospital, 4031 Basel, Switzerland; and †Department of Biomedicine and ‡Swiss Center of Applied Human Toxicology (SCAHT), University of Basel, Basel, Switzerland
1To whom correspondence should be addressed. Fax: +41-61-265-4560. E-mail: [email protected].
Received September 4, 2012; accepted October 3, 2012
Dronedarone is a new antiarrhythmic drug with an amiodarone-like benzofuran structure. Shortly after its introduction, dronedar-one became implicated in causing severe liver injury. Amiodardronedar-one is a well-known mitochondrial toxicant. The aim of our study was to investigate mechanisms of hepatotoxicity of dronedarone in vitro and to compare them with amiodarone. We used isolated rat liver mitochondria, primary human hepatocytes, and the human hepatoma cell line HepG2, which were exposed acutely or up to 24 h. After exposure of primary hepatocytes or HepG2 cells for 24 h, dronedarone and amiodarone caused cytotoxicity and apopto-sis starting at 20 and 50µM, respectively. The cellular ATP content started to decrease at 20µM for both drugs, suggesting mitochon-drial toxicity. Inhibition of the respiratory chain required concen-trations of ~10µM and was caused by an impairment of complexes I and II for both drugs. In parallel, mitochondrial accumulation of reactive oxygen species (ROS) was observed. In isolated rat liver mitochondria, acute treatment with dronedarone decreased the mitochondrial membrane potential, inhibited complex I, and uncoupled the respiratory chain. Furthermore, in acutely treated rat liver mitochondria and in HepG2 cells exposed for 24 h, drone-darone started to inhibit mitochondrial β-oxidation at 10µM and amiodarone at 20µM. Similar to amiodarone, dronedarone is an uncoupler and an inhibitor of the mitochondrial respiratory chain and of β-oxidation both acutely and after exposure for 24 h. Inhibition of mitochondrial function leads to accumulation of ROS and fatty acids, eventually leading to apoptosis and/or necrosis of hepatocytes. Mitochondrial toxicity may be an explanation for hepatotoxicity of dronedarone in vivo.
Key Words: benzofuran derivatives; mitochondria; uncoupling; electron transport chain; apoptosis.
Amiodarone is a well-established antiarrhythmic drug
(
Julian et al., 1997
;
Morse et al., 1988
), which is associated
with several potentially severe adverse reactions (
Mason, 1987
;
Stelfox et al., 2004
). Importantly, it is a hepatic mitochondrial
toxicant (
Lewis et al., 1989
,
1990
;
Morse et al., 1988
), which
has been described to uncouple oxidative phosphorylation, to
inhibit enzyme complexes of the electron transport chain and to
impair fatty acid β-oxidation (
Fromenty et al., 1990
;
Fromenty
and Pessayre, 1995
;
Kaufmann et al., 2005
;
Spaniol et al.,
2001
;
Waldhauser et al., 2006
). Mitochondrial β-oxidation and
oxidative phosphorylation are fundamental physiological
pro-cesses as evidenced by inherited impairment of these pathways,
which can affect the function of many organs, including the
liver (
Krahenbuhl et al., 1999
). Patients treated with
amiodar-one for several months or years may thus suffer from micro-
and/or macrovesicular steatosis, a disease that may progress to
steatohepatitis and may eventually be fatal (
Lewis et al., 1990
;
Simon et al., 1984
).
Dronedarone, a structural analog of amiodarone, was
specifi-cally designed to minimize the adverse reactions associated
with amiodarone (
Dobrev and Nattel, 2010
). As shown in
Figure 1
, dronedarone is a noniodinated amiodarone derivative
carrying a methylsulfonamide group at the benzofurane ring that
decreases its lipophilicity. Similar to amiodarone, dronedarone
is metabolized by N-desalkylation of the basic side chain by
cytochrome P450 (CYP) 3A4 (
Patel et al., 2009
). Although
the N-desalkylated metabolites are toxic for amiodarone
(
Waldhauser et al., 2006
;
Zahno et al., 2011
), this is currently
not known for dronedarone.
Shortly after its introduction, severe hepatic injury has been
reported in two patients treated with dronedarone, eventually
leading to liver transplantation (
Anonymous, 2011
). Recently,
Serviddio et al. (2011)
published a study in which they
investi-gated liver mitochondrial toxicity of dronedarone and
amiodar-one in vivo in rats. Similar to previous studies (
Fromenty et al.,
1990
;
Kaufmann et al., 2005
;
Spaniol et al., 2001
),
amiodar-one inhibited the activity of complex I of the respiratory chain,
uncoupled oxidative phosphorylation, and was associated with
increased reactive oxygen species (ROS) production and lipid
peroxidation. In contrast, dronedarone only uncoupled
oxida-tive phosphorylation, but was not associated with inhibition of
the respiratory chain or increased ROS production.
In this study, we aimed to investigate and to better understand
the mechanisms of cytotoxicity of dronedarone in vitro using
isolated rat liver mitochondria, primary human hepatocytes,
Advance Access publication November 7, 2012and HepG2 cells, a well-characterized human hepatoma cell
line (
Zahno et al., 2011
). We compared the toxic effects
associ-ated with dronedarone with those of amiodarone. Because the
two drugs are structurally related (
Fig. 1
) and both can cause
hepatic injury, we hypothesized that their mechanism of
ity may be similar. The systems used allowed to study the
toxic-ity acutely and after different exposure periods as well as after
cytochrome P450 (CYP) induction.
MATERIALS AND METHODS
Chemicals. Dronedarone hydrochloride was extracted from commercially available tablets (brand name Multaq) from ReseaChem life science GmbH (Burgdorf, Switzerland). The manufacturer declared the substance 99% pure by high-performance liquid chromatography and confirmed the structure by 1
H-NMR analysis. Amiodarone hydrochloride was purchased from Sigma-Aldrich (Buchs, Switzerland). Stock solutions were prepared in dimethylsulfoxide (DMSO) and stored at −20°C. All other chemicals used were purchased from Sigma-Aldrich or Fluka, except where indicated.
Cell lines and cell culture. The human hepatoma cell line HepG2 was pro-vided by ATCC (Manassas, VA) and maintained in Dulbecco’s Modified Eagle Medium (DMEM, with 1.0 g/l glucose, 4mM l-glutamine, and 1mM pyruvate) from Invitrogen (Basel, Switzerland). The culture medium was supplemented with 10% (vol/vol) heat-inactivated fetal calf serum, 2mM GlutaMax, 10mM 4-(2-hydroxyethyl)-1-piperazineethanesulfonic acid (HEPES) buffer and nones-sential amino acids. Cell culture supplements were all purchased from GIBCO (Paisley, UK). Cells were kept at 37°C in a humidified 5% CO2 cell culture incu-bator and were passaged using trypsin. The cell number was determined using a Neubauer hemacytometer and viability using the trypan blue exclusion method. Cryopreserved primary human hepatocytes were purchased from Becton Dickinson (BD Gentest, Woburn, MA). They were recovered and cultured according to the protocol of the manufacturer. Induction of CYP3A4 was achieved by preincubation of recovered primary human hepatocytes with 20µM rifampicin for 72 h (Zahno et al., 2011).
Rat liver mitochondria. Male Sprague Dawley rats were kept in the ani-mal facility of the University Hospital Basel (Basel, Switzerland) in a temper-ature-controlled environment with a 12-h light/dark cycle and food and water ad libitum. Animal procedures were conducted in accordance with the insti-tutional guidelines for the care and use of laboratory animals. The mean rat weight was 433 ± 79 g and the mean liver weight 12 ± 4 g. Rats were sacrificed
by pentobarbital overdose (100 mg/rat), and liver mitochondria were isolated by differential centrifugation according to the method of Hoppel et al. (1979). The mitochondrial protein content was determined using the bicinchoninic acid (BCA) protein assay kit from Merck (Darmstadt, Germany).
Cytotoxicity. Cytotoxicity was determined using ToxiLight BioAssay Kit (Lonza, Basel, Switzerland) according to the manufacturer’s manual. This assay measures the release of adenylate kinase, a marker for loss of cell membrane integrity, using a firefly luciferase system. After drug incuba-tion, 100 µl assay buffer was added to 20µl supernatant from drug-treated cell culture medium, and luminescence was measured after incubation in the dark for 5 min, using a Tecan M200 Pro Infinity plate reader (Männedorf, Switzerland).
Intracellular ATP content. Intracellular ATP was determined using CellTiterGlo Luminescent cell viability assay (Lonza), in accordance with the manufacturer’s manual. In brief, 100 µl assay buffer was added to each 96-well containing 100 µl culture medium. After incubation in the dark for 30 min, luminescence was measured using a Tecan M200 Pro Infinity plate reader.
Annexin V and propidium iodide staining. Apoptosis and necrosis were investigated using annexin V and propidium iodide (PI) staining (Invitrogen). Cells were treated with the test compounds for 24 h and stained with 1 µl annexin V-Alexa Fluor 647 and 1 µl propidium iodide 100 µg/ml in 100 µl annexin V binding buffer (10mM HEPES, 140mM NaCl, 2.5mM CaCl2 in H2O, pH 7.4). Cells were incubated for 15 min at room temperature (RT) and analyzed by flow cytometry using a CyAn ADP cytometer (Beckman Coulter, Marseille, France). Data were analyzed using FlowJo 9.3.2 software (Tree Star, Ashland, OR).
Caspase 3/7 assay. Caspase 3/7 activity was determined using the lumi-nescent Caspase-Glo 3/7 Assay (Promega, Wallisellen, Switzerland). The assay was conducted according to the manufacturer’s protocol.
Cytochrome c release. Quantitative determination of cytochrome c was performed as described by Waterhouse and Trapani (2003). HepG2 cells (100,000) were harvested and permeabilized with digitonin (10 µg/ml in Dulbecco’s PBS [DPBS] without calcium) at RT for 20 min. Cells were fixed in paraformaldehyde (4% in DPBS) for 20 min at RT and were washed with blocking buffer (bovine serum albumin [BSA] 10% in DPBS) for 1 h and incu-bated over night at 4°C with 1:1000 purified mouse anti-cytochrome c mono-clonal antibody (BD Pharmingen, Basel, Switzerland) in blocking buffer. Cells were washed with blocking buffer and incubated for 1 h with 1:1000 Alexa Fluor 488-labeled secondary antibody (Alexa Fluor 488 goat anti-mouse IgG, Invitrogen). After an additional washing step with DPBS, the cell suspensions were examined by flow cytometry. Because the selective permeabilization of the plasma membrane allows cytoplasmic cytochrome c to diffuse out of the FIG. 1. Chemical structures of dronedarone and amiodarone.
cell, mitochondrial release of cytochrome c into the cytoplasm leads to a low cellular cytochrome c content.
Cellular oxygen consumption using the Seahorse XF24 analyzer. Cellular respiration was measured using a Seahorse XF24 analyzer (Seahorse Biosciences, North Billerica, MA). HepG2 cells were seeded in Seahorse XF 24-well culture plates at 20,000 cells/well in DMEM growth medium and allowed to adhere overnight. Cells were treated with the drugs for 24 h. Before the experiment, the medium was replaced with 750 µl unbuffered medium using an XF Prep Station (Seahorse Biosciences), and cells were equilibrated for 40 min at 37°C in a CO2-free incubator. Basal oxygen consumption was determined in the presence of glutamate/pyruvate (4 and 1mM, respectively). After inhibition of mitochondrial phosphorylation by adding oligomycin (1µM) to determine the oxidative leak, the mitochondrial electron transport chain was stimulated maximally by the addition of the uncoupler carbonyl cyanide p-(trifluoromethoxyl)-phenyl-hydrozone (FCCP, 1µM). Finally, the extramito-chondrial respiration was determined after the addition of the complex I inhibi-tor rotenone (1µM). For the determination of the basal respiration, the oxidative leak, and maximal respiration, extramitochondrial respiration was subtracted.
Respiration by permeabilized HepG2 cells and isolated mitochondria. The activity of specific enzyme complexes of the respiratory chain was analyzed using an Oxygraph-2k high-resolution respirometer equipped with DatLab software (Oroboros Instruments, Innsbruck, Austria). Freshly isolated rat liver mitochondria or HepG2 cells were suspended in MiR06 (mitochondrial respi-ration medium containing 0.5mM EGTA, 3mM MgCl2, 60mM K-lactobionate, 20mM taurine, 10mM KH2PO4, 20mM HEPES, 110mM sucrose, 1 g/l fatty acid-free BSA, and 280 U/ml catalase, pH 7.1) and transferred to the precali-brated oxygraph chambers.
Activities of complexes I and II were assessed in isolated rat liver mito-chondria using l-glutamate/malate (10 and 2mM, respectively) as substrates, followed by the addition of ADP (2.5mM) and succinate/rotenone (10mM and 0.5µM, respectively). The oxidative leak, a measure for uncoupling, was deter-mined by assessing the residual oxygen consumption after addition of oligomy-cin (1µM). Uncoupling was achieved by the addition of FCCP (1µM).
The activities of complexes I, II, III, and IV were assessed in HepG2 cells permeabilized with digitonin (10 µg/1 million cells). In a first run, complexes I and III were analyzed using l-glutamate/malate as substrate followed by the addition of ADP and the inhibitor rotenone. Afterwards, duroquinol (500µM, Tokyo Chemical Industry, Tokyo, Japan) was added to investigate complex III and inhibited with antimycin A (2.5µM). In a second run, complexes II and IV were analyzed using succinate/rotenone as substrate, followed by the addition of ADP and the inhibitor antimycin A. Afterwards N,N,N´,N´-tetramethyl-p-phenylenediamine/ascorbate (0.5 and 2mM, respectively) was added to investi-gate complex IV and inhibited with KCN (1mM).
We confirmed the integrity of the outer mitochondrial membrane by show-ing the absence of a stimulatory effect of exogenous cytochrome c (10µM) on respiration. Respiration was expressed as oxygen consumption per mg protein. Protein concentrations were determined using the Pierce BCA protein assay kit from Merck.
Mitochondrial membrane potential. The mitochondrial membrane potential was determined as described by Kaufmann et al. (2005) with some modifications. Freshly isolated rat liver mitochondria were washed with incu-bation buffer containing 137mM sodium chloride, 4.74mM potassium chloride, 2.56mM calcium chloride, 1.18mM potassium phosphate, 1.18mM magnesium chloride, 10mM HEPES, and 1 g/l glucose (pH 7.4). Then, mitochondria were incubated at 37°C in incubation buffer containing 0.5 µl/ml [phenyl-3
H]-tet-raphenylphosphonium bromide (40 Ci/mmol, Anawa trading SA, Wangen, Switzerland). After 15 min, the suspension was centrifuged and the mitochon-drial pellet resuspended in fresh nonradioactive incubation buffer. Afterwards, mitochondria were treated with test substances for 1 h at 37°C and centrifuged. After the incubation, radioactivity of the mitochondrial pellet was measured on a Packard 1900 TR liquid scintillation analyzer.
Mitochondrial accumulation of reactive oxygen species. HepG2 cells were stained with Hoechst 33342 trihydrochloride trihydrate (final concentra-tion 20 µg/ml DMEM, Invitrogen) for 30 min at 37°C, followed by the addiconcentra-tion
of and MitoSOX red (final concentration 5µM in DMEM, Invitrogen) and dronedarone (5, 10, and 20µM) or amiodarone (10, 20, and 50µM). Real-time accumulation of superoxide was analyzed over 6 h using a Cellomics ArrayScan VTI HCS Reader (Thermo scientific, Pittsburg, PA).
mRNA expression of superoxide dismutase 1 and superoxide dismutase 2. The mRNA expression of superoxide dismutase 1 (SOD1) and superoxide dismutase 2 (SOD2) was assessed using real-time PCR as described previ-ously (Mullen et al., 2011). HepG2 cells were treated for 24 h, and RNA was extracted and purified using the Qiagen RNeasy mini extraction kit (Qiagen, Hombrechtikon, Switzerland). The purity and quantity of RNA were evalu-ated with the NanoDrop 2000 (Thermo Scientific, Wohlen, Switzerland), and cDNA was synthesized from 10 µg RNA using the Qiagen omniscript system. The real-time PCR was performed in triplicate using SYBR Green (Roche Diagnostics, Rotkreuz, Basel). We used primers specific for the cytosolic SOD1 (forward: 5´-TGGCCGATGTGTCTATTGAA-3´, reverse: 5´-ACCTTTGCCCAAGTCATCTG-3´) and mitochondrial SOD2 (forward: 5´-GGTTGTTCACGTAGGCCG-3´, reverse: 5´-CAGCAGGCAGCTGGCT-3´) and calculated relative quantities of specifically amplified cDNA with the comparative-threshold cycle method. GAPDH was used as endogenous reference (forward: 5′-CATGGCCTTCCGTGTTCCTA-3′; reverse: 5′-CCT-GCTTC ACCACCTTCTTGA-3′) and no-template and no-reverse-transcription controls were used to exclude nonspecific amplification (Mullen et al., 2011).
Mitochondrial β-oxidation. Metabolism of [1-14C] palmitic acid (60 mCi/
mmol; PerkinElmer, Schwerzenbach, Switzerland) was assessed via the forma-tion of 14C-acid–soluble β-oxidation products. Experiments were performed as
previously described (Kaufmann et al., 2005) with some modifications. Isolated rat liver mitochondria were incubated for 15 min in the presence of the test com-pounds in assay buffer (200µM Na-palmitate, 0.1 pCi/ml [1-14C] palmitic acid
(60 mCi/mmol), 70mM sucrose, 43mM KCl, 3.6mM MgCl2, 7.2mM KH2PO4, 36mM Tris, 2mM ATP, 500µM l-carnitine, 150µM coenzyme A, 50mM acetoac-etate, 170µM BSA essentially fatty acid free, pH 7.4) at 37°C in a thermomixer at 600 rpm (Eppendorf, Switzerland). HepG2 cells were permeabilized with digi-tonin (10 µg/million cells) after drug exposure for 24 h and incubated for 1 h in the same assay buffer. The reactions were stopped by adding 400 µl 20% perchlo-ric acid, and samples were precipitated for 20 min on ice before centrifugation (10,000 × g, 2 min). Radioactivity was measured in the supernatant.
Intracellular lipid accumulation. Experiments were performed as described by Donato et al. (2009). HepG2 cells were exposed for 24 h to exoge-nous lipids (DMEM containing 62µM of a 2:1 mixture of oleate and palmitate). Cells were treated with toxicants in lipid-free medium for 24 h, and intracellular lipid accumulation was measured using BODIPY 493/503 (final concentration 3.75 ng/ml), a nonpolar derivative of the BODIPY fluorophore (Donato et al., 2009). Cell suspensions were stained for 30 min at 37°C in Hank’s buffered salt solution buffer in the dark, before examining by flow cytometry without any additional washing step. In order to exclude nonviable cells, PI was added and the analysis was restricted to live-cell populations.
Statistical methods. Data are given as the mean ± SEM of at least three independent experiments. Statistical analyses were performed using GraphPad Prism 5 (GraphPad Software, La Jolla, CA). One-way ANOVA was used for comparisons of more than two groups, followed by the comparisons between incubations containing toxicants and the control group using Dunnett’s posttest procedure. Differences between induction experiments were compared using two-way ANOVA followed by Bonferroni’s post hoc test. P-values < 0.05 (*) or < 0.01 (**) were considered significant.
RESULTS
Cytotoxicity in Primary Human Hepatocytes and
HepG2 Cells
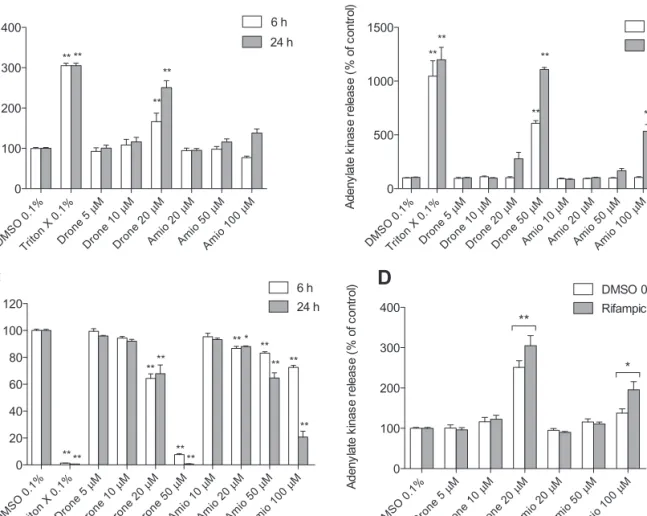
In primary human hepatocytes, dronedarone caused adenylate
kinase release starting at a concentration of 20µM after treatment
for 6 or 24 h, whereas amiodarone was not toxic up to 100µM
(
Fig. 2A
). In HepG2 cells, dronedarone and amiodarone were
both toxic starting at 50 and 100µM, respectively (
Fig. 2B
).
Intracellular ATP started to decrease at 20µM for both
dronedar-one and amiodardronedar-one after exposure for 6 or 24 h, suggesting that
mitochondria were affected before cytotoxicity could be
dem-onstrated (
Fig. 2C
). CYP3A4 induction by rifampicin increased
the cytotoxicity of both 100µM amiodarone (42%) and 20µM
dronedarone (21%). Considering the only small increase in
drone-darone-associated cytotoxicity with CYP3A4 induction, the
fol-lowing studies were carried out with the parent compounds only.
Acute Effects on Isolated Rat Liver Mitochondria
Reduced cellular ATP content was compatible with impaired
mitochondrial function, which has been reported previously
for amiodarone (
Fromenty et al., 1990
;
Spaniol et al., 2001
;
Waldhauser et al., 2006
). As shown in
Figure 3A
, both
ami-odarone and dronedarone reduced the membrane potential of
isolated rat liver mitochondria, confirming this assumption.
Both toxicants impaired concentration dependently the
max-imal function of the electron transport chain in the presence
of oligomycin and FCCP and acted as uncouplers of
oxida-tive phosphorylation as evidenced by an increase of the
res-piratory leak in the presence of oligomycin (
Figs. 3B
and
3C
).
Further investigation of oxidative phosphorylation revealed a
concentration-dependent decrease of state 3 respiration in the
presence of
l-glutamate/malate by both toxicants (
Figs. 4A
and
4B
). With succinate as substrate, the inhibition was less
pro-nounced, showing only for amiodarone a significant inhibition
of state 3 respiration at 50µM (
Figs. 4A
and
4B
).
Subacute Mitochondrial Toxicity in HepG2 Cells
The oxygen consumption of intact HepG2 cells was assessed
at drug concentrations that were not cytotoxic in previous
DMSO 0.1 % Trito n X 0.1% Dron e 5 µM Dron e 10 µM Dron e 20 µM Dron e 50 µM Amio 10µ M Amio 20µ M Amio 50µ M Amio 100 µM 0 500 1000 1500 6 h 24 h ** ** ** ** ** Ad en yl at e ki na se re le ase (% o f c on tr ol ) DMSO 0.1 % Trito n X 0.1% Dron e 5 µ M Dron e 10 µM Dron e 20 µM Dron e 50 µM Amio 10µ M Amio 20µ M Amio 50µ M Amio 100 µM 0 20 40 60 80 100 120 6 h 24 h **** ** ** ** * ** ** ** ** ** ** In tr ac el lu la r AT P ( % o f co nt ro l) DMSO 0.1 % Trito n X 0.1% Dron e 5 µM Dron e 10 µM Dron e 20 µM Amio 20µ M Amio 50µ M Amio 100 µM 0 100 200 300 400 6 h 24 h ** ** ** ** Ad en yl at e ki na se re le as e (% of co nt ro l)
A
C
B
D
DMSO 0.1 % Dron e 5 µM Dron e 10 µM Dron e 20 µM Amio 20µ M Amio 50µ M Amio 100 µM 0 100 200 300 400 DMSO 0.1% Rifampicin ** * A de ny la te k in as e re le as e (% of co nt ro l)FIG. 2. Cytotoxicity and effect on intracellular ATP content. Cytotoxicity was assessed using the Toxi-Light assay. (A) Cytotoxicity in primary human hepatocytes after drug exposure for 6 or 24 h. (B) Cytotoxicity in HepG2 cells after drug exposure for 6 or 24 h. (C) Intracellular ATP content in HepG2 cells expressed as a percentage of the values obtained for DMSO (control). (D) Effect of pretreatment with rifampicin on cytotoxicity. Primary human hepatocytes were pretreated with rifampicin and then exposed to dronedarone or amiodarone for 24 h. CYP induction by rifampicin was associated with a 21% increase in cytotoxicity for dronedarone and a 42% increase for amiodarone. If not indicated otherwise, cytotoxicity data are expressed as percent increase compared with DMSO control. Drone: dronedarone, Amio: amiodarone. Data represent the mean ± SEM of at least three independent experiments. *p < 0.05 versus DMSO control. **p < 0.01 versus DMSO control.
DMSO 0.1 % Dron e 5 µ M Dron e 10 µM Drone 20 µM Drone 50 µ M 0 1000 2000 3000 4000
Oligo (leak resp.) Fccp (max. resp.) * ** ** * O2 fl ux (p mo l x s -1x mg pr ot ei n -1) DMSO 0.1 % Amio 5 µM Amio 10 µM Amio 20 µ M Amio 50 µM 0 1000 2000 3000 4000
Oligo (leak resp.) Fccp (max. resp.) ** ** * ** O2 fl ux (p mo l x s -1x mg pr ot ei n -1)
A
C
B
FIG. 3. Effect on membrane potential and oxidative metabolism of freshly isolated rat liver mitochondria. (A) Mitochondria were labeled with [3H]-tetraphenylphosphonium bromide, and mitochondrial accumulation of radioactivity was determined. DMSO served as control and was set at 100%. (B) and
(C) Acute effect of dronedarone and amiodarone on the respiratory leak (respiration in the presence of oligomycin) and maximal (FCCP-induced) respiration after acute drug exposure. Drone: dronedarone, Amio: amiodarone, Oligo: oligomycin. Data represent the mean ± SEM of at least three individual preparations. *p < 0.05 versus control. **p < 0.01 versus control.
DMSO 0.1 % Dron e 5 µ M Drone 10 µ M Dron e 20 µM Drone 50 µM 0 500 1000 1500 2000 2500
Glut/ mal (state 2) ADP (state 3) Succ/ rot (state 3)
** ** ** O2 fl ux (p mo l x s -1x mg pr ot ei n -1) DMSO 0.1 % Amio 5 µM Amio 10 µM Amio 20 µM Amio 50 µM 0 500 1000 1500 2000 2500
Glut/ mal (state 2) ADP (state 3) Succ/ rot (state 3)
** ** ** * O2 fl ux (p mo l x s -1x mg pr ot ei n -1)
A
B
FIG. 4. Acute effect of dronedarone and amiodarone on oxidative metabolism of freshly isolated rat liver mitochondria. Glut/mal: glutamate/malate, Succ/rot: succinate/rotenone, Drone: dronedarone, Amio: amiodarone. Data represent the mean ± SEM. *p < 0.05 versus control. **p < 0.01 versus control.
experiments.
Figures 5A
and
5B
show oxygen consumption
of HepG2 cells after treatment with vehicle (DMSO),
drone-darone (5µM, 10µM), or amiodrone-darone (5µM, 10µM) for 24 h.
A concentration of 5µM did not significantly decrease basal
and maximal respiration for both drugs, whereas the higher
concentration decreased maximal (uncoupled) respiration for
both drugs significantly (
Fig. 5C
). The respiratory leak after the
addition of oligomycin was not significantly increased by the
toxicants (
Fig. 5C
), suggesting that dronedarone and
amiodar-one had no uncoupling effect in HepG2 cells exposed for 24 h
at these low concentrations.
In order to investigate the mechanism of decreased maximal
respiration, the respiratory capacities through the complexes of
the electron transport chain were analyzed using
high-resolu-tion respirometry. After exposure to 10µM dronedarone or
ami-odarone for 24 h, the respiratory capacities through complexes
I and II were decreased for both drugs (
Fig. 5D
).
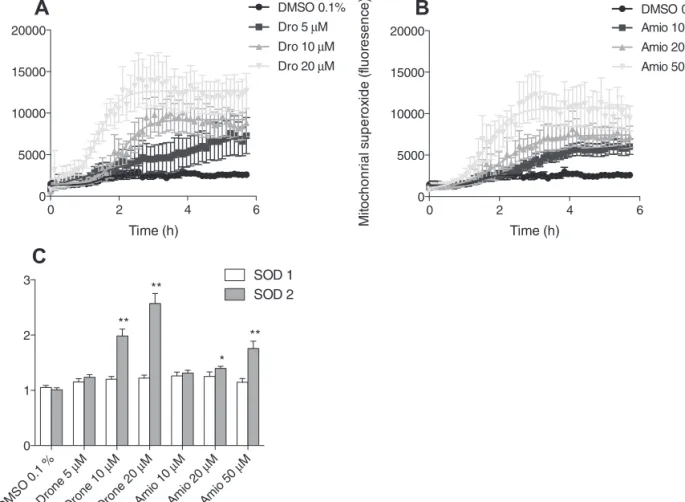
As expected from toxicants inhibiting complex I (
Drose
and Brandt, 2012
), mitochondrial superoxide accumulated in
HepG2 cells when exposed to the toxicants (
Figs. 6A
and
6B
).
At the same time, mRNA expression of mitochondrial SOD2
was increased, whereas the expression of the cytoplasmic
SOD1 remained unchanged (
Fig. 6C
), underscoring that
drone-darone and amiodrone-darone mainly affect mitochondria.
Effect on Mitochondrial
β-Oxidation and Cellular
Accumulation of Fatty Acids
Mitochondrial β-oxidation was monitored by the formation
of acid-soluble β-oxidation products from palmitate in isolated
rat liver mitochondria after acute exposure to dronedarone
and amiodarone. Dronedarone started to inhibit β-oxidation
by isolated rat liver mitochondria at 20µM and amiodarone
at 100µM (
Fig. 7A
). In permeabilized HepG2 cells after 24 h
drug exposure, dronedarone started to inhibit mitochondrial
β-oxidation at 10µM and amiodarone at 20µM (
Fig. 7B
). As a
consequence, intracellular lipid accumulation was significant
after exposure to 20µM dronedarone or 50µM amiodarone for
24 h.
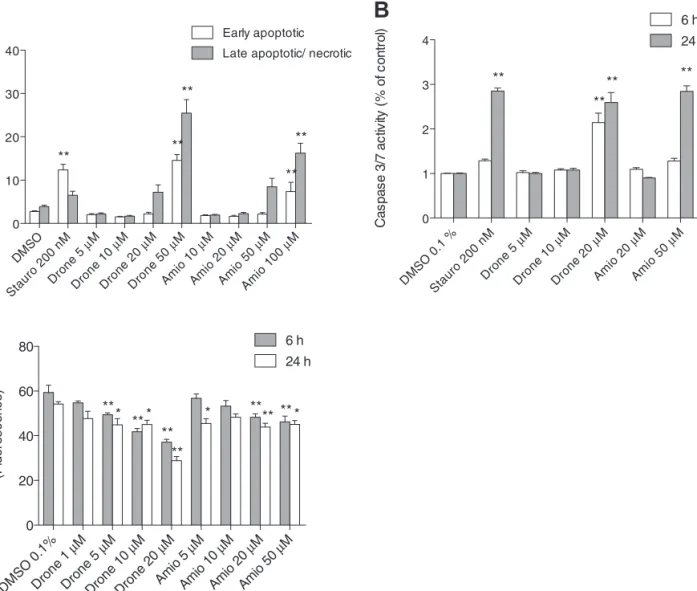
Mechanisms of Cell Death in HepG2 Cells
In order to investigate the mechanism of cell death,
exter-nalization of phosphatidylserine was analyzed using annexin
V and disintegration of cell membranes with PI. Flow
cytomet-ric analysis of HepG2 cells revealed a progressive increase of
0 50 100 150 0 200 400 600 DMSO 0.1% Drone 5 µM Drone 10 µM Oligo FCCP Rot Time (min) OC R (p mo l x mi n -1) 0 50 100 150 0 200 400 600 DMSO 0.1% Amio 5 µM Amio 10 µM Oligo FCCP Rot Time (min) OC R (p mo l x mi n -1) Com plex I Com plex I I Com plex I II Com plex I V 0 50 100 150 200 250 DMSO 0.1% Drone 10 µM Amio 10 µM ** ** * ** O2 fl ux (pmo l x s -1x mg pr ot ei n -1)
A
B
C
D
DMSO 0.1% Dron e 5 µ M Dron e 10 µM Amio 5 µM Amio 10 µ M 0 100 200 300 400 500 Basal resp. Oligo (Leak resp.) FCCP (max. resp.) ** ** * OC R (p mo l x mi n -1)FIG. 5. Subacute effect of dronedarone and amiodarone on oxidative metabolism of HepG2 cells. (A) and (B) Oxygen consumption rate after 24 h exposure for dronedarone or amiodarone measured on the Seahorse XF24 analyzer. (C) Basal respiration, oxidative leak, and maximal respiration after 24 h drug exposure measured on the Seahorse XF24 analyzer. (D) Respiratory capacity through complexes I, II, III, and IV after 24 h drug exposure measured on the Oxygraph-2k high-resolution respirometer. Drone: dronedarone, Amio: amiodarone, Oligo: oligomycin. Data present the mean ± SEM. *p < 0.05, **p < 0.01 versus control.
early and late apoptotic cells with increasing concentrations of
dronedarone or amiodarone (
Fig. 8A
). The activity of caspases
3/7, key mediators of apoptosis, was increased after treatment
with 20µM dronedarone for 6 or 24 h, and after treatment with
50µM amiodarone for 24 h (
Fig. 8B
). Furthermore, the release
of cytochrome c from mitochondria was significant after 6 or
24 h of incubation with 5µM dronedarone and with 20µM or
5µM amiodarone, respectively (
Fig. 8C
). Mitochondrial release
of cytochrome c is a marker of permeabilization of the
mito-chondrial outer membrane, activating the intrinsic apoptotic
pathway (
Antico Arciuch et al., 2012
).
DIScUSSION
Our investigations demonstrate that both dronedarone and
amiodarone are uncouplers and inhibitors of the mitochondrial
respiratory chain and also inhibit mitochondrial β-oxidation.
Furthermore, exposure to dronedarone and amiodarone was
associated with cellular superoxide accumulation and lipid
storage, eventually leading to apoptosis and/or necrosis.
Both compounds tested were toxic for isolated liver
mitochondria, primary human hepatocytes, and HepG2 cells.
They impaired mitochondrial function starting at concentrations
between 10 and 20µM, whereas cytotoxicity was observed
at higher concentrations, namely 20µM for dronedarone and
50µM for amiodarone. At therapeutic dosages, amiodarone
reaches plasma concentrations in the range of ~2µM (
Lafuente-Lafuente et al., 2009
). In liver, amiodarone concentrations
are 10–20 times higher than in plasma (
Wyss et al., 1990
),
suggesting that the results of this study are clinically relevant.
This assumption is supported by the observation that in 104
patients treated with amiodarone and followed prospectively,
25 developed an increase in serum transaminases and 3 out of
these 25 patients symptomatic liver injury (
Lewis et al., 1989
).
For dronedarone, plasma concentrations reached at therapeutic
dosages are in the range of 0.2µM (
Patel et al., 2009
), which is
~50 times lower than the lowest concentration where we started
to observe mitochondrial toxicity. Dronedarone is almost
completely absorbed and its bioavailability is only 15% (
Hoy
and Keam, 2009
), suggesting that the hepatic concentrations
may be higher than in plasma. This may even more so in patients
DMS O 0.1 % Dron e 5 µ M Dron e 10 µM Dron e 20 µM Amio 10 µ M Amio 20 µM Amio 50 µ M 0 1 2 3 SOD 1 SOD 2 ** ** * ** Fo ld in cr ea se in mR NA
A
C
B
0 2 4 6 0 5000 10000 15000 20000 DMSO 0.1% Amio 10 µM Amio 20 µM Amio 50 µM Time (h) Mi to ch on rial su pe ro xi de (fluor es en ce ) 0 2 4 6 0 5000 10000 15000 20000 DMSO 0.1% Dro 5 µM Dro 10 µM Dro 20 µM Time (h) Mi to ch ondr ial su pe ro xi de (flu or es ce nc e)FIG. 6. Mitochondrial ROS production and SOD expression by HepG2 cells. (A) and (B) Mitochondrial ROS accumulation in the presence of dronedarone or amiodarone for 24 h. (C) mRNA expression of SOD1, SOD2 in HepG2 cells after exposure to dronedarone or amiodarone for 24 h. Drone: dronedarone, Amio: amiodarone. Data present the mean ± SEM. *p < 0.05, **p < 0.01 versus control.
with low hepatic CYP3A4 activity, in particular in patients
treated concomitantly with CYP3A4 inhibitors, because
dronedarone is metabolized mainly by CYP3A4 (
Dorian, 2010
;
Patel et al., 2009
). Although dronedarone was at least as toxic as
amiodarone in this study, slightly less patients appear to develop
liver injury during treatment with dronedarone compared with
amiodarone. In large clinical studies, between 0.6 and 13.6%
of the patients treated with dronedarone have been reported to
develop liver injury (
Connolly et al., 2011
;
Hohnloser et al.,
2009
;
Singh et al., 2007
). The large variation can be explained
by different definitions of liver injury and by the patients
included into the studies. No patient in these studies developed
symptomatic liver injury. The apparently lower hepatic toxicity
of dronedarone compared with amiodarone in clinical studies
may at least partially be explained by the assumption that the
tissue accumulation of dronedarone is less accentuated than for
amiodarone due to the lower lipophilicity of dronedarone (
Hoy
and Keam, 2009
). As a consequence, as discussed above, only
specific patients may reach high enough hepatic concentrations
which lead to hepatocyte damage.
Our data suggest that the toxicity of dronedarone is mainly
caused by the parent compound. In comparison to amiodarone,
the N-dealkylated metabolites appear to play a less important
role for the toxicity (
Fig. 2D
). The question concerning the
tox-icity of the N-dealkylated metabolites is clinically important,
because, as we have shown in an in vitro study for amiodarone,
CYP3A4 induction is a risk factor for hepatotoxicity, because
the N-dealkylated metabolites are even more hepatotoxic than
A
C
B
DM
SO
Dr
one
5
µM
Dr
one 10
µ
M
Dr
on
e
20
µM
Am
io
10
µM
Am
io
20
µM
Am
io
50
µM
0
100
200
300
400
**
**
In
trac
el
lu
la
r lipid
(%
of
co
nt
ro
l)
DM
SO
0
.1
%
Dr
on
e
5 µ
M
Dr
on
e
10
µ
M
Dr
on
e
20
µ
M
Dr
on
e
50
µ
M
Dr
on
e
10
0 µ
M
Am
io
10
µM
Am
io
20
µ
M
Am
io
50
µM
Am
io
10
0 µ
M
Am
io
20
0 µ
M
0 5 10 15 20*
** **
**
**
β-o
xi
dat
io
n
of [1
-14C]
pa
lm
itic
ac
id
(n
mo
l x
mi
n
-1x
mg pr
ot
ei
n
-1)
DM
SO
0.1%
Dr
one 0.
5 µ
M
Dr
on
e
1 µ
M
Dr
on
e
5 µ
M
Dr
one
10
µ
M
Dr
one
20
µ
M
Am
io
1 µ
M
Am
io
5 µ
M
Am
io
10
µM
Am
io
20
µ
M
Am
io
50
µM
0.0
0.2
0.4
0.6
0.8
**
**
**
**
β-o
xi
da
tion of [1
-14C]
pa
lm
itic
ac
id
(n
mo
l x
mi
n
-1x
mg pr
ot
ei
n
-1)
FIG. 7. Effect on mitochondrial β-oxidation and intracellular fat accumulation. (A) Freshly isolated rat liver mitochondria were exposed to test compounds and acute inhibition of the rate of β-oxidation was determined. (B) HepG2 cells were exposed to test compounds for 24 h and β-oxidation was determined in permeabilized cells. (C) Intracellular triglyceride accumulation in HepG2 cells after drug exposure for 24 h. Drone: dronedarone, Amio: amiodarone. Data present the mean ± SEM. *p < 0.05 versus control. **p < 0.01 versus control.
amiodarone (
Waldhauser et al., 2006
;
Zahno et al., 2011
). For
dronedarone, this question can only be answered accurately,
however, when toxicological studies can be carried out with the
corresponding N-dealkylated metabolites.
The toxicity of dronedarone and amiodarone on the electron
transport chain was quite similar. Both drugs inhibited complex
I and uncoupled oxidative phosphorylation in isolated liver
mito-chondria in a concentration-dependent manner. Amiodarone
inhibited also complex II, a finding observed for dronedarone
only in HepG2 cells, but not in isolated rat liver mitochondria.
For amiodarone, such findings have already been described in
previous studies (
Fromenty et al., 1990
;
Spaniol et al., 2001
;
Waldhauser et al., 2006
). For dronedarone, they are not
sur-prising, taking into account its structure with a benzofurane
ring carrying a butyl side chain. These structural properties
have been described in a previous study from our laboratory
as being sufficient for mitochondrial toxicity (
Kaufmann et al.,
2005
). Importantly, the effects of both drugs on mitochondrial
respiration were observed at lower concentrations than those
required for cytotoxicity; taking into account the concentration
dependency, it is likely that mitochondrial toxicity is a major
reason for the cytotoxicity of these compounds. In contrast to
our study,
Serviddio et al. (2011)
had not observed an
inhibi-tion of enzyme complexes of the electron transport chain in
liver mitochondria isolated from rats treated with
dronedar-one. This discrepancy with our study may be explained by the
observation that small molecules such as drugs can diffuse out
of the mitochondria during the isolation procedure (
Spaniol
et al
., 2003
). In our experiments, we used either isolated
mito-chondria which were exposed to a known drug concentration
DMSO 0.1 % Stau ro 2 00 n M Dron e 5 µ M Dron e 10 µM Dron e 20 µM Amio 20 µ M Amio 50 µ M 0 1 2 3 4 6 h 24 h ** ** ** ** Ca sp as e 3/ 7 ac tivi ty (% of co nt ro l) DMSO Stau ro 2 00 n M Dron e 5 µ M Dron e 10 µM Dron e 20 µM Dron e 50 µM Amio 10 µ M Amio 20 µ M Amio 50 µ M Amio 100 µ M 0 10 20 30 40 Early apoptotic Late apoptotic/ necrotic ** ** ** ** ** Pe rc en t ce ll co un t
A
C
B
DMSO 0.1% Dron e 1 µ M Drone 5 µM Dron e 10 µM Dron e 20 µM Amio 5 µM Amio 10 µM Amio 20 µM Amio 50 µM 0 20 40 60 80 6 h 24 h ** ** ** ** ** ** * * * ** * Mi to ch on dr ia l cy to ch ro me c (F lu or es ce nc e)FIG. 8. Mechanisms of cell death. (A) Annexin V binding and PI uptake by HepG2 cells which were exposed for 24 h to test compounds. The samples were analyzed using flow cytometry. Early apoptotic populations are stained only with annexin V and late apoptotic represent annexin V and PI double-stained popula-tions, undergoing necrosis or later stages of apoptosis. Staurosporine was used as a positive control for apoptosis. Data are presented as percent cell count. (B) Caspase 3/7 activity after drug exposure for 6 and 24 h, expressed as percent increase compared with DMSO control. (C) Mitochondrial cytochrome c content after drug exposure for 6 and 24 h expressed as fluorescence intensity measured by flow cytometry. Stauro: staurosporine, Drone: dronedarone, Amio; amiodarone. Data represent the mean ± SEM of at least three independent experiments. *p < 0.05 versus DMSO control **p < 0.01 versus DMSO control.
or permeabilized hepatocytes, in which the local environment
of the mitochondria should not have changed much during the
experimental procedures. Alternatively, the exposure in the
study of
Serviddio et al. (2011)
, may have been lower than in
our in vitro investigations. In their study, Serviddio et al. used
a dosage of ~40 mg dronedarone per kg body weight and they
did not determine serum or tissue concentrations.
Besides affecting the electron transport chain,
dronedar-one and amiodardronedar-one also efficiently inhibited mitochondrial
β-oxidation. Steatosis during the treatment with amiodarone
is well established (
Lewis et al., 1990
;
Simon et al., 1984
)
and may be a result from impaired β-oxidation (
Fromenty and
Pessayre, 1995
;
Kaufmann et al., 2005
). A likely mechanism
how amiodarone inhibits β-oxidation is by inhibiting carnitine
palmitoyltransferase 1 (
Kennedy et al., 1996
), which is
con-sidered to be rate limiting for β-oxidation. In contrast to
ami-odarone, the effects of dronedarone on the individual steps of
β-oxidation are currently not known. The inhibition of
mito-chondrial
β-oxidation has several consequences. As shown
in the current and in previous investigations (
Begriche et al.,
2011
;
Spaniol et al., 2003
), free fatty acids, acyl-CoAs, and
triglycerides accumulate and may be toxic in hepatocytes.
Accumulating free fatty acids have been described to uncouple
oxidative phosphorylation, to increase ROS production, and to
induce mitochondrial permeability transition, eventually
lead-ing to apoptosis (
Rial et al., 2010
).
Both inhibition of the electron transport chain (especially
complexes I and/or III) (
Drose and Brandt, 2012
;
Liu et al.,
2002
) and inhibition of β-oxidation (
Kaufmann et al., 2005
) are
associated with increased mitochondrial production of ROS. In
the presence of inhibitors of complex I or III, electrons may
escape from the electron transport chain and react with
molecu-lar oxygen to form superoxide (
Liu et al., 2002
). Under normal
conditions, superoxide is degraded by intramitochondrial
anti-oxidative systems such as glutathione peroxidase and
super-oxide dismutase (
Bouitbir et al., 2012
;
Troy and Shelanski,
1994
). The observed increase of the mRNA expression of
mitochondrial SOD2 after treatment with 20µM dronedarone
or 50µM amiodarone can therefore be regarded as a
compen-satory mechanism to counteract increased mitochondrial ROS
production. The lacking increase of cytosolic SOD1 mRNA
expression suggests that ROS production was primarily
intram-itochondrial. An increase of mitochondrial ROS production is
a trigger for opening of the mitochondrial membrane
perme-ability transition pore, which is associated with cytochrome c
release into the cytoplasm and induction of apoptosis and/or
necrosis (
Antico Arciuch et al., 2012
). Mitochondrial release
of cytochrome c and apoptosis could clearly be demonstrated
in our study.
In conclusion, our investigations demonstrate that
drone-darone inhibits the electron transport chain and β-oxidation
and uncouples oxidative phosphorylation of liver
mitochon-dria. Inhibition of complex I and of β-oxidation is associated
with increased mitochondrial ROS production, which triggers
mitochondrial membrane permeability transition and
apopto-sis. These findings may explain liver toxicity observed in
pre-disposed patients.
FUNDING
Swiss National Science Foundation (SNF 31003A-132992
to S.K.).
REFERENcES
Anonymous. (2011). In brief: FDA warning on dronedarone (Multaq). Med. Lett. Drugs Ther. 53, 17.
Antico Arciuch, V. G., Elguero, M. E., Poderoso, J. J., and Carreras, M. C. (2012). Mitochondrial regulation of cell cycle and proliferation. Antioxid. Redox Signal. 16, 1150–1180.
Begriche, K., Massart, J., Robin, M. A., Borgne-Sanchez, A., and Fromenty, B. (2011). Drug-induced toxicity on mitochondria and lipid metabolism: Mechanistic diversity and deleterious consequences for the liver. J. Hepatol. 54, 773–794.
Bouitbir, J., Charles, A. L., Echaniz-Laguna, A., Kindo, M., Daussin, F., Auwerx, J., Piquard, F., Geny, B., and Zoll, J. (2012). Opposite effects of statins on mitochondria of cardiac and skeletal muscles: A ‘mitohormesis’ mechanism involving reactive oxygen species and PGC-1. Eur. Heart J. 33, 1397–1407.
Connolly, S. J., Camm, A. J., Halperin, J. L., Joyner, C., Alings, M., Amerena, J., Atar, D., Avezum, Á., Blomström, P., Borggrefe, M., et al. (2011). Dronedarone in high-risk permanent atrial fibrillation. N. Engl. J. Med. 365, 2268–2276.
Dobrev, D., and Nattel, S. (2010). New antiarrhythmic drugs for treatment of atrial fibrillation. Lancet. 375, 1212–1223.
Donato, M. T., Martínez-Romero, A., Jiménez, N., Negro, A., Herrera, G., Castell, J. V., O’Connor, J. E., and Gómez-Lechón, M. J. (2009). Cytometric analysis for drug-induced steatosis in HepG2 cells. Chem. Biol. Interact. 181, 417–423.
Dorian, P. (2010). Clinical pharmacology of dronedarone: Implications for the therapy of atrial fibrillation. J. Cardiovasc. Pharmacol. Ther. 15(4 Suppl.), 15S–18S.
Drose, S., and Brandt, U. (2012). Molecular mechanisms of superoxide pro-duction by the mitochondrial respiratory chain. Adv. Exp. Med. Biol. 748, 145–169.
Fromenty, B., Fisch, C., Berson, A., Letteron, P., Larrey, D., and Pessayre, D. (1990). Dual effect of amiodarone on mitochondrial respiration. Initial pro-tonophoric uncoupling effect followed by inhibition of the respiratory chain at the levels of complex I and complex II. J. Pharmacol. Exp. Ther. 255, 1377–1384.
Fromenty, B., and Pessayre, D. (1995). Inhibition of mitochondrial beta-oxida-tion as a mechanism of hepatotoxicity. Pharmacol. Ther. 67, 101–154. Hohnloser, S. H., Crijns, H. J., van Eickels, M., Gaudin, C., Page, R. L.,
Torp-Pedersen, C., and Connolly, S. J. (2009). Effect of dronedarone on cardiovas-cular events in atrial fibrillation. N. Engl. J. Med. 360, 668–678.
Hoppel, C., DiMarco, J. P., and Tandler, B. (1979). Riboflavin and rat hepatic cell structure and function. Mitochondrial oxidative metabolism in defi-ciency states. J. Biol. Chem. 254, 4164–4170.
Hoy, S. M., and Keam, S. J. (2009). Dronedarone. Drugs 69, 1647–1663. Julian, D. G., Camm, A. J., Frangin, G., Janse, M. J., Munoz, A., Schwartz,
P. J., and Simon, P. (1997). Randomised trial of effect of amiodarone on mortality in patients with left-ventricular dysfunction after recent myocar-dial infarction: EMIAT. European Myocarmyocar-dial Infarct Amiodarone Trial Investigators. Lancet 349, 667–674.
Kaufmann, P., Török, M., Hänni, A., Roberts, P., Gasser, R., and Krähenbühl, S. (2005). Mechanisms of benzarone and benzbromarone-induced hepatic toxicity. Hepatology 41, 925–935.
Kennedy, J. A., Unger, S. A., and Horowitz, J. D. (1996). Inhibition of carnitine palmitoyltransferase-1 in rat heart and liver by perhexiline and amiodarone. Biochem. Pharmacol. 52, 273–280.
Krahenbuhl, S., Kleinle, S., Henz, S., Leibundgut, K., Liechti, S., Zimmermann, A., and Wiesmann, U. (1999). Microvesicular steatosis, hemosiderosis and rapid development of liver cirrhosis in a patient with Pearson’s syndrome. J. Hepatol. 31, 550–555.
Lafuente-Lafuente, C., Alvarez, J. C., Leenhardt, A., Mouly, S., Extramiana, F., Caulin, C., Funck-Brentano, C., and Bergmann, J. F. (2009). Amiodarone concentrations in plasma and fat tissue during chronic treatment and related toxicity. Br. J. Clin. Pharmacol. 67, 511–519.
Lewis, J. H., Mullick, F., Ishak, K. G., Ranard, R. C., Ragsdale, B., Perse, R. M., Rusnock, E. J., Wolke, A., Benjamin, S. B., and Seeff, L. B. (1990). Histopathologic analysis of suspected amiodarone hepatotoxicity. Hum. Pathol. 21, 59–67.
Lewis, J. H., Ranard, R. C., Caruso, A., Jackson, L. K., Mullick, F., Ishak, K. G., Seeff, L. B., and Zimmerman, H. J. (1989). Amiodarone hepatotox-icity: Prevalence and clinicopathologic correlations among 104 patients. Hepatology 9, 679–685.
Liu, Y., Fiskum, G., and Schubert, D. (2002). Generation of reactive oxygen spe-cies by the mitochondrial electron transport chain. J. Neurochem. 80, 780–787. Mason, J. W. (1987). Amiodarone. N. Engl. J. Med. 316, 455–466.
Morse, R. M., Valenzuela, G. A., Greenwald, T. P., Eulie, P. J., Wesley, R. C., and McCallum, R. W. (1988). Amiodarone-induced liver toxicity. Ann. Intern. Med. 109, 838–840.
Mullen, P. J., Zahno, A., Lindinger, P., Maseneni, S., Felser, A., Krähenbühl, S., and Brecht, K. (2011). Susceptibility to simvastatin-induced toxicity is partly determined by mitochondrial respiration and phosphorylation state of Akt. Biochim. Biophys. Acta 1813, 2079–2087.
Patel, C., Yan, G. X., and Kowey, P. R. (2009). Dronedarone. Circulation 120, 636–644.
Rial, E., Rodríguez-Sánchez, L., Gallardo-Vara, E., Zaragoza, P., Moyano, E., and González-Barroso, M. M. (2010). Lipotoxicity, fatty acid uncoupling and mitochondrial carrier function. Biochim. Biophys. Acta 1797, 800–806.
Serviddio, G., Bellanti, F., Giudetti, A. M., Gnoni, G. V., Capitanio, N., Tamborra, R., Romano, A. D., Quinto, M., Blonda, M., Vendemiale, G., et al. (2011). Mitochondrial oxidative stress and respiratory chain dysfunction account for liver toxicity during amiodarone but not dronedarone adminis-tration. Free Radic. Biol. Med. 51, 2234–2242.
Simon, J. B., Manley, P. N., Brien, J. F., and Armstrong, P. W. (1984). Amiodarone hepatotoxicity simulating alcoholic liver disease. N. Engl. J. Med. 311, 167–172.
Singh, B. N., Connolly, S. J., Crijns, H. J., Roy, D., Kowey, P. R., Capucci, A., Radzik, D., Aliot, E. M., and Hohnloser, S. H. (2007). Dronedarone for maintenance of sinus rhythm in atrial fibrillation or flutter. N. Engl. J. Med. 357, 987–999.
Spaniol, M., Bracher, R., Ha, H. R., Follath, F., and Krähenbühl, S. (2001). Toxicity of amiodarone and amiodarone analogues on isolated rat liver mito-chondria. J. Hepatol. 35, 628–636.
Spaniol, M., Kaufmann, P., Beier, K., Wüthrich, J., Török, M., Scharnagl, H., März, W., and Krähenbühl, S. (2003). Mechanisms of liver steatosis in rats with systemic carnitine deficiency due to treatment with trimethylhydrazini-umpropionate. J. Lipid Res. 44, 144–153.
Stelfox, H. T., Ahmed, S. B., Fiskio, J., and Bates, D. W. (2004). Monitoring amiodarone’s toxicities: Recommendations, evidence, and clinical practice. Clin. Pharmacol. Ther. 75, 110–122.
Troy, C. M., and Shelanski, M. L. (1994). Down-regulation of copper/zinc superoxide dismutase causes apoptotic death in PC12 neuronal cells. Proc. Natl. Acad. Sci. U.S.A. 91, 6384–6387.
Waldhauser, K. M., Török, M., Ha, H. R., Thomet, U., Konrad, D., Brecht, K., Follath, F., and Krähenbühl, S. (2006). Hepatocellular toxicity and pharma-cological effect of amiodarone and amiodarone derivatives. J. Pharmacol. Exp. Ther. 319, 1413–1423.
Waterhouse, N. J., and Trapani, J. A. (2003). A new quantitative assay for cytochrome c release in apoptotic cells. Cell Death Differ. 10, 853–855. Wyss, P. A., Moor, M. J., and Bickel, M. H. (1990). Single-dose kinetics of
tissue distribution, excretion and metabolism of amiodarone in rats. J. Pharmacol. Exp. Ther. 254, 502–507.
Zahno, A., Brecht, K., Morand, R., Maseneni, S., Török, M., Lindinger, P. W., and Krähenbühl, S. (2011). The role of CYP3A4 in amiodarone-associated toxicity on HepG2 cells. Biochem. Pharmacol. 81, 432–441.