Printed in Great Britain
The International Pilot Study of Schizophrenia:
five-year follow-up findings
1
J. LEFF,2 N. SARTORIUS, A. JABLENSKY, A. KORTEN AND G. ERNBERG From the World Health Organization, Geneva, Switzerland
S Y N O P S I S A five-year follow-up of the patients initially included in the International Pilot Study of Schizophrenia was conducted in eight of the nine centres. Adequate information was obtained for 807 patients, representing 76% of the initial cohort. Clinical and social outcomes were significantly better for patients in Agra and Ibadan than for those in the centres in developed countries. In Cali, only social outcome was significantly better.
INTRODUCTION
The International Pilot Study of Schizophrenia (IPSS) is a transcultural psychiatric investigation of 1202 patients in nine countries - Colombia, Czechoslovakia, Denmark, India, Nigeria, China, Union of Soviet Socialist Republics, United Kingdom and the United States of America.
The IPSS sample was recruited from suc-cessive admissions or referrals to psychiatric facilities in the different centres and thus was not necessarily representative of the wider popu-lation of schizophrenic and other psychiatric patients in the community.
The first publication related to this study (WHO, 1973) presented a detailed account of the origins of the study as well as description of the place of the IPSS in the World Health Organization's long-term programme in epi-demiological and social psychiatry. The results of a two-year follow-up of the original cohort of patients were published in a second volume (WHO, 1979). The initial phase of the study, which occupied the period between April 1968 and September 1969, demonstrated the feasi-bility of a large-scale international collaborative study, which required the field workers involved
' This paper on the 5-year follow-up of patients included in the International Pilot Study of Schizophrenia of the WHO was prepared on behalf of the collaborating investigators (see Appendix).
2 Address for correspondence: Dr Norman Sartorius, Division of Mental Health World Health Organization, 1211 Geneva 27, Switzerland.
to apply standardized interviews in eight dif-ferent languages. Despite this linguistic diversity, satisfactory inter-rater reliability was achieved for the schedules used. It was discovered that patients with characteristic patterns of signs and symptoms, closely corresponding to descriptions of schizophrenia in the most widely used textbooks, were found in each of the settings. In seven of the nine centres, the diagnostic term schizophrenia was applied by the research psychiatrists to a group of patients whose clinical characteristics were very similar across these centres. In the two remaining centres, Washing-ton and Moscow, the psychiatrists included broader clinical groupings under the rubric of schizophrenia. This was confirmed by the use of a computer program, CATEGO (Wing et al. 1974), which functioned as a reference classifi-cation with which to compare the diagnostic practices in each of the centres. Agreement between the centres on a core group of patients diagnosed as schizophrenia was sufficient to justify comparison of the outcome of patients in
the various centres.
A two-year follow-up study of the original cohort was successfully completed although the proportion of patients with complete assess-ments was rather low in some of the centres, notably London and Ibadan. In London there were difficulties due to insufficient staff, while in Ibadan problems arose in tracing rural patients. Of the 1202 patients given an initial examination, it was possible to obtain sufficient information about 77 % to include them in the basic
132 J. Leff and others up analyses. In presenting the material, the
Agra, Cali and Ibadan centres will be referred to as centres in developing countries because of the prevailing socio-economic conditions in India, Colombia and Nigeria. Taipei has not been included as a centre in a developing country because the characteristics of medical care facilities and the principal causes of death in the city resemble those of a centre in a developed country. Aarhus, London, Moscow, Washing-ton and Prague are referred to as centres in developed countries.
Using this convention, the two-year follow-up data revealed that patients with an initial diagnosis of schizophrenia had a considerably better course and outcome in centres in devel-oping countries than in centres in developed countries (WHO, 1979). This remained true whether clinical outcome, social outcome, or a combination of the two was considered. A strikingly good outcome characterized schizo-phrenic patients in Agra, where over 90 % were followed-up, as well as in Ibadan, where the follow-up rate was 50%. The poorest outcome was evident in Aarhus, where a similar definition of schizophrenia was applied as in Agra and Ibadan. Hence neither the relative success of the follow-up, nor the diagnostic practices of the psychiatrists can account for the markedly better outcome for schizophrenia in the developing countries.
Another artefactual explanation for this find-ing cannot be excluded, namely that patients who chose to attend the sparse facilities in the centres in developing countries were selected, by themselves or relatives, on the basis of a good prognosis. The follow-up data, as yet unpub-lished, from the WHO Determinants of Outcome study (Sartorius et al. 1986) provide evidence against this possibility, since they relate to a strict epidemiological sample making a first contact with psychiatric facilities, yet still dem-onstrate a better outcome for schizophrenic patients in developing countries.
We present here the findings from the five-year follow-up of the IPSS, which not only confirm the two-year results, but amplify them, since a more complete follow-up was achieved in some of the centres. The centre in Taipei ceased participating in the IPSS before the five-year follow-up study was completed so that data from that centre are not included in this paper.
METHOD Instruments
Four main types of schedule were used during the follow-up phase of the IPSS: the Present State Examination (PSE), the Follow-up Psy-chiatric History schedule (FUPH), the Follow-up Social Descriptions schedule (FUSD) and the Follow-up Diagnostic Assessment schedule (FUDA). The PSE was originally devised by Wing et al. (1974) and was translated from English into the seven other languages of the IPSS with the usual precautions (WHO, 1973). The development of the other three schedules is described in the second IPSS publication (WHO, 1979). The main purposes of the five-year FUPH were to collect information on the course of the patient's illness in the interval between initial examination and the five-year follow-up, and to provide an account of any socioeconomic changes affecting the patient during the same period. The FUDA schedule requires the psy-chiatrist assessing the patient at follow-up to state his diagnosis of the patient using follow-up information only, and to reformulate the diagnosis using all the information available. In addition to interviews with the patient, in-formation was obtained from family members, health records and health professionals. Reliability of instruments
This was established for the instruments used for initial assessment and for the follow-up schedules by interviews being regularly rated by a number of research workers, both within centres and between centres. Various measures of reliability of rating were presented for the two-year follow-up data (WHO, 1979). With respect to the PSE, the intracentre reliability was extremely high for all 129 units of analysis derived from the PSE items (intraclass cor-relation coefficient, agreement ratio 087). The intercentre reliability was about 5 % lower than in the intracentre exercises, but still very satisfactory.
For the various measures of course and outcome, with the exception of social outcome, the inter-rater agreement ranged from 0-58 to 0-75. When social outcome was analysed as a trichotomous variable, low levels of reliability resulted. Therefore the categories were collapsed into 'severe impairment' and 'all other
out-Table 1. Number of patients in each centre with a PSE at five-year follow-up Not followed up Followed up but no PSE PSE within 6 months of 5 yr follow up PSE more than 6 months after 5 yr follow up Totals Aarhus N (%) 8(6) 4(3) 113(87) 5(4) 130 Agra N (%) 37 (26) 6(4) 88 (63) 9(6) 140 Cali N (%) 10(8) 10(8) 102 (80) 5(4) 127 Ibadan N (%) 59(41) 2(1) 53 (37) 31(21) 145 London N (%) 45 (35) 1(1) 55 (43) 26 (20) 127 Moscow N (%) 20(14) 0(0) 48 (34) 72(51) 140 Praque N (%) 17(14) 3(2) 98 (78) 7(6) 125 Washington N (%) 62 (47) 0(0) 67(51) 2(2) 131 All centres N (%) 258 (24) 26(2) 624 (59) 157(15) 1065
Table 2. Distribution of all patients assessed at five-year follow-up by ICD diagnosis and centre
ICD diagnosis 44 = Puerperal psychosis 01 — Simple schizophrenia 02 = Hebephrenic schizophrenia 03 — Catatonic schizophrenia 04 = Paranoid schizophrenia 05 — Acute schizophrenia 06 = Latent schizophrenia 07 — Residual schizophrenia 08 = Schizo-affective 09 — Other schizophrenia 10 = Unspecified schizophrenia 11 — Agitated depression 12 = Manic-depressive depression 13 — Manic-depressive manic 14 — Other affective disorder 15 = Paranoid slates 16 — Other psychoses 17 = Reactive depression 18 = Unspecified psychosis 19 — Depressive neurosis 20 = Other neurosis personality disorders All Percentage of Initial cohort Aarhus 2 6 11 2 26 — 3 — 1 1 — 1 17 19 4 9 1 13 2 2 2 122 94 Agra 2 — 15 11 8 — — 14 3 20 3 3 16 — — — — 6 2 103 74 Cali 1 19 12 17 27 3 — 7 6 — 1 1 3 — 1 2 — 5 12 117 92 Ibadan 1 8 6 28 4 — — 15 2 5 — 5 2 1 1 5 1 — 2 — 86 59 London 2 7 3 44 — — 1 7 — — — 4 3 3 — — — — 8 — 82 65 Moscow 1 — — — 12 11 11 — 4 28 — — 9 1 1 6 5 — 8 23 120 86 Praque 5 3 — 30 4 2 2 15 3 1 — 18 7 — 8 1 3 — 6 — 108 86 Washington 3 — — 33 6 2 — 6 2 — — 1 1 2 1 — — 8 4 69 53 All centres 3 20 48 38 201 60 21 3 69 45 26 5 58 52 11 18 15 24 2 45 43 807 76
comes', which resulted in inter-rater agreement of 0-75.
The checks on inter-rater reliability of the schedules continued between the two-year and five-year follow-ups, but analyses of the data are not available. While it is possible that rater drift occurred over the long follow-up period of this study, there is no reason why this should have produced a systematic bias affecting the as-sessment of outcome in one centre differently from the others.
Completeness of follow-up
The absence of the Taipei centre from the five-year follow-up removed 137 patients from the initial cohort of 1202, leaving 1065 to be followed-up in the remaining eight centres.
From Table 1 it can be seen that 59% of patients were examined with the PSE within six months either side of the five-year follow-up point. No patient was seen earlier than the limit, but 15 % were interviewed more than five and a
134 J. Leff and others
Table 3 (a). Distribution of Centre diagnoses in
original cohort and five-year follow-up sample
Schizophrenia Mania Other Table 3(6). patients CATEGO class s + S, P, O Other Original N 727 64 274 cohort % 683 60 25-7 Follow-up N 531 52 224 sample % 65-8 6-4 27-8
Distribution of CA TEGO classes in given diagnosis of schizophrenia
Original N 443 581 146 cohort % 60-9 79-9 201 Follow-up N 323 421 110
Table 3(c). Sex distribution of original
and five-year follow-up sample
Original N cohort % Follow-up N sample % 60-8 79-3 20-7 cohort sample % Centre schizophrenia Female 357 Male 370 All diagnoses 491 50-9 261 270 491 50-9 Female Male Table 582 54-6 483 45-4 443 364
3(d). Age distribution of original and five-year follow-up sample
Original cohort N % Follow-up N 54-9 451 cohort sample % Centre schizophrenia Age < 30 430 59-2 312 58-8 Age > 30 296 40-8 219 41-2 All diagnoses Age < 30 573 53-9 425 52-7 A g e ) 30 491 46-1 382 47-3
half years after the initial examination. The longest duration of follow-up, recorded for a single patient, was seven years and three months. In all, 74% of the original cohort were given a PSE at the five-year folow-up, a creditable success rate and very similar to the 76% reinterviewed at the two-year follow-up.
Table 3(e). Marital status of original cohort
and five-year follow-up sample
Centre schizophrenia Married or cohabiting Single/widowed/ divorced All diagnoses Married or cohabiting Single/widowed/ divorced Original N 298 427 508 555 cohort <y 411 58-9 47-8 52-2 Follow N 210 320 383 423 -up sample % 39-6 60-4 47-5 52-5
Table 3(f). Type of onset of original cohort and
five-year follow-up sample
Original cohort N % Follow-up sample N % Centre schizophrenia Sudden 99 13-6 Slow/insidious 623 85-7 All diagnoses Sudden 158 14-8 Slow/insidious 897 84-2 72 457 119 683 13-6 861 14-8 84-6
In addition to the patients assessed with all the instruments including the PSE, for another 26 individuals information was obtained by using only the FUPH and FUSD schedules. Thus, sufficient information to characterize outcome over five years was obtained for a total of 807 patients, representing 76% of the initial cohort.
A frequent reason for not tracing or not assessing patients at the five-year folow-up was death. A total of 52 patients, or 4-9% of the original cohort, died during the follow-up period. There may have been additional deaths among patients who were not traced. Suicide (ascertained and suspected) was the commonest cause of death among the study patients, accounting for 38 % of all known deaths. It is well-established that the suicide risk in schizo-phrenia is as high as in affective illnesses (e.g. Tsuang et al. 1979) and this is borne out in the IPSS. In two of the centres (Ibadan and Agra) the percentage of patients who died was 9-0 and 71 respectively. The centre with the lowest
percentage of deaths (0-8) was surprisingly not in a developed country but in Cali.
Of the 807 patients satisfactorily assessed at five-year follow-up 531 (65-8%) had an initial centre diagnosis of schizophrenia and 126 (156%) a diagnosis of an affective psychosis. Among the 1065 patients originally assessed, excluding the patients from the Taipei centre, a diagnosis of schizophrenia was given to 727 (68-3%) and of affective psychosis to 154 (14-5%). These figures suggest that successful follow-up is not influenced by initial diagnosis. The initial diagnostic distribution of these 807 patients is shown for each centre in Table 2. The striking variation in distribution between centres is likely to be due to a combination of selection factors and, in the case of the subtypes of schizophrenia, differences in diagnostic prac-tices. However, the high proportion of catatonic schizophrenia in Agra, Cali and Ibadan reflects a genuine difference in the prevalence of this subtype between developing and developed countries (Leff, 1988). It can be seen from Table 2 that sufficient outcome data were obtained from a low of 5 3 % of the initial cohort in Washington to a high of 94% in Aarhus. It is reassuring that in one of the centres in a developing country, Cali, the success rate in obtaining follow-up data was over 90%.
Potential bias introduced by incomplete follow-up
Since patients lost to follow-up may bias the remainder of the sample either towards a better or a worse outcome, it is necessary to compare the patients successfully followed up with the original cohort. In particular such a comparison must include factors commonly associated with the prognosis of the major psychiatric illnesses. Age, sex and marital status are almost invariably identified as influencing the outcome of the whole range of psychiatric conditions, while type of onset is particularly important in schizophrenia. Tables 3 (a-f) show the com-parison of the five-year follow-up sample with members of the original cohort on all those variables, as well as on the distributions of Centre diagnoses (made by the research psychi-atrists in each centre) and CATEGO diagnoses (made by the computer program). In each instance the value of the variable was that determined at initial interview.
In none of these comparisons did the sample followed-up differ significantly from the original cohort. In fact for most of the variables, the distributions are virtually identical. These results eliminate one interpretation of the findings. RESULTS
Clinical course and outcome of patients with an initial diagnosis of schizophrenia
The IPSS was deliberately focused on schizo-phrenia, and we will present outcome data mainly for this group. However, comparisons will also be made with other diagnostic groups.
PSE at five-year follow-up
The PSE covers one month preceding the interview. When given at a follow-up of a cohort of schizophrenic patients, it will only record active symptoms over that period. Usually a high proportion of patients are in a quiescent phase. However, those with chronic symptoms and those who happen to be in an acute episode at the time will be identified by a PSE assessment. Some patients suffer from neurotic symptoms when not in a psychotic phase, and these have been included in Fig. 1. Patients have been divided into those who at five-year follow-up had at least one clearly psychotic or three possibly psychotic symptoms; those who were symptomatic but did not fulfil these criteria and those with no symptoms recorded by the PSE. Chi-square analysis indicates that the differences among the centres are statistically significant
(P < 0001). The highest proportion of
asympto-matic patients was found in both Agra and Ibadan, amounting to two-thirds of the sample seen at follow-up. The highest proportion of actively psychotic patients (nearly 60%) was shown by the samples from Aarhus and Moscow, which also had the lowest proportion of asymptomatic patients (under 5%).
Time spent in a psychotic episode
The cross-sectional data from the PSE at the five-year follow-up need to be supplemented by information of a more longitudinal nature. The follow-up psychiatric histories provide this type of data, and were used to estimate the percentage of the follow-up period that each patient spent in a psychotic episode. A psychotic episode was one which the psychiatrists completing the
136 J. Lejf and others
FIG. 1. Percentage of followed up initial evaluation schizophrenic patients, psychotic, non-psychotic and asymptomatic at five-year follow-up. 0 , Psychotic; • . non-psychotic; Q , asymptomatic, x2 ~ 168-2; df 14; P < 0001.
Table 4. Distribution of schizophrenic patients assessed at five-year follow-up by percentage of
time spent in a psychotic episode
Aarhus Agra Cali Ibadan London Moscow Prague Washington All centres 0-5 N ( | | 30 38 36 16 24 14 23 192 :%) 22 41 41 52 25 36 22 44 36 6-15 N 5 18 20 16 13 15 16 9 112 (%) 10 25 22 23 20 23 25 17 21 Time psychotic ( 16-45 N ( 7 9 8 4 16 8 12 4 68 %) 14 12 9 6 25 12 19 8 13 %) 46-75 N 8 4 5 3 4 3 5 1 33 (%) 16 5 5 4 6 5 8 2 6 76-100 N 19 11 19 9 14 15 17 13 117 (%) 38 15 21 13 22 23 26 25 22 Not Known N 0 1 2 1 1 1 1 2 9 (%> 1 2 1 2 2 2 4 2
Kruskal-Wallis test (not known excluded); x' = 317, df 7, P < 00001.
follow-up schedules considered to be definitely schizophrenic, probably schizophrenic, an affective psychosis, or 'another psychosis'. Usually episodes classified as psychotic were characterized by hallucinations and/or delu-sions. The results are presented in Table 4, which shows that, for all centres together, over one third of patients initially diagnosed as having schizophrenia spent less than 5 % of the five year follow-up period in a psychotic episode, while about a fifth were in a psychotic episode for more than 75 % of the time.
A Kruskal-Wallis test indicates that the centres differ significantly with regard to the distribution of patients into the five groups (P < 00001). Inspection of the Table reveals that the greatest variation occurs in the first and fifth columns. The centres with the highest proportion of patients spending 5% or less of time in a psychotic episode are Agra, Cali, Ibadan and Washington. Agra and Ibadan also have the smallest proportion of patients spending more than three-quarters of the period in a psychotic episode.
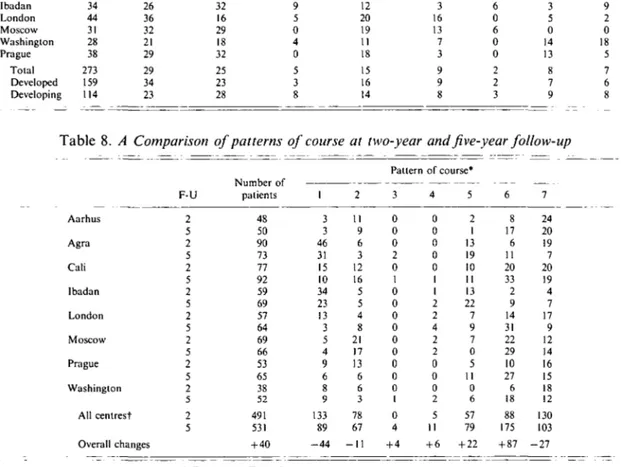
Table 5. Distribution of schizophrenic patients assessed at five-year follow-up by pattern of course 1 N ",'o N 2 V N 3 Pattern of course 4 % N % N 5 % 6 V N 1 % Aarhus Agra Cali Ibadan London Moscow Prague Washington All centres 3 31 10 23 3 4 6 9 89 6 42 11 33 5 6 9 17 17 9 3 16 5 8 17 6 3 67 18 4 17 7 13 26 9 6 13 0 2 1 0 0 0 0 1 4 3 1 —-— — — 2 1 0 0 1 2 4 2 0 2 — 1 3 6 3 — 4 2 1 19 11 22 9 0 11 6 79 2 26 12 32 14 — 17 12 15 17 11 33 9 31 29 27 18 175 34 15 36 13 48 44 42 35 33 20 7 19 7 9 14 15 12 103 40 10 21 10 14 21 23 23 19
Pattern of course: 1, full remission of episode of inclusion, no further episodes; 2, partial remission, no further episodes; 3, at least one non-psychotic episode after episode of inclusion, full remission between all episodes; 4, at least one non-non-psychotic episode after episode of inclusion, incomplete remission between episodes; 5, at least one subsequent psychotic episode, full remission between episodes; 6, at least one subsequent psychotic episode, incomplete remission between episodes; 7, episode of inclusion continues throughout follow-up period without remission.
Pattern of course
The percentage of the follow-up period spent in a psychotic episode showed significant variation between centres. However, it does not distinguish between patients who experience one prolonged episode and those who suffer several short-lived episodes. This distinction can be made by treating the information from the follow-up psychiatric histories in a different way. Seven patterns of course (POC) were delineated as detailed in Table 5. In view of the small numbers in some cells the columns were combinaed as follows for analysis: 1+2 + 3, 4 + 5, 6 + 7. The distribution of patients according to the POCs differed significantly between centres (x2 = 83, df 14, P< 00001).
Very few patients from any centre show POC 3 and 4, indicating the rarity of non-psychotic episodes occurring in isolation from psychotic episodes. POC 1, representing the best outcome, shows the most striking variation between centres, with Agra and Ibadan standing out from the rest as having an exceptionally high percentage of patients in this category. Conv-ersely, these two centres have strikingly low proportions of patients with POC 6 and 7, representing the worst outcomes. No other centre has less than one-third of its patients showing POC 6, but London has a surprisingly small proportion of patients who never reco-vered from the episode of inclusion, and resem-bles Agra and Ibadan in this respect. Although
Cali has been grouped with the centres in developing countries, the pattern of course shown by its sample of schizophrenic patients closely resembles that of samples from centres in developed countries. Among the latter, Aarhus is conspicuous for a particularly poor outcome, nearly 4 0 % of its patients being continuously psychotic for the whole 5-year follow-up.
These various approaches to categorizing the clinical outcome over 5 years of the schizo-phrenic patients in the IPSS consistently indicate that the patients from Agra and Ibadan fared best while those from Aarhus had the worst outcome.
Social outcome of patients with an initial diagnosis of schizophrenia
The data in the follow-up schedules were used to make a global assessment of the degree of social impairment suffered by each patient during the follow-up period. The assessment was based on the patients' occupational adjustment, relation-ship with friends, and degree of social inter-action. Experience with analysis of the two-year follow-up data indicated that acceptable inter-rater reliability was achieved when patients were divided into two groups, those with severe social impairment and those without severe impair-ment. The five-year follow-up data analysed in this manner are displayed in Table 6. The differences between the Centres are highly significant ( P < 0-001).
138 J. Leff and others
Table 6. Social impairment of schizophrenic
patients assessed at five-year follow-up
Severe social impairment Moderate, mild or no social impairment Aarhus Agra Cali Ibadan London Moscow Prague Washington All centres N 25 9 15 13 17 15 19 13 126 % 50 13 17 19 27 23 30 25 24 N 25 62 73 55 47 51 45 39 398 % 50 87 83 81 73 77 70 75 76 / = 28-12, df7, P < 0-001.
severe social impairment are found in the three centres in developing countries, Agra, Cali and Ibadan, while the largest proportion is shown by Aarhus. These findings closely parallel the clinical outcome data. Indeed Spearman's rank order correlation between severe social impair-ment and the worst clinical outcome (column 7, Table 5) is 0-76. However, it is worth noting that although Cali has twice the proportion of the worst clinical outcome patients as Agra and Ibadan, the percentage with severe social im-pairment is of the same order as in the other two developing centres. This same pattern charac-terized the Cali patients at the two-year follow-up.
In all centres the majority of patient with schizophrenia did not suffer severe impairment of their social functioning.
Types of subsequent episodes in patients with an initial diagnosis of schizophrenia
A long follow-up makes it possible to determine the consistency of the initial diagnosis over time. The key question is whether subsequent episodes of psychiatric illness conform to the episode of inclusion in terms of diagnosis. On the basis of the follow-up history data, episodes during the follow-up period were classified as definitely schizophrenic, probably schizophrenic, affective psychosis, other psychoses, and non-psychotic. These judgements were based on the WHO/ ICD-8 glossary criteria. Table 7 shows the percentage distribution by clinical type of sub-sequent episodes of patients with an initial diagnosis of schizophrenia.
The pattern of distribution for developed and developing countries is very similar, although definite schizophrenic episodes preponderate in the former, and possible schizophrenic episodes in the latter. In the sample as a whole 59% of schizophrenic patients with subsequent episodes received definite and/or probable schizophrenic diagnoses for those episodes. The comparable figure for the two-year follow-up was 76 % This difference is not due to an increase in the percentage of patients with only subsequent affective psychotic episodes in the longer follow-up, since the figures are 16% in the two-year follow-up and 15% in the five-year follow-up. Rather it is attributable to patients who suffered episodes of mixed schizophrenic and affective, and mixed schizophrenic and unknown diag-noses, who constituted 17% of the patients in Table 8. The category of unknown diagnosis does not appear in the two-year follow-up analysis, presumably reflecting the difficulty in obtaining clinical information in the longer follow-up.
The distribution for individual centres appears generally similar, except for Aarhus, which shows a strikingly high proportion of only definite schizophrenic episodes, and no patients with only subsequent affective psychotic episodes.
Comparison between findings at two-year and at five-year follow-up
It is instructive to compare the findings for outcome at the two-year and five-year follow-ups, to determine whether the pattern of course changed substantially over the additional three years. The results of this comparison for the seven patterns of clinical course are shown in Table 8.
There was an overall gain of 40 patients in the second follow-up. This introduces an ambiguity into the interpretation of any changes observed, since gains in any column may be due to an alteration in the pattern of course of patients seen at the two-year follow-up or to the acquisition of patients followed up for the first time at five years. Nevertheless, the differences in pattern between the two follow-ups are sufficiently uniform across centres to merit comment. Indeed, identical changes are apparent in the developing centres as in the developed centres, and in centres like Agra and Moscow,
Table 7. Percentage distribution of schizophrenic patients by clinical type of subsequent episodes Aarhus Agra Call Ibadan London Moscow Washington Prague Total Developed Developinj No of patients 18 32 48 34 44 31 28 38 273 159 > 114 Table 8. Aarhus Agra Cali Ibadan London Moscow Prague Only definite schizophrenic 61 22 21 26 36 32 21 29 29 34 23 Only Definite and possible possible schizophrenic schizophrenic A Comparison I Washington All centrest Overall changes --U 2 5 2 5 2 5 2 5 2 5 2 5 2 5 2 5 2 5 17 34 21 32 16 29 18 32 25 23 28 of patterns patients 48 50 90 73 77 92 59 69 57 64 69 66 53 65 38 52 491 531 + 40 11 6 8 9 5 0 4 0 5 3 8 of course l 3 3 46 31 15 10 34 23 13 3 5 4 9 6 8 9 133 89 - 4 4 Affective (definite and/or possible) 0 22 10 12 20 19 11 18 15 16 14 Schizophrenic and affective at two-year 2 11 9 6 3 12 16 5 5 4 8 21 17 13 6 6 3 78 67 - 1 1 Pattern 3 0 0 0 2 0 1 0 0 0 0 0 0 0 0 0 1 0 4 + 4 6 12 8 3 16 13 7 3 9 9 8 Other Unknown and episodes schizophrenic 6 0 2 6 0 6 0 0 2 2 3 0 3 17 3 5 0 14 13 8 7 9
and five-year follow-up
of course* 4 0 0 0 0 0 1 1 2 2 4 2 2 0 0 0 2 5 11 + 6 5 2 1 13 19 10 11 13 22 7 9 7 0 5 II 0 6 57 79 + 22 6 8 17 6 11 20 33 2 9 14 31 22 29 10 27 6 18 88 175 + 87 7 24 20 19 7 20 19 4 7 17 9 12 14 16 15 18 12 130 103 - 2 7 Unknown mixed unknown and affective 0 0 12 9 2 0 18 5 7 6 8
• For key see Table 5.
t / = 48-8, df 5, P < 0-0001 (columns 3 and 4 combined).
which lost patients between the two follow-ups, as well as in all the other centres, which gained patients. In view of this uniformity, and in the interests of clarity, we will concentrate on the findings for all centres combined (bottom 3 rows of Table 8), which demonstrate a significant difference between the two follow-ups (P < 00001).
Analysis of the differences between columns reveals the unsurprising fact that some patients who remain well for two years after an episode of schizophrenia, have subsequent attacks from which they make a good recovery. More
noteworthy, it indicates the possibility of some clinical improvement over time in patients whose illness has pursued an unremitting course for two years. The overall loss of 27 patients from column 7 might be attributable to failure to follow them up, except that centres like London and Washington contacted more patients at five years than at two years but still showed a reduction in the number of patients with the worst outcome. In addition, a trend emerges that is important for epidemiological studies: as schizophrenic patients are followed up over longer periods of time, those who recover
140 J. Leff and others completely tend to be lost to the study, while
others with a relatively poor outcome are retained.
Predictors of outcome
It is evident from the foregoing analyses that both clinical and social outcome for this cohort of schizophrenic patients were better for the developing than the developed countries. Pre-vious research has consistently identified other predictors of outcome, such as sex, marital status, pre-morbid personality and type of onset, as being important in schizophrenia. It is possible that differences between patients from devel-oping and developed countries with respect to these factors could account for the superior outcome of the former.
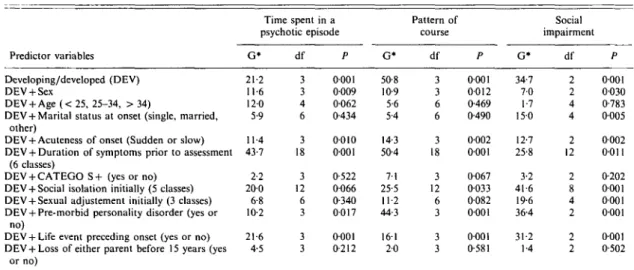
To test these possibilities, a series of analyses were conducted where outcome variables were modelled to be dependent on the values of the developed/developing dichotomy as well as a number of other predictor variables. Log-linear models were used, where the logarithm of the odds of a particular outcome is expressed as a linear combination of the predictors. This model is sometimes referred to as the log-odds model or, especially where the predictors are con-tinuous, the logistic regression model. Analyses were made using the procedure CATMOD from SAS version 5-18, which provides a general-ization to handle more than two classes of outcome variables. Maximum likelihood esti-mation was used. The size of the log-likelihood statistic, —2 log L, indicates the goodness-of-fit of the model. It is distributed as a x2 statistic with degrees of freedom dependent on the number of categories of the independent vari-ables included. The contribution of each in-dependent variable to the model may be repre-sented by its corresponding contribution to the value of —2 log L.
The outcome variables against which the models were tested were the time spent in psychotic episode (4 classes: < 5 % ; 5-14%; 15-94 %; 95-100 %), pattern of course (4 classes: 1; 2-5; 6; 7) and social impairment (3 classes: none; mild or moderate; severe). Results are summarized in Table 9.
The first factor to be entered into the model was whether a patient came from a centre in a developed or developing country. This is highly significant as a predictor of each of the outcome
variables, the probability of better outcomes being significantly greater in developing coun-tries. Other variables were also included in the model, one at a time, together with the first factor. None explains anywhere near the same variance as does the developed/developing dichotomy. There are significant associations however. Male patients are more likely than female patients to have a poor outcome on all three measures. Current age is not associated with outcome. Being married at initial exam-ination means a higher probability of good social functioning, but is not associated with clinical outcome. Subjects who had sudden onset (overnight or a few hours) or those whose symptoms were comparatively recent were less likely to have poor outcomes. Having a symptom profile corresponding to CATEGO S + was not associated with either social functioning or the length of time in psychotic episodes, but was associated with a significantly lower probability of a good pattern of course. Social isolation at initial examination was associated with poor social and clinical outcomes, while poor pre-morbid sexual adjustment affected social func-tioning only. A history of pre-morbid personality disorder was associated with poor outcomes on all three variables, unlike the experiences of negative life events prior to illness, which were associated with better clinical and social out-comes.
Thus, while clinical predictors affect clinical outcome and social predictors influence social outcome, there is also some cross-over; for example, a slow onset predicts social impairment at follow-up, and initial social isolation predicts a poor pattern of course.
In addition to the predictors listed in Table 9, the relationship between subgroups of schizo-phrenia, derived from the ICD categories, and outcome was examined. It was found that acute schizophrenia (295.4) and schizoaffective schizo-phrenia (295.7) were both associated with signifi-cantly better clinical and social outcomes than the other sub-groups. This is probably attribu-table to the influence of acuteness of onset and life events before onset on the outcome variables, (see Table 9).
Another predictor of outcome that was studied was first contact with psychiatric services. Many studies have shown that patients with schizophrenia making a first contact have a
Table 9. Log-linear modelling of the relationship of predictor variables to three indices of outcome Predictor variables Developing/developed (DEV) DEV + Sex DEV + Age ( < 25, 25-34, > 34)
DEV + Marital status at onset (single, married, other)
DEV 4- Acuteness of onset (Sudden or slow) DEV + Duration of symptoms prior to assessment
(6 classes)
DEV + CATEGO S + (yes or no) DEV + Social isolation initially (5 classes) DEV + Sexual adjustement initially (3 classes) DEV + Pre-morbid personality disorder (yes or
no)
DEV + Life event preceding onset (yes or no) DEV + Loss of either parent before 15 years (yes
or no) Time spent in a psychotic episode G* 21-2 11-6 120 5-9 11-4 43-7 2-2 200 6-8 10-2 21-6 4-5 df 3 3 4 6 3 18 3 12 6 3 3 3 P 0001 0009 0-062 0-434 0010 0-001 0-522 0066 0-340 0017 0001 0-212 G* 50-8 10-9 5-6 5-4 14-3 50-4 71 25-5 11-2 44-3 16-1 20 Pattern of course df 3 3 6 6 3 18 3 12 6 3 3 3 P 0001 0012 0-469 0-490 0-002 0001 0067 0033 0082 0001 0001 0-581 G* 34-7 70 1-7 150 12-7 25-8 3-2 41 6 19-6 36-4 31-2 1-4 Social impairment df 2 2 4 4 2 12 2 8 4 2 2 2 P 0001 0030 0-783 0005 0002 0011 0-202 0001 0001 0001 0001 0-502
* G is the resultant change in —2 log L where extra variables are added to the model, distributed as ^ with degrees of freedom shown. The first line shows the changes in —2 log L due to DEV alone.
The subsequent lines show the change in —2 log L due to the addition of each predictor with DEV.
Table 10. Patterns of course in patients with schizophrenia from all centres combined compared
with those in patients with mania and psychotic depression
Pattern of course* Schizophrenia Mania + psychotic depression N 531 130 N 89 29 % 17 22 N 67 22 13 19 N 4 6 1 5 N 11 6 % 2 5 N 79 26 % 15 20 N 175 36 % 33 28 N 103 5 % 19 4
For key see Table 5. = 34-13, df6, P < 0-001.
significantly better outcome than patients estab-lishing subsequent contacts. In this cohort a much higher proportion of schizophrenic patients in developing centres were making their first contact with the services (83%) than in developed centres (38%). Linear logistic mod-elling was applied and showed that when the effect of first contact on pattern of course was taken into account, there was still a highly significant effect of the developing/developed dichotomy (x2 = '8-86, df 2, P < 0005).
A number of other analyses was conducted using more than two predictors at a time, in order to get an idea of the extent to which predictors have an independent influence on outcome. It emerged that the developing/ developed dichotomy and acuteness of onset
were significant no matter which other variables were added into the analysis, implying that each of these two predictors exerts an independent influence on outcome.
The most important conclusion from this series of analyses is that when the effects of all other significant predictors are taken into ac-count, the powerful influence of the developing/ developed dichotomy on all three outcome variables remains. This indicates that the superior five-year outcome of schizophrenic patients in developing countries is not explained by the set of predictor variables tested in the modelling procedures. These were chosen be-cause their predictive value for the outcome of schizophrenia had been established by many previous studies. It is evident that the
expla-142 J. Leff and others
Table 11. Social impairment of patients with
schizophrenia from all centres combined compared with that of patients with mania and psychotic depression Severe social impairment Moderate, mild or no social impairment N Schizophrenia Mania + psychotic depression 531 130 126 24 6 398 121 76 94
x" with Yates' correction = 1913, d f l . P < 0-001.
nation for the better outcome in developing countries needs to be sought elsewhere. Comparison of course and outcome between schizophrenic patients and other diagnostic groups
Kraepelin's original distinction between schizo-phrenia and manic-depressive psychosis was partly based on the worse outcome of the former, which was one of the reasons that prompted him to employ the term dementia
praecox. Many subsequent studies have
con-firmed this difference in outcome, and it was considered worth exploring with the five-year follow-up data. In addition to the 531 patients with a diagnosis of schizophrenia, 130 with diagnoses of mania and psychotic depression were successfully followed up. The patterns of course of these two diagnostic groups are compared in Table 10.
As expected, patients with affective psychosis have a significantly better outcome in terms of pattern of course than patients with schizo-phrenia. There is a shift across all columns towards lesser morbidity for manic-depressive patients, but the greatest difference appears for POC 7, unremitting symptoms throughout the follow-up period.
Social impairment is displayed in Table 11 and also demonstrates a significantly better outcome for patients with affective psychosis.
The influence of the developing/developed country dichotomy on the outcome variables was examined for non-schizophrenic patients in order to determine whether it was diagnostically specific. In this analysis, patients with diagnoses of neurosis and personality disorder were
in-cluded as well as those with affective psychosis in order to boost the numbers. It was found that patients with non-schizophrenic diagnoses from developing and developed countries had signifi-cantly different patterns of course (/* < 001) and social outcomes (/* < 0001), but that percentage of time spent in a psychotic episode was not significantly different.
DISCUSSION
A five-year follow-up was successfully carried out on 76 % of the original cohort of patients. There was a selective loss of patients with schizophrenia from the follow-up, but within this diagnostic group those who were lost did not introduce a significant bias with respect to any of the variables that are known to influence outcome. In terms of clinical outcome, measured by symptomatic status at time of follow-up, time spent in a psychotic episode and pattern of course, schizophrenic patients from Agra and Ibadan did conspicuously better than those from the other six centres. An exceptionally good social outcome also characterized these patients, and additionally the patients from Cali. This resulted despite the fact that Cali had double the proportion of patients with the worst pattern of course as those in Agra and Ibadan. This may be explained by a much greater tolerance and acceptance of symptomatic schizo-phrenic patients in Cali than there is in developed countries. Supportive evidence for this is pro-vided by a survey of public attitudes to the mentally ill in Cali (Leon & Micklin, 1971) and by a study of relatives' attitudes to schizophrenic patients in Mexican-American families (Jenkins
et al. 1986).
Comparison of the two-year and five-year follow-up data suggested that some schizo-phrenic patients who remained continuously psychotic for two years underwent some im-provement in subsequent years. It also indicated that over time there was a differential loss from the cohort of those who recovered completely from the initial episode.
A number of factors was found to predict either clinical or social outcome or both, including sex, marital status, acuteness of onset, first contact with services, duration of symptoms before contact, a CATEGO class of S + , initial social isolation and sexual adjustment, a poor
pre-morbid personality and the occurrence of a life event before onset. These are all familiar from previous studies, but none of them ex-plained the good outcome of patients in devel-oping countries. This finding is identical with that from the two-year follow-up (WHO, 1979), and could be ascribed to a differential self-selection of patients attending scarce medical facilities in developing countries compared with the situation in developed countries. This ex-planation has been rendered implausible by the congruent findings of the Determinants of Outcome Study (Sartorius el al. 1986) in which the samples of patients were epidemiologically based.
The five-year follow-up data from the IPSS need to be put in the context of other long-term follow-up studies of schizophrenia. Studies in developed countries will be considered first, followed by those in developing countries. There has been a large number of relevant studies in developed countries, incurring the usual dis-advantage of a great variety of methods of selection of patients, assessment and categor-ization of course and outcome. Stephens (1978) reviewed 38 studies involving a long-term follow-up of schizophrenic patients. Of these 13 are of most immediate relevance to our design, since the follow-up was at least five years but averaged less than ten. Stephens classified outcome as ' recovered'-complete recovery without evi-dence of residual pathology; 'unimproved'-active chronic psychosis; and 'improved' — either the subject has residual symptoms at time of follow-up or appears recovered, but has had repeated exacerbations and hospitalizations since entering the study. The category 'recovered' corresponds to our Pattern of Course 1, while that of 'unimproved' is very similar to our Patterns of Course 6 and 7 combined. In the 13 studies reviewed by Stephens, the proportion of' recovered' patients varied from 6 to 39%, this wide range almost certainly reflecting methodological differences. The average was 2 1 % , more than double the mean of 9 % for developed countries showing Pattern of Course 1 in our study (Table 5). However if Patterns of Course 1 and 2 are combined, the mean for developed countries rises to 23 %. This figure, which is very similar to that derived from Stephens' review, includes patients who have had a full or partial remission
of the episode of inclusion, with no further episodes. Stephens' figures for 'unimproved' patients range from 4 to 84% with a mean of 52%. The corresponding figures for developed countries in our study are 58 to 74% with a mean of 6 5 % . The much narrower range is almost certainly due to standardization of methodology in the IPSS. Since Stephens' review, a five-year follow-up study has been published (Watt el al. 1983) which is of particular relevance since the patients were examined with the PSE. A feature of the study which added to its rigor, but renders it less comparable with the IPSS, is that the sample of patients was epidemiologically based. The proportion of patients with a single episode and no impairment was 16%, while the proportion with repeated episodes and no return to normality was 52%. These figures indicate a rather better outcome than the corresponding data for the London centre (POC 1,5%; POC 6 + 7, 62%) and may be attributable to the nature of the catchment area, which was semi-rural with little socio-economic deprivation.
In a more extensive presentation of their findings, Shepherd et al. (1989) analysed the relationship between clinical outcome and social outcome. This was found to be approximately linear, with 2 5 % of the variation in overall social adjustment being attributable to clinical status at follow-up. In no case with severe global social impairment was clinical status unim-paired, but in a small number of patients social function was unimpaired in the presence of severe clinical morbidity. Shepherd et al. suggest that the good social outcome of these patients may be a consequence of family support and the fact that they were able to stay in employment. This speculation may be relevant to the findings for the Cali patients.
Extensive comparisons of the IPSS data with very long-term follow-up studies (Bleuler, 1972; Huber et al. 1975; Tsuang et al. 1979; Ciompi, 1980; Harding et al. 1987) are not productive because of differences in method and the suggestion from these studies that a progressive improvement occurs in schizophrenia over several decades.
To turn to studies in developing countries, one of the earliest was conducted in Mauritius by Murphy & Raman (1971). They identified all first admissions to the only hospital on the
144 J. Leff and others
Table 12. Five-year outcome of IPSS
schizophrenic patients by centre compared with other studies in developing countries
Location IPSS centres Aarhus Agra Cali Ibadan London Moscow Prague Washington Other studies Mauritius Hong Kong Chandigarh Sri Lanka Length of follow-up in years 5 5 5 5 5 5 5 5 12 10 5 5 % with full information 94 74 92 59 65 86 86 53 98 62 58 98 % with best outcome 6 42 11 33 5 6 9 17 59 21 29 40 % with worst outcome 40 10 21 10 14 21 23 23 24 32 32 29
island during the year 1956 who were given a diagnosis of schizophrenia. They succeeded in tracing 98 % of the sample 12 years after the first admission, and defined the best outcome as complete recovery from the initial episode and no further episodes during the follow-up period. This is identical with Pattern of Course 1 in this study, allowing comparison between the two sets of data. In the Mauritian follow-up 59% of the sample exhibited this outcome, a higher proportion than in any of the IPSS centres. This may be explained by the fact that the Mauritian sample comprised first admitted patients only, whereas the IPSS samples were mixtures of first admissions and readmissions.
Two studies of first admitted schizophrenic patients with findings that conflict with those of Murphy & Raman were conducted in Hong Kong by Lo & Lo (1977) and in Chandigarh by Kulhara & Wig (1978). In these two studies the proportion of patients with a complete recovery from the initial episode and no subsequent relapse was 21 and 29% respectively. Another comparable study was carried out by Waxier (1979) in Sri Lanka with results that supported those of Murphy & Raman, since 4 0 % of her sample conformed to the best outcome category. The findings of these four follow-up studies in developing countries are displayed alongside the five-year follow-up data from the IPSS centres for comparison. At first, it might appear that the contradictory results from Hong Kong and
Chandigarh could be explained by the relative incompleteness of follow-up. This explanation has some cogency since the current study has shown that in an extended follow-up it is the patients with the best outcome who are most likely to be lost from the cohort. Furthermore, in the Determinants of Outcome Project (Sartorius et al. 1986) follow-up of an epidemi-ologically based sample of schizophrenic patients in the Chandigarh centre revealed a significantly better outcome than comparable patients in developed countries. Evidence against this in-terpretation is provided by data from the Cali centre (Table 12) in which the follow-up was virtually complete, while the proportion of patients with the best pattern of course was low. On the other hand, Ibadan had the least complete follow-up of the IPSS centres, but a high proportion of patients with the best outcome.
It is evident that completeness of the follow-up is not a satisfactory explanation for the divergent findings from developing countries. But taken as a whole the data do indicate a better outcome for schizophrenia in some devel-oping countries compared with developed coun-tries. One possible explanation is that the samples from the developing centres contain a disproportionate number of patients with acute, rapidly resolving psychoses which have an inherently better prognosis. This explanation is not supported by the results of the log-linear modelling, which demonstrated that acuteness of onset as a predictive factor did not detract from the effect of the developing/developed dichotomy. Another explanation involves the greater tolerance for and acceptance of schizo-phrenic patients by family members in devel-oping countries. We have referred to this above in relation to the data from Cali, and evidence for this is provided by the Chandigarh sub-study on relatives' Expressed Emotion in the Deter-minants of Outcome project (Leff et al. 1987, 1990). In Chandigarh, the low levels of relatives' Expressed Emotion were associated with a better clinical outcome at one-year and at two-year follow-up. However, this was not the situation in Cali where patients had a similar clinical course to those in developed countries, but had a superior social outcome. Therefore, although the tolerance of relatives might be invoked as a partial explanation for the better clinical out-come of schizophrenic patients in Agra and
Ibadan, different factors must be operating in Cali. These may be linked with the nature of the city of Cali, which has moved further in the direction of urbanization and industrialization than either Agra or Ibadan. The sociodemo-graphic and cultural differences between these three IPSS centres need further exploration in order to understand the variation in the outcome of schizophrenia revealed by the five-year follow-up. It is noteworthy that patients in the IPSS sample with diagnoses other than schizophrenia also had better clinical and social outcomes in developing than in developed countries. There-fore it is possible that the social and cultural factors responsible for a good outcome operate across diagnostic boundaries.
APPENDIX
Collaborating investigators
Dr N. Sartorius, Principal Investigator, Dr T. Y. Lin, former principal investigator, Ms E. M. Brooke, Dr F. Engelsmann, Dr G. Ginsburg, Mr W. Gulbinat, Dr A. Jablensky, Mr M. Kimura, Dr A. Richman, Dr R. Shapiro, at WHO Headquarters, Geneva, Switzer-land; Dr E. Stromgren, chief collaborating inves-tigator, Drs A. Bertelsen, M. Fisher, C. Flack and N. Juel-Nielsen, Aarhus, Denmark; Dr K. C. Dube, chief collaborating investigator, and Dr B. S. Yadav at the field research centre in Agra, India; Dr C. Leon, chief collaborating investigator, and Drs G. Calderon and E. Zambrano at the field research centre in Cali, Colombia; Dr T. A. Lambo, chief collaborating in-vestigator, Dr T. Asuni and Dr M. O. Olatawura at the field research centre in Ibadan, Nigeria; Dr J. K. Wing, chief collaborating investigator, and Drs R. Prudo and J. P. Left" at the field research centre in London, United Kingdom; Dr R. A. Nadzharov, chief collaborating investigator and Dr N. M. Zharikov at the field research centre in Moscow, USSR; Dr L. Hanzlicek, chief collaborating inves-tigator, and Dr C. Skoda at the field research centre in Prague, Czechoslovakia and Dr W. Carpenter, Dr L. Wynne and Dr J. Strauss, chief collaborating investigators and Dr J. Bartko at the field research centre in Washington, DC, USA.
Funding for the project was derived from the World Health Organization, the National Institute for Mental Health, and the collaborating centres. REFERENCES
Bleuler. M. (1972). Die Schizophrenen Geistesstorungen im Lichte Langjdhriger Kranken-und Familien-Gesehichten. Thieme: Slultgart.
Ciompi, L. (1980). Catamnestic long-term study on the course of life and aging of schizophrenics. Schizophrenia Bulletin 6, 606-618. Harding, C. M., Brooks, G. W., Ashikaga, T., Strauss, S. S. &
Breier, A. (1987). The Vermont longitudinal study of persons with severe mental illness. 1: Methodology, study sample and overall status 32 years later. American Journal of Psychiatry 144, 718-726. Huber, G., Gross, G. & Schutller, R. (1975). A long-term follow-up study of schizophrenia: psychiatric course of illness and prognosis. Ada Psychiatrica Scandinavica 52, 49-57.
Jenkins, J. H., Karno, M., De La Selva, A. & Santana, F. (1986). Expressed Emotion in cross-cultural context: familial responses to schizophrenic illness among Mexican Americans. In Treatment of Schizophrenia (ed. M. J. Goldstein, I. Hand and K. Hahlweg), pp. 35-49. Springer-Verlag: Berlin.
Kulhara, P. & Wig, N. N. (1978). The chronicity of schizophrenia in North West India: results of a follow-up study. British Journal of Psychiatry 132, 186-190.
LefT, J. (1988). Psychiatry Around the Globe 2nd edn. Gaskell: London.
Left", J. P., Wig, N., Ghosh, A., Bedi, H., Menon, D. K., Kuipers, L., Korten, A., Ernberg, G., Day, R., Sartorius, N. & Jablensky, A. (1987). III. Influence of relatives' Expressed Emotion on the course of schizophrenia in Chandigarh. British Journal of Psychiatry 151, 166-173.
Left", J., Wig, N. N., Bedi, H., Menon, D. K., Kuipers, L., Korten, A., Ernberg, G., Day, R., Sartorius, N. & Jablensky, A. (1990). Relatives' Expressed Emotion and the course of schizophrenia in Chandigarh. A two-year follow-up of a first-contact sample. British Journal of Psychiatry 156, 351-356.
Leon, C. A. & Micklin, M. (1971). Opiniones communitarias sobre enfermedad mental y su tratamiento en Cali, Colombia. Ada Psiquiatrica y Psycologia de America Latina 17, 385-394. Lo, W. H. & Lo, T. (1977). A ten-year follow-up of Chinese
schizophrenics in Hong Kong. British Journal of Psychiatry 131, 63-66.
Murphy, H. B. M. & Raman, A. C. (1971). The chronicity of schizophrenia in indigenous tropical peoples. British Journal of Psychiatry 118,489-497.
Sartorius, N., Jablensky, A., Korten, A., Ernberg, G., Anker, M., Cooper, J. E. & Day, R. (1986). Early manifestations and first-contact incidence of schizophrenia in different cultures. Psycho-logical Medicine 16, 909-928.
Shepherd, M., Watt, D., Falloon, I. & Smeelon, N. (1989). The natural history of schizophrenia: a five-year follow-up study of outcome and prediction in a representative sample of schizo-phrenics. Psychological Medicine, Monograph Supplement 15. Stephens, J. H. (1978). Long-term prognosis and follow-up in
schizophrenia. Schizophrenia Bulletin 4, 25-47.
Tsuang, M. T., Woolson, R. F. & Fleming, J. A. (1979). Long-term outcome of major psychoses. Archives of General Psychiatry 36, 1295-1301.
Watt, D. C , Katz, K. & Shepherd, M. (1983). The natural history of schizophrenia: a 5-year prospective follow-up of a representative sample of schizophrenics by means of a standardized clinical and social assessment. Psychological Medicine 13, 663-670. Waxier, N. E. (1979). Is outcome for schizophrenia better in
non-industrial societies? The case of Sri Lanka. Journal of Nervous and Mental Diseases 167, 144-158.
Wing, J. K., Cooper, J. E. & Sartorius, N. (1974). The Description and Classification of Psychiatric Symptoms: An Instruction Manual for the PSE and CATEGO System. Cambridge University Press:
London.
World Health Organization (1973). The International Pilot Study of Schizophrenia vol. 1. WHO: Geneva.
World Health Organization (1979). Schizophrenia: An International Follow-up Study. John Wiley and Sons: Chichester.